GREEN NEW DEAL - STRENGTHENING DEMOCRACY - Tasmanian Greens MPs
←
→
Page content transcription
If your browser does not render page correctly, please read the page content below
STRENGTHENING DEMOCRACY

GREEN NEW DEAL
STRENGTHENING DEMOCRACY

In a healthy democracy, citizens have a voice and a vote as active participants in society. In
democratic societies, all individuals and groups, regardless of race, religion, gender, identity,
wealth or sexual orientation have a role in shaping law and policy.

In lutruwita/Tasmania as in many democratic societies, constant vigilance is needed to
ensure the foundations of our democracy are strong. This requires a robust, strategic
response.

The proportion of Tasmanians enrolled to vote has been increasing since 2010, from 95.1% in
2010 to 96.6% in 2020.1 Despite this, the number of voters turning up to vote at elections is
declining.

Figure 5.0.1 shows voter turnout between 1996 and 2018 at elections for: House of Assembly;
Local Government (combined); and three random Legislative Council Divisions (Derwent,
Huon and Mersey).

All five show some decline in voting between 1996 and 2018. There is a consistent downward
trend with all elections, although the Local Government and Division of Huon defied this trend
in their recent elections. Voter turnout is not a perfect civic engagement measure, but the
OECD considers it the best available.2

                                                      Figure 5.0.1: Voter turnout for select elections: 1996-20183
    100%

     95%

     90%

     85%
                                                                                               Local Government
     80%
                                                                                               House of Assembly
     75%
                                                                                               Division of Derwent
     70%
                                                                                               Division of Huon
     65%
                                                                                               Division of Mersey
     60%

     55%

     50%

1 Australian Electoral Commission, National enrolment figures by state/territory, 2021.
2 OECD, Civic Engagement, n.d.
3 Data compiled from Tasmanian Election Commission Election Reports.

                                                                                                                     1
Participation in civic and political groups declined from 12.8% in 20144 to 12.2% in 2019.5
A 2018 assessment of apathy in Australian politics found 20% of voters are generally
uninterested, 25% aren’t interested in election campaigns, and 33% don’t care who wins
elections. The author concludes that, despite an “exponential increase” in education and
information availability over the last 29 years, “it is likely that the extent of citizens’ political
interest and knowledge has changed little since Athens.”6
This finding challenges our understanding of what influences people’s engagement with
politics. Even though the link between education levels and political knowledge and
participation is well-documented, an increase in the overall level of education in Australia
hasn’t resulted in greater participation rates.7 And while other changes to key influences, such
as income inequality8 and age,9 should be increasing political participation and knowledge –
this doesn’t appear to be happening.
This illustrates the complexity of civic engagement.
The decreasing participation of citizens has, however, been matched with a declining trust in
politics. Polling by the ANU shows trust in political leaders and government has dropped, and
satisfaction with democracy has deteriorated.10 Lack of trust in politics often has a negative
impact on civic participation11 although this is by no means a simple relationship either.12,13
Tasmania’s electoral finance laws are the weakest in the country. The State also has
ineffectual transparency and accountability laws, which affects people’s confidence in the
decisions taken by government. There is a comparatively small number of members in the
House of Assembly. Fixing the flaws in our political system is not the only answer to
improving civic engagement, but it’s a strong place to start.
4 Australian Bureau of Statistics, General Social Survey: Summary Results, Australia, 2014, Table 3.3.
5 Australian Bureau of Statistics, General Social Survey: Summary Results, Australia, 2019, Table 15.3.
6 G Kramer, The Apathetic Country: Are Australians Interested In Politics And Does It Matter?, Doctoral dissertation, Queensland
University of Technology, 2018.
7
D E Campbell, What is education’s impact on civic and social engagement?, Chapter 3, Measuring The Effects of Education on
Health and Civic Engagement: Proceedings of The Copenhagen Symposium.
8 F Solt, Economic Inequality and Democratic Political Engagement, American Journal of Political Science, Vol. 52 (1), 2008.
9 L Saarelaht, Despite strong gains in 2020 Australians remain disengaged with politics, The McKinnon Prize, 2020.
10 S Cameron and I McAllister, Trends in Australian Political Opinion Results from the Australian Election Study 1987–2019,
Australia National University, 2020.
11 M Evans, Trust in politicians and government is at an all-time low. The next government must work to fix that, The
Conversation, 2019.
12 E A Bennett, A Cordner, P T Klein, S Savell, and G Baiocchi, Disavowing Politics: Civic Engagement in an Era of Political
Skepticism, American Journal of Sociology, Vol. 119 (2), 2013, pp. 518-48.
13 OECD, Trust in government, policy effectiveness and the governance agenda, Chapter 1, Government at a Glance 2013, 2013, p.
21.
2Chapter 5.1: Electoral Finance
Background
In 2018, ABC Fact Check found Tasmania’s donation laws would become the weakest in the
country after the Victorian Government made reforms.14 In the two years since, Victoria has
reformed their laws,15 and New South Wales,16 Queensland17 and the Northern Territory18 also
passed reforms enhancing their political donations and expenditure framework.
Western Australia has progressed legislation to set expenditure limits and ban foreign
donations.19 This means Tasmania has dropped even further behind the rest of the country
than when it was declared to have the weakest donation laws.
Figure 5.1.1: Comparison of electoral finance laws by jurisdiction20
Vic NSW Qld WA SA NT ACT Aus Tas
Donations
Caps (per term/4 years) $4,160 $26,400 $10,000 - - - - - -
Disclosure threshold $1,040 $1,000 $1,000 $2,500 $5,000 $1,500 $1,000 $13,500 $13,500
Third party donation limit 6 3 - - - - - - -
Disclosure time 21 Days Annual 7 Days Annual After Election Annual Annual Annual Annual
Third party regulation Yes Yes Yes Yes Yes Yes Yes No No
Donors
Foreign Banned - Banned Banned - - - - -
Property - Banned Banned - - - - - -
Tobacco - Banned - - - - - - -
Gambling - Banned - - - - - - -
Expenditure
Party, per candidate - $132,600 $57,000 - $100,000 - $42,750 - -
Party, per electorate - $66,400 $92,000 - - - - - -
Party cap (X electorate) - $132,600 - $125,000 $75,000 $40,000 - - -
Independent, per Seat - $198,700 $87,000 $125,000 $100,000 $40,000 $42,750 - -
Public Funding
$ per first preference vote $6.2521 $4.6622 $3.3023 $1.9724 $3.0025 - $8.6226 $2.8327 -
14 ABC News, Fact check: Does Tasmania have the weakest political donation laws in the nation?, Feb 2018.
15 ABC News, Victoria's got strict new laws on political donations but what does it mean?, Jul 2018.
16
Parliament of Australia, Election funding and disclosure in Australian states and territories: a quick guide, Nov 2018.
17
ABC News, Political donations and election spending capped in Queensland as 'historic' laws pass Parliament, Jun 2020.
18 ABC News, The NT political donations system has changed. But do the changes go far enough?, Aug 2020.
19 Parliament of Western Australia, Electoral Amendment Bill 2020, Bill Progress.
20 Data Source: Information compiled from a range of pages from each jurisdiciton’s respective Electoral Commission.
21
Victorian Electoral Commission, Yearly indexation of funding and donation thresholds 2018-2022, 2020.
22 NSW Electoral Commission, Election Campaigns Fund, 2020.
23 Electoral Commission Queensland, Fact sheet 20 - State elections: Election Funding Claims, 2020.
24 Western Australian Electoral Commission, Reimbursement of Electoral Expenditure, 2020.
25 Electoral Commission South Australia, Applying for public funding, n.d.
26 ACT Electoral Commission, Election funding, 2020.
27 Australian Electoral Commission, Election funding rates, 2020.
3Figure 5.1.1 shows Tasmania is the only state with no donation and expenditure laws (in
addition to federal requirements), without a disclosure threshold that’s lower than the federal
threshold, and without third party regulation.
Tasmania is one of only two states without expenditure limits during elections, and without
public funding for election campaigns.
Cap on Donations
The argument for a limit on the value of donations is simple – money buys influence, and the
larger the sum, the larger the influence. The Senate Committee into the Political Influence of
Donations noted that although proving that donations buy political outcomes is difficult, the
anecdotal evidence of this link is compelling.28
The relevance of the sum of money donated is well-summarised by the comments of an
anonymous politician in a 2018 study –
“If someone donates $1000, they support you. If they donate $100,000, they’ve bought
you.”29
Although the influence of smaller donations shouldn’t be discounted, as they can contribute to
long-term relationship building30 that influences policy in more subtle ways.
In 2018 a former Liberal Party Treasurer, Michael Yabsley, described habitual ‘soft corruption’
in the donations process – where donations are tied to for a commitment to meet with
particular ministers or political leaders.31 Yabsley called for a cap of $500.
The Senate Committee recognised any donations cap is relatively arbitrary, and on balance
have recommended a donation cap of $3,000 per term per donor.32
Regulations to cap donations should have two broad objectives; to decrease the potential
influence of a donor by limiting the size of donations, and to reduce the imbalance of a person
or corporation’s ability to support political preferences based on wealth.
A $3,000 cap on donations in Tasmania would curtail the potential influence of any given
donor, particularly as no cap currently exists. It also represents 0.375% of an $800,000
expenditure cap (Policy 5.1.4). A $3,000 cap would mean that risking the loss of revenue from
a single donor would be more palatable for political parties.
28 Senate Committee into the Political Influence of Donations, Senate Committee into the Political Influence of Donations: Final
Report, Chapter 3: Political donations: A corrupting influence?, Parliament of Australia, 2018.
29 Kypros, J McCambridge, N Robertson, F Martino, M Daube, P Adams, and P Miller, “If someone donates $1000, they support
you. If they donate $100,000, they’ve bought you.” Mixed methods study of tobacco, alcohol and gambling industry donations to
Australian political parties, Drug and Alcohol Review, Vol. 38, 2018.
30 Ibid, p. 17.
31 S Dingle and D Lewis, Liberal Party statesman calls for political donations reform as report highlights millions gifted
anonymously, ABC News, Oct 2018.
32 Senate Committee into the Political Influence of Donations, Senate Committee into the Political Influence of Donations: Final
Report, Chapter 6 Safeguarding integrity, Parliament of Australia, 2018.
4The average amount Australians donated to charity in 2017-18 was $764.33 This equates to
$3,056 over a four-year term – close to the $3,000 donations cap proposed by the Senate
Committee. While this does not perfectly level the playing field, it is a strong step towards
limiting the unfair influence that comes with having higher income.
Cap political donations Policy 5.1.1
A cap of $3,000, on aggregate political donations from the same source, per electoral term, will be
introduced.
Eligibility for Political Donations
Various jurisdictions in Australia have banned donations from foreign actors, property,
tobacco and gambling industries.
Figure 5.1.2: Comparison of electoral donation and expenditure laws by jurisdiction34
Vic NSW Qld WA SA NT ACT Aus Tas
Foreign Donors Banned - Banned Banned - - - Banned -
Property Donors - Banned Banned - - - - - -
Tobacco Donors - Banned - - - - - - -
Liquor and Gambling Donors - Banned - - - - - - -
Canadian donation laws go further, allowing only ‘natural persons’ who are citizens or
permanent residents to donate to political parties.35
Similar provisions to prohibit donations from anyone not on the electoral roll were enacted in
New South Wales in 2012. This law was overturned by the High Court in 2013.36 The Court’s
judgement was based on a failure to satisfy the Lange test37, which requires that limits on
freedom of political communication be –
“. . .reasonably appropriate and adapted, or proportionate, to serve a legitimate end in a
manner which is compatible with the maintenance of the prescribed system of
representative government.”38
The High Court found there was no clear purposes articulated for the prohibition, and on that
basis rejected the provision as unconstitutional.39 The provision itself was therefore not found
to be intrinsically unconstitutional – rather NSW had not clearly stated the aims and evidence
for that provision.
33
Philanthropy Australia, Giving in Australia: the fast facts, Sep 2020.
34 Data Source: Information compiled from a range of pages from each jurisdiciton’s respective Electoral Commission.
35 Library of Congress, Regulation of Campaign Finance and Free Advertising: Canada, 2020.
36 High Court of Australia, Unions NSW v New South Wales, 2013, HCA 58.
37 Ibid.
38 Ibid.
39 Ibid.
5NSW also required a person to be registered on the electoral roll, whereas the Canadian laws
only require a person to be a ‘natural person’ (i.e. not a corporation), as well as either a citizen
or permanent resident, which are less restrictive requirements.
The objectives of each of these laws are clear – to prevent financial influence by attempting to
buy a political outcome, and to prevent the privileged access to political influence that comes
with corporations being able to donate money.
Limiting donations to natural persons Policy 5.1.2
Political donations will only be allowed from ‘natural persons’ who are citizens or permanent residents.
Real-time Disclosure
Tasmania’s donation disclosure framework is currently only covered by inadequate federal
legal requirements. Federal laws require reporting by February on the previous financial year’s
donations. This means donations can take up to 18 months to be disclosed. 40
There was general agreement among submitters to the 2018 Senate Inquiry that disclosure in
real-time was the most desirable approach to donation disclosure.41
Real-time disclosure means setting a relatively brief timeframe from the time of receipt to the
public disclosure of a donation. Under the current system, disclosure is at a fixed date (which
could be well after an election) when a report of all donations required to be disclosed must be
submitted.
Queensland requires donations to be disclosed 7 business days after being received, except in
the 7 days before polling day when donations must be disclosed within 24 hours. 42 This
ensures virtually all donations received before an election are publicly available for scrutiny.
Victoria, the only other state to adopt real-time disclosure laws, requires a 21-day timeframe,43
which is not optimum for public scrutiny just prior to an election.
Tasmania’s election period is between 22 and 30 days before polling day.44 If Victoria’s 21-day
disclosure timeframe was adopted, somewhere around 70-95% of Tasmanian donations
would not have to be disclosed before polling day.
Real-time disclosure of political donations Policy 5.2.3
Tasmania will enact Queensland’s real-time disclosure framework, requiring donation disclosures 7
business days after receipt, and within 24 hours during the 7 days before election polling day.
40 Senate Committee into the Political Influence of Donations, Senate Committee into the Political Influence of Donations: Final
Report, Chapter 5: Barriers to transparency, Parliament of Australia, 2018, p. 74.
41 Ibid, p. 75.
42 State of Queensland, Electoral Regulation 2013.
43 State of Victoria, Electoral Act 2002, Part 12, Division 3, pp. 252-256.
44 State of Tasmania, Electoral Act 2004, s. 70.
6Electoral Expenditure Caps
Tasmania and Victoria are the only Australian jurisdictions without expenditure caps for lower
house elections (figure 5.1.3). Federal elections also do not have expenditure caps. Most
jurisdictions impose a cap on spending for independent candidates, and a cap on parties (a
dollar amount multiplied by the number of electorates the party has endorsed candidates
within). This cap can often be distributed across electorates, in excess of a candidate’s
electorate cap.
Other than the ACT, all jurisdictions differ from Tasmania in that they have single member
electorates. Therefore, the prevailing formula would not work for Tasmania.
Figure 5.1.3: Comparison of electoral expenditure caps by jurisdiction45
Party / Candidate Party / Electorate Party Cap (X Electorate) Independent Members / Electorate Electorates
Vic - - - - 1 88
NSW $132,600 $66,400 $132,600 $198,700 1 93
Qld $57,000 $92,000 - $87,000 1 93
WA - - $125,000 $125,000 1 59
SA $100,000 - $75,000 $100,000 1 47
NT - - $40,000 $40,000 1 25
ACT $42,750 - - $42,750 5 5
Aus - - - - 1 151
Tas - - - - 5 5
In 2013, the Electoral Amendment (Electoral Expenditure and Political Donations) Bill 2013
passed the Tasmanian House of Assembly, but stalled at the first reading stage in the
Legislative Council.46 The bill would have imposed expenditure caps of $75,000 for candidates
and $750,000 for a party, increasing by $1,000 and $10,000 per year respectively.47
A key distinction between the Bill’s model and what occurs in other jurisdictions is the overall
party cap is not tied to the number of candidates – or the number of electorates – in which a
party runs.
At 2020, a cap under this proposed model of $810,000 would equate to a cap of either
$162,000 per electorate; or $32,400 per candidate (if there were five candidates in an
electorate).
In 2018, the Liberals, Labor and Greens all fielded five candidates in each electorate.48 The
other parties to run candidates were the Jacqui Lambie Network, T4T (Tasmanians 4
Tasmania), and the Shooters, Fishers and Farmers Party.
Figure 5.1.4 shows these other parties were significantly short of the expenditure cap that
would be applied if the 2013 proposal was adapted to either an electorate or candidate-based
donation cap scheme.
45 Data Source: Information compiled from a range of pages from each jurisdiciton’s respective Electoral Commission.
46 Parliament of Tasmania, Electoral Amendment (Electoral Expenditure and Political Donations) Bill 2013, 2013 Bills.
47 Parliament of Tasmania, Electoral Amendment (Electoral Expenditure and Political Donations) Bill 2013.
48 Tasmanian Electoral Commission, 2018 State Election Results.
7Figure 5.1.4: Minor party 2018 election statistics49
Electorates Candidates Expenditure Electorate Cap Candidate Cap
T4T 2 4 $0 $324,000 $129,600
Jacquie Lambie Network 3 12 $93,255 $486,000 $388,800
Shooters, Fishers and Farmers Party 4 11 $59,314 $648,000 $356,400
The proposed party cap under the Electoral Amendment (Electoral Expenditure and Political
Donations) Bill 2013 was ten times higher than an individual candidate cap. The average
electorate expenditure would, therefore, allow for twice as much expenditure as an
independent candidate to cover the campaigns of five party-endorsed candidates.
On an individual level this would provide for lower candidate expenditure for endorsed
candidates compared to independents.
Given parties have access to professional electoral apparatus, dedicated volunteer
workforces, and can promote a shared platform, this unproportionate system is justified on
the grounds that it engenders more equity between independent and party candidates.
It is worth noting no independent candidate has been elected during a House of Assembly
election since 1996, the last election before the House of Assembly was reduced from 35 to
25 seats.50 Even prior to the 1998 reduction in seats, the election of independents was not
common.51
The Electoral Amendment (Electoral Expenditure and Political Donations) Bill 2013 was
consulted on and did not create any controversy.52 Given the acceptance of the proposed
expenditure cap, and the historic practical irrelevance of adjusting the cap formula based on
the approach of other states, there is no need to alter the proposal.
Caps on electoral expenditure Policy 5.1.4
Tasmania will enact the electoral expenditure rules intended to be imposed by the Electoral
Amendment (Electoral Expenditure and Political Donations) Bill 2013, providing a cap of $81,000 for
individual candidates and $810,000 for political parties in 2020, indexed by $1,000 and $10,000
respectively per year.
Public Funding of Election Campaigns
In Australia, public funding of election campaigns operates as a reimbursement of electoral
expenditure based on the lower value of a dollar figure per first preference vote, or total
49 Australian Electoral Commission, Political Party Returns, AEC Transparency Register.
50 Tasmanian Electoral Commission, Parliamentary Elections Report (1995 - 1997), 1997.
51 Tasmanian Electoral Commission, Previous Parliamentary Election Reports from 1909 to 2014.
52 Parliament of Tasmania, Electoral Amendment (Electoral Expenditure and Political Donations) Bill 2013 Fact Sheet, 2013.
8electoral expenditure.53 The intent of public funding is to level the playing field for candidates
and reduce the reliance on, and influence from, private donations.54
Every Australian jurisdiction, other than Tasmania and the Northern Territory, has public
funding of elections. Progress has been made in the Northern Territory, with a 2018 inquiry
recommending public funding. The NT Government accepted this recommendation in
principle, but has not yet enacted changes.55
The funding rate in jurisdictions ranges from $1.97 to $8.62 per first preference vote –
averaging at $4.38. An estimate of the total coverage of electoral expenditure produces a
range of 14% to 53%. The coverage, however, can be unpredictable from election to election.
On 2020 numbers, the average maximum coverage rate was 35% across Australia (Figure
5.1.5), whereas an assessment using the same methodology in early 2019 found an average
maximum coverage rate of 52%.56
Figure 5.1.5: Public funding of elections by jurisdiction57
Jurisdiction Labor Greens Liberals Total58 Voters59 Funding Total Cost60 Coverage61
Australia $50,767,513 $4,489,151 $43,537,437 $98,794,101 16,722,156 $2.8362 $47,323,701 48%
ACT $2,668,439 $535,944 $1,790,105 $4,994,488 304,524 $8.6263 $2,624,997 53%
NSW $18,153,347 $6,987,548 $48,364,378 $73,505,273 5,328,989 $4.6664 $24,833,089 34%
VIC $29,109,394 $6,190,688 $32,720,536 $68,020,618 4,266,039 $6.2565 $26,662,744 39%
QLD $15,908,937 $1,596,334 $16,842,285 $34,347,556 3,368,831 $3.3066 $11,117,142 32%
WA $9,816,907 $1,943,644 $12,610,057 $24,370,608 1,693,059 $1.9767 $3,335,326 14%
SA $4,914,699 $472,998 $7,957,593 $13,345,290 1,227,189 $3.0068 $3,681,567 28%
Average $4.38 35%
Figure 5.2.6 presents the costs for public funding of House of Assembly elections in
Tasmania, under various scenarios. The assessment examines a business as usual scenario,
a party expenditure cap of $810,000 scenario, and an expenditure cap and $3,000 donations
cap scenario. These three scenarios are tested against the Australian average funding rate of
$4.38 per vote, the funding required to meet the Australian average coverage rate of 35%, and
using the Australian rate of $2.83 per vote.
53 Australian Electoral Commission, Election funding, 2020.
54 Joint Standing Committee on Electoral Matters, Inquiry into the funding of political parties and election campaigns, Chapter 6,
Parliament of Australia, 2011.
55 S Vivian, The NT political donations system has changed. But do the changes go far enough?, ABC News, August 2020.
56 Tasmanian Greens MPs, Electoral Act Review Submission, 2019.
57 Note: assessment done on an ‘if an election was held today’ basis, assumes donations equal to jurisdiction’s previous election.
58 Australian Electoral Commission, AEC Transparency Reigster, 2019.
59
Australian Electoral Commission, Size of the electoral roll and enrolment rate 2020, 2020.
60
Note: this is a maximum cost, and would be lower due to voter turn out, inelligible votes, candidates not reaching a threshold,
and the distribution of votes not perfectly aligning with electoral expenditure.
61 Note: this is a maximum coverage rate, and would be lower due to voter turn out, inelligible votes, candidates not reaching a
threshold, and the distribution of votes not perfectly aligning with electoral expenditure.
62
Australian Electoral Commission, Election funding rates, 2020.
63 ACT Electoral Commission, Election funding, 2020.
64 NSW Electoral Commission, Election Campaigns Fund, 2020.
65 Victorian Electoral Commission, Yearly indexation of funding and donation thresholds 2018-2022, 2020.
66 Electoral Commission Queensland, Fact sheet 20 - State elections: Election Funding Claims, 2020.
67 Western Australian Electoral Commission, Reimbursement of Electoral Expenditure, 2020.
68 Electoral Commission South Australia, Applying for public funding, n.d.
9Figure 5.1.6: Public funding of elections in Tasmania by scenario
Labor Greens Liberals Total69 Voters70 Funding Cost71 Coverage72
Australian average funding
Business as usual $928,050 $547,059 $4,322,681 $5,797,790 390,450 $4.38 $1,710,171 29%
Expenditure cap $810,000 $547,059 $810,000 $2,167,059 390,450 $4.38 $1,710,171 79%
Expenditure cap, donations cap $690,722 $479,559 $810,000 $1,980,281 390,450 $4.38 $1,710,171 86%
Australian average coverage
Business as usual $928,050 $547,059 $4,322,681 $5,797,790 390,450 $5.20 $2,029,227 35%
Expenditure cap $810,000 $547,059 $810,000 $2,167,059 390,450 $1.94 $758,471 35%
Expenditure cap, donations cap $690,722 $479,559 $810,000 $1,980,281 390,450 $1.78 $693,098 35%
Australian rate
Business as usual $928,050 $547,059 $4,322,681 $5,797,790 390,450 $2.83 $1,104,974 19%
Expenditure cap $810,000 $547,059 $810,000 $2,167,059 390,450 $2.83 $1,104,974 51%
Expenditure cap, donations cap $690,722 $479,559 $810,000 $1,980,281 390,450 $2.83 $1,104,974 56%
Under an expenditure and donations cap scenario, the maximum costs range from $693,098
to $1,710,171 every four years, and the maximum coverage ratio ranges from 35% to 86%.
In determining an appropriate funding level, it is worth noting that the 2011 Inquiry into the
funding of political parties and election campaigns by the Federal Parliament Joint Standing
Committee on Electoral Matters found the public funding scheme at the time had not been
effective at curbing the increase of election spending.73 An assessment of expenditure since
then suggests this is still the case.74
This suggests that in a vacuum, public funding has done little to curb the influence of political
donations. However, the Federal scheme has not operated in an environment with strict
expenditure and donation caps, or with bans on donations from corporate interests. The
effect a public funding scheme would have, where other limits are in place, remains to be
seen.
The committee did, however, recognise that repealing the scheme would have a detrimental
effect on minor parties, suggesting that the objective of levelling the playing field has been
effective.75
Adopting the Australian rate would provide Tasmania with the second lowest cost, after
Western Australia, of any State scheme, while also providing the highest maximum coverage
rate based on projections of 2018 expenditure under proposed new donation rules.
69
Australian Electoral Commission, AEC Transparency Reigster, 2019. Note: donations cap calculated on available information.
70 Australian Electoral Commission, Size of the electoral roll and enrolment rate 2020, 2020.
71 Note: this is a maximum cost, and would be lower due to voter turn out, inelligible votes, candidates not reaching a thresshold,
and the distribution of votes not perfectly aligning with electoral expenditure.
72
Note: this is a maximum coverage rate, and would be lower due to voter turn out, inelligible votes, candidates not reaching a
threshold, and the distribution of votes not perfectly aligning with electoral expenditure.
73 Joint Standing Committee on Electoral Matters, Inquiry into the funding of political parties and election campaigns, Chapter 6,
Parliament of Australia, 2011.
74 Australian Electoral Commission, AEC Transparency Reigster, 2019.
75 Joint Standing Committee on Electoral Matters, Inquiry into the funding of political parties and election campaigns, Chapter 6,
Parliament of Australia, 2011.
10Considering the available evidence of effectiveness, the effect of other reforms, the costs to
the public purse and expectations of the general public, tying the Tasmanian public funding
rate to the Australian rate would be a reasonable first step.
Public Funding of Elections Policy 5.1.5
A public funding scheme for House of Assembly elections will be introduced, providing a
reimbursement at the Australian rate (currently $2.83 per first preference vote).
Each jurisdiction where public funding for elections occurs requires a minimum of 4% of the
primary vote for eligibility,76,77,78,79,80,81 with the exception of 6% in Queensland.
The 4% minimum vote threshold was criticised by the Federal Parliament Joint Standing
Committee on Electoral Matters, which noted
“minor parties and independent candidates can attract significant electoral support
without passing the 4 per cent threshold for receiving public funding.”82
The only rational for a threshold canvassed by the committee was for cost-saving purposes.83
Public funding schemes are based on a monetary value being assigned to a first preference
vote, as such there is a strict ceiling (the number of enrolled voters) on amounts payable.
Excluding eligibility on the basis of a voting threshold therefor has minimal implications for
public cost, but may deter potential candidates who are not in a financial position to risk not
qualifying for a rebate.
Figure 5.1.7: Candidates receiving less than 4% of vote in 2018 House of Assembly elections84
Bass Braddon Denison Franklin Lyons Total
Brett Edwards 597 597
Shooters, Fishers and Farmers 1611 1190 2041 2798 7,640
T4T 276 709 985
Brenton Best 593 593
Craig Garland 1967 1,967
Liz Hamer 141 141
Tenille Murtagh 153 153
Kim Peart 158 158
Total 12,234
Figure 5.3.3 examines candidates and political parties that received less than 4% of the vote
on aggregate across the electorates they ran candidates in during the 2018 House of
76 Australian Electoral Commission, Election funding, 2020.
77 ACT Electoral Commission, Election funding, 2020.
78 Western Australian Electoral Commission, Reimbursement of Electoral Expenditure, 2020.
79
Electoral Commission South Australia, Applying for public funding, n.d.
80 Victorian Electoral Commission, Funding, 2020.
81 NSW Electoral Commission, Election Campaigns Fund, 2020.
82 Joint Standing Committee on Electoral Matters, Inquiry into the funding of political parties and election campaigns, Chapter 6,
Parliament of Australia, 2011.
83 Ibid.
84 Tasmanian Electoral Commission, 2018 State Election Results, 2018.
11Assembly election. The total number of votes that would have been excluded for payment
under a 4% scheme was 12,234 out of 334,871 total formal votes.
Under a $2.83 per first preference vote scheme a 4% threshold would have saved $34,622
from a total $947,684 bill. This is a paltry 3.6% saving.
Eligibility Threshold for Public Funding of Elections Policy 5.1.6
The public funding scheme for House of Assembly elections will not require candidates or parties to
achieve a certain proportion of first preference votes in order to be eligible for reimbursement.
Third Parties and Enforcement
Many of the reasons for reform of electoral finance laws in relation to political candidates and
parties also apply to third parties. Third parties can also be used in an attempt to circumvent
electoral laws.85 For electoral finance regulation to operate effectively, there needs to be
appropriate enforcement mechanisms and financing of enforcement activities.86
Third Parties and Enforcement Policy 5.1.7
Third party regulations, offences, and consequential regulations will be developed to remove loopholes
and maximise the effect of electoral finance regulations.
85 Senate Committee into the Political Influence of Donations, Senate Committee into the Political Influence of Donations: Final
Report, Chapter 4:Third Party Regulation, Parliament of Australia, 2018, p. 45.
86 M Anderson, J C Tham, Z Nwokora, A Gauja, S Mills, N Miragliotta, Less Money, Fewer Donations: The Impact of New
South Wales Political Finance Laws on Private Funding of Political Parties, Australian Journal of Public Administration, vol. 77 (4),
p. 810.
12Chapter 5.2: Truth in Political
Advertising
Background
Truth in political advertising laws are provisions which prohibit false statements in political
advertising during election campaigns. These laws can establish offences or allow for the
removal of statements.
South Australia was the first jurisdiction in Australia to introduce truth in political advertising
laws in 1985 (with the exception of Commonwealth laws which were passed in 1983 but
repealed a year later).87 In 2020, the ACT passed laws modelled on South Australia’s.88
The South Australian provisions, which ban a ‘statement purporting to be a statement of fact
that is inaccurate and misleading to a material extent’, were found to be the strongest example
of such a law by a 2019 United Kingdom analysis.89 Despite some issues with the legislation,
the assessment found the laws to be reliable, workable and fair.90
Tasmanian Laws
The Tasmanian Electoral Act 2004 contains:
• offences for advertising that is misleading or deceiving in relation to the recording of a
vote;91
• bans distribution of political advertisements and ‘how to vote’ cards on election day; 92
and
• a ban on the publishing of political advertisements that refer to a candidate by name
without that candidate’s permission.93
These provisions don’t prohibit dishonest political communications.
87 G Williams, Truth in Political Advertising Legislation in Australia, Law and Bills Digest Group, Parliamentary Library, Parliament
of Australia.
88 J Evans, ACT passes new political advertising laws to ensure voters are not 'deceived on the way to the ballot box', ABC News,
Aug 2020.
89 A Renwick and M Palese, Doing Democracy Better: How Can Information and Discourse in Election and Referendum
Campaigns in the UK Be Improved?, University College London, The Constitution Unit, 2019, p. 22.
90 Ibid, p.p. 38-39.
91 Tasmanian Government, Electoral Act 2004, S. 197.
92 Ibid, S. 198.
93 Ibid, S. 196.
13The ban on referring to a candidate by name may, in some contexts, limit the capacity to
make misleading statements about candidates – in that it limits making any statement about
an individual candidate. However, the law does not ban misleading statements about political
parties – and these are the main form of political advertising about opponents during a House
of Assembly election.
These provisions have been argued to potentially apply to matters as broad as social media
posts by the Tasmanian Electoral Commission.94 This is likely to be unconstitutional,95 but
most people are unlikely to risk the possibility of having to finance a High Court challenge.
Repeal of Ban on Referring to Candidates by Name Policy 5.2.1
Section 196 of the Electoral Act 2004, which prohibits referring to a candidate by name without their
written consent, will be repealed. This provision will be replaced by a ban on distributing
advertisements purporting to be on behalf of a candidate without the permission of that person.
Problems with Truth in Political Advertising Laws
The scope of truth in political advertising laws are deliberately tight – they apply to ‘a
statement of fact that is inaccurate and misleading to a material extent’.
In South Australia, the Electoral Commission has to seek legal advice from the Crown
Solicitor’s Office to determine if a statement is misleading, which takes considerable time. The
SA Commission has also received paperwork “some 22-25 cm high” in the form of supporting
documentation.96 Such tactics could be used to delay a decision until after election day –
particularly during the crucial last days of a campaign.97
Truth in Political Advertising Laws Policy 5.2.2
Tasmania will develop ‘truth in political advertising’ laws. These laws will be modelled on South
Australian legislation, but will only require the Commissioner to be satisfied that the advertisement is
inaccurate and misleading to a material extent. Appeal rights will be available if a statement correction
is directed to be issued, guidelines will be developed and published by the Commissioner, and
legislated timeframes will be established for determinations.
The South Australian Electoral Commission, which administers SA’s truth in political
advertising laws, has been critical of their role in administering the law – a scepticism shared
by the Victorian Electoral Commission when submitting to an inquiry around similar laws.98
94 Letter from the Tasmanian Electoral Commission to the Greens.
95
Legal advise obtained by the Greens and accepted by the Office of the Director of Public Prosecutions.
96 Victorian Electoral Commission, Inquiry into the impact of social media on elections and electoral administration: Submission
from the Victorian Electoral Commission, 2020, p. 14.
97 A Renwick and M Palese, Doing Democracy Better: How Can Information and Discourse in Election and Referendum
Campaigns in the UK Be Improved?, University College London, The Constitution Unit, 2019, p. 39.
98 Victorian Electoral Commission, Inquiry into the impact of social media on elections and electoral administration: Submission
from the Victorian Electoral Commission, 2020, pp. 12-14.
14Complaints made include the time needed to administer disputes can draw substantial
resources away from the key role of managing elections, that it’s not the core business of
Electoral Commissions to discern truth, disputes can take much time to resolve, and it
undermines the independence of the Commission if they become involved in political
controversy.99
Political Advertising Commissioner Policy 5.2.3
A statutory Political Advertising Commissioner will be established. An assessment of the appropriate
officer to be the Commissioner will be undertaken – with a specific assessment of the Tasmanian
Electoral Commission and the Office of the Ombudsman. The matter of the resourcing required will
also be canvassed.
99 Ibid.
15Chapter 5.3: Transparency and
Accountability
Background
Major party governments in Tasmania have long had a challenges with transparency and
accountability, and close ties with vested interest groups.
The Global Right to Information Rating project run by the Centre for Law and Democracy
rates Australia as being 67th down the list of 128 countries. As a country, we only score of 84
out of a total possible 150.100
In 2020, the Tasmanian Ombudsman found our government has the worst record in the
country for refusing to release information to the public. Tasmania was twice as bad as the
next highest Australian jurisdiction, and 750% the rate of refusal of the most transparent
Australian jurisdiction.101
Tasmania is the only jurisdiction in Australia without an offence of misconduct in public
office,102 and the state’s Integrity Commission has a poor track record of using the full extent
of its powers.103
Information Disclosure
The Global Right to Information Rating project rates Afghanistan and Mexico as the top
scoring right to information frameworks.104 Both frameworks are quite different to the
Tasmanian Right to Information Act 2009 and other Australian laws.
The Afghan and Mexican laws govern information transparency more broadly. Mexico, for
example, sets requirements for hundreds of types of documents to be automatically
disclosed.105 Figure 5.3.1 outlines some of the differences between these laws and the
Tasmanian Act.
100 Global Right to Information Rating, By Country, Centre for Law and Democracy, 2020.
101 Ombudsman Tasmania, Annual Report 2019-20, 2020, p. 29
102 Parliament of Australia, Select Committee On a National Integrity Commission Report, Chapter 3, 2017.
103 A Humphries, Why doesn't Tasmania have a 'true' corruption commission?, ABC News, Mar 2019.
104 Global Right to Information Rating, By Country, Centre for Law and Democracy, 2020.
105 The United Mexican States, General Act of Transparency and Access to Public Information, 2015.
16Figure 5.3.1: Comparison of right to information laws
Afghanistan106 Mexico107 Tasmania108
A Parliamentary Committee Yes Yes No
Automatic disclosure of certain information Yes Yes No
Officers subject to duties Yes Yes No
Expedited timeframes for certain matters Yes No No
Application fee No No $41.50
Institutional exemptions No No Yes
Includes NGOs funded by Government Yes Yes No
Government documents to be machine-readable Yes Yes No
Accessibility of information provisions Yes Yes No
Many of the issues with the operation of the Tasmanian Act are cultural, including matters
relating to political pressure and influence. These matters are difficult to prevent in the context
of an information disclosure framework.
However, laws that provide for automatic disclosure of information help set a culture of
transparency and ensure the monitoring that’s needed to maintain it. This would improve the
integrity of information assessments and reduce the need for having them in the first place.
New Information Accessibility and Transparency Laws Policy 5.3.1
The Right to Information Act 2009 will be repealed and replaced with an Information Accessibility and
Transparency Act. This will govern general information accessibility and transparency standards as
well as provide for an information disclosure framework.
Another reason for the cultural issues surrounding the right to information process in
Tasmania is the Ombudsman is not empowered to issue formal findings against agencies
when they underperform. The Office of the Ombudsman can overturn decisions and publish
general findings in the Annual Report, but it can’t formally sanction agencies if they
underperform or systemically misapply the Act.
Transparency and Information Commissioner Policy 5.3.2
The Information Accessibility and Transparency Act will establish a Transparency and Information
Commissioner, with the Ombudsman appointed as Commissioner. The Commission will measure and
report on compliance with the Act, make general recommendations about the state of transparency
and accessibility of information, and be empowered to issue formal performance improvement notices
to agencies.
106 Islamic Republic of Afghanistan Access to Information Law, unofficial translation, Centre for Law and Democracy, 2019.
107 The United Mexican States, General Act of Transparency and Access to Public Information, 2015.
108 Tasmanian Government, Right to Information Act 2009, 2019.
17Non-Government Services
A significant distinction between the Afghan and Mexican laws, and the Tasmanian Act, is that
NGOs are captured.
The Afghan Decree includes organisations that are “substantially funded by one of the
institutions defined above as well as any other body which undertakes a public function.”109 The
Mexican law is broader and captures “any individual, legal entity or union who receives and
uses public resources or performs acts of authority of the Federation, the States and the
municipalities.”110
By contrast, the Tasmanian Act only captures information relevant to NGOs if the information
is held by a public authority.111 This information can be exempted on the grounds that it
relates to trade secrets, would likely put the third party at a competitive disadvantage, 112 or
that it was information communicated in confidence which would likely impair the ability to
obtain such information in the future.113
A strict interpretation of the Act does not allow for the presumption that the information is
exempt, however, this is how it works in practice. While review mechanisms to challenge
information being with-held are available, these can take years to finalise. For example, one
review application relating to merely two pages of documents took five years to complete. 114
Some of the most high-profile Tasmanian political controversies in recent history have related
to the activities of the NGOs Safe Pathways115 and the Brahminy Foundation.116 Both NGOs,
which were contracted to deliver government services in the out-of-home child care system.
NGO Transparency Policy 5.3.3
The Information Accessibility and Transparency Act will require NGOs that have contracts for
government service delivery to provide a minimum amount of information reporting, and be subject to
the information disclosure framework.
Misuse of Commercial in Confidence
The classification of “commercial in confidence” in Tasmania law and government
administration is vague and inconsistent. Departments regularly publish information in annual
reports that includes the name of contract suppliers, the period of contracts, and their
109
Islamic Republic of Afghanistan Access to Information Law, Article 3, unofficial translation, Centre for Law and Democracy,
2019.
110 The United Mexican States, General Act of Transparency and Access to Public Information, Article 3, 2015.
111 Tasmanian Government, Right to Information Act 2009, S. 8, 2019.
112
Ibid, S. 37.
113 Ibid, S. 39.
114 Ombudsman Tasmania, Nick McKim and Department of Primary Industries, Parks, Water, and the Environment, Ombudsman
Tasmania decision.
115 R Whitson and E Coulter, Safe Pathways: audit shows children not removed for months after first complaint, ABC News, 2018.
116 A Fromberg, Calls for Tasmanian children in controversial NT program run by Allan Brahminy to be brought home, ABC News,
2020.
18value.117 In some cases, a description of the consultancy is also provided.118 Given tenders are
publicly issued, all of this information could easily allow a competitor to discern how much a
successful bidder has been paid for a contract, and what they have been paid to do.
Controversial arrangements, such as lease and licence conditions and costs for developments
in National Parks, are routinely withheld on the grounds of ‘commercial in confidence’.
Departments have routinely been found to be misapplying ‘commercial in confidence’
provisions of the Right to Information Act 2009.119,120,121,122 These public revelations of
government departments withholding information has not stopped them from continuing to
make the same determinations.
Commercial Information Policy 5.3.4
The Information Accessibility and Transparency Act will require the disclosure of details of contracts,
leases and licences, including location, value, entities and minimum details of terms and conditions.
The act will also provide detailed definitions relating to commercial in confidence provisions.
Misconduct in Public Office
Tasmania is the only jurisdiction in Australia without an offence of misconduct in public office.
This was publicly emphasised when an outgoing Integrity Commissioner strongly
recommended such an offence be established.123 The State Government’s position has been
that suitable offences already exist.124 Despite this position, there have been a range of
serious findings of nepotism and misconduct that have not resulted in prosecution. 125
Misconduct in Public Office Policy 5.3.5
An offence of Misconduct in Public Office will be established.
117 Department of State Growth, Annual Report: 2019-20, 2020, p. 21.
118
Department of Communities Tasmania, Annual Report: 2019-20, 2020, p. 45.
119
Ombudsman Tasmania, Nick McKim and Department of Primary Industries, Parks, Water, and the Environment, Ombudsman
Tasmania decision, 2019.
120 Ombudsman Tasmania, Environment Tasmania and Department of Primary Industries, Parks, Water, and the Environment,
Ombudsman Tasmania decision, 2019.
121
Ombudsman Tasmania, Mandy Squires and Department of Primary Industries, Parks, Water, and the Environment,
Ombudsman Tasmania decision, 2019.
122 Ombudsman Tasmania, Richard Baines and Department of Health and Human Services, Ombudsman Tasmania decision,
2017.
123 Parliament of Australia, Select Committee On a National Integrity Commission Report, Chapter 3, 2017.
124 Parliament of Tasmania, Transcript of Debate, House of Assembly Hansard, Wednesday 23 September 2015.
125 A Humphries, Why doesn't Tasmania have a 'true' corruption commission?, ABC News, Mar 2019.
19Chapter 5.4: House of Assembly
Background
In 1998, the Parliamentary Reform Bill 1998 was passed. This reduced the number of seats in
the House and Assembly from 35 to 25, and in the Legislative Council from 19 to 15. The Bill
also reduced the number of ministerial positions from 10 to 8, although this number was
increased to 9 in 2002.126
In the lead up to the1998 decision there were four failed attempts to reduce the number of
seats in Parliament, and two reports into the matter. Both reports – the Ogilvie Report and the
Morling Report – strongly recommended against reducing the number of seats.127
In February 2020, members of the Select Committee on the House of Assembly Restoration
Bill unanimously recommended the Greens’ House of Assembly Restoration Bill 2018 be
passed by the Parliament of Tasmania.128 The committee had members from the Liberal,
Labor and the Greens.
Rationale for Reducing Seats in Parliament
Despite attempts to present the reduction of seats in Parliament as a budgetary savings
measure. However, it is commonly accepted that the impetus for the Parliamentary Reform Bill
1998 was to raise the electoral threshold to a level where the Greens would struggle to secure
seats, and to therefore reduce the likelihood of a third party forming a balance of power or
minority government.129,130
Despite an initial decline in Greens members from four down to one, this attempt has largely
failed. Prior to 1998, the Greens held an average of 11.4% of the seats in the House of
Assembly over four terms, the average after the 1998 changes is 12.6% over six terms, and
has included a minority government. 131 Ultimately, the 1998 reforms failed in their intent to
sideline the Greens. However, there have been other serious democratic consequences.
Implications of Reduced Seats in the House of Assembly
The final report of the Select Committee on the House of Assembly Restoration Bill found the
reduction of seats in the House of Assembly has resulted in inadequate representation of
126
Tasmanian Parliamentary Library, Parliamentary Reform – Downsizing Parliament, 2005, Parliament of Tasmania.
127 Ibid.
128 House of Assembly Select Committee on House of Assembly Restoration Bill, Final Report, Parliament of Tasmania. 2020.
129 Dr R A Herr, Reducing Parliament and Minority Government in Tasmania: Strange Bedfellows Make Politics — Badly,
Australasian Parliamentary Review, 2005, Vol. 20(2), pp. 142-143.
130 K Crowley, A failed greening? The electoral routing of the Tasmanian Greens, Environmental Politics, Vol.8(4), 1999.
131 Data Source: Tasmanian Electoral Commission, Parliamentary Elections Reports, 2021.
20constituencies, a hindered capacity to debate legislation, undertake inquiries, develop policy,
and conduct scrutiny of government, and a reduced pool of ministerial talent.132
On the matter of cost to the budget, the Committee found that a restoration of seats back to
pre-1998 levels would lead to an improvement in governance – and as a result, better public
services that would significantly outweigh the monetary costs.133
The Committee had representatives from all three political parties, and no member dissented
from the findings of the final report.
Comparisons with other jurisdictions
Comparisons are often made between Tasmania and the Australian Capital Territory (ACT),
which has a similar population and the same size lower house. However, this is a poor
comparison for a number of reasons.
The ACT has a geographic area that is just 3.5% the size of Tasmania (2,358 km2 compared to
68,401 km2).134 The ACT is far less spatially and socially disparate than Tasmania, which is a
reasonable argument for needing less broad representation.
The ACT is also the seat of the Australian Government, containing 37.5% of the federal public
service workers.135 Access to federal politicians, public servants, and public services is far
easier in the nation’s capital than in other jurisdictions such as Tasmania.
The ACT is a territory with historic structural differences to Tasmania. The ACT was not self-
governing until 1988 when the Australian Parliament passed the Australian Capital Territory
(Self-Government) Act 1988.136
The ACT has no constitutional protections or rights. It only has legislative power granted by
the 1988 Act –legislative power that can therefore be overridden by the Australian
Government. As a result of the ACT Legislative Assembly’s constituting document being
Commonwealth regulations, the ACT was not able to alter its own composition until
amendments were passed in 2013.137 Subsequently, in 2014, the number of seats increased
to 25.138
The choice of 25 seats was made as a result of the analysis of an expert committee. 139
Interestingly, the committee’s preference was to increase the number of seats to 35 –
however they were concerned that more than doubling the number immediately would not be
appropriate.140 The expert committee recommended the ACT increase seats to 25 in 2016,
132 House of Assembly Select Committee on House of Assembly Restoration Bill, Final Report, 2020, Parliament of Tasmania, pp.
8-10
133 Ibid.
134
Geoscience Australia, Area of Australia - States and Territories, 2001.
135 The Canberra Times, Canberra public service claim mostly true, June 2019.
136 Federal Register of Legislation, Australian Capital Territory (Self‑Government) Act 1988, Australian Government.
137 ACT Parliamentary Counsel, Australian Capital Territory (Legislative Assembly) Bill 2014 - Explanatory Statement, 2014, p. 1.
138 Ibid.
139 Ibid.
140 ACT Government, Review Into The Size of the Act Legislative Assembly: Report by the Expert Reference Group, 2013, p. 30.
21and the Act include provisions to increase the number again to 35 in 2020 (or failing that,
2024).141 The Act did not include these provisions.142
It is also worth noting section 8(3) of the Australian Capital Territory (Self-Government) Act
1988 requires a two-thirds majority to increase the number of seats143, whereas Tasmania’s
Constitution Act 1934 only requires a simple majority.144 This means that achieving a change
in the number of seats in the ACT would be very unlikely without support from the Opposition.
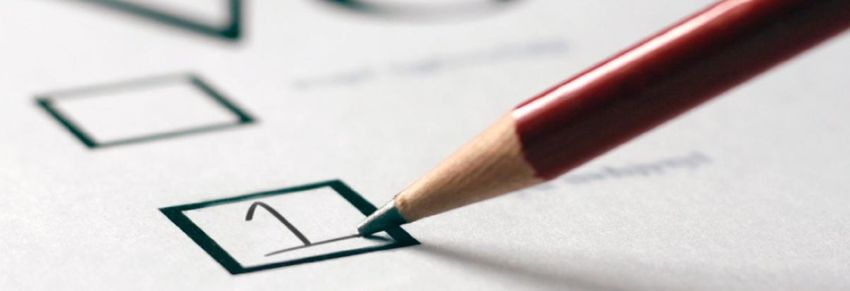
There are 30 countries in the world structured as federations like Australia.145 Within these,
there are 574 sub-national jurisdictions, 496 of which have legislature data available (see
graph 5.4.1). Those not included are the United Arab Emirates and Papua New Guinea, which
have no sub-national legislatures, and Sudan and South Sudan, which do not have data
available for their jurisdictions.146
Figure 5.4.1: Sub-National Legislatures (Populations 420,000 – 620,000)147
160
140
120
100
80
60
40
20
0
Figure 5.4.2 illustrates Tasmania’s Lower House size compared to lower houses from other
jurisdictions with similar populations. The dark dotted line represents the average Lower
House size among all 24 jurisdictions (43.5), and the paler dotted line is the average excluding
the three largest houses (36.3).
Of the 24 jurisdictions that have similar populations sizes to Tasmania (plus or minus
100,000) Tasmania has the sixth lowest number of seats in our lower house.148
Regarding the jurisdictions that have fewer seats in their lower house than Tasmania, three of
these are in Venezuela and two are in Russia. Both of these countries are classified as
141 Ibid.
142
ACT Parliamentary Counsel, Australian Capital Territory (Legislative Assembly) Bill 2014 - Explanatory Statement, 2014, p. 3.
143 Federal Register of Legislation, Australian Capital Territory (Self‑Government) Act 1988, Australian Government.
144 Tasmanian Legislation, Constitution Act 1934, Tasmanian Government.
145 Institute for Demcoracy and Electoral Assistance, What is Federalism?, 2020.
146 Tasmanian Greens MPs, Seats in sub-national legislatures, 2020.
147 Data Source: Tasmanian Greens MPs, Seats in sub-national legislatures, 2020.
148 Data Source: Tasmanian Greens MPs, Seats in sub-national legislatures, 2020.
22You can also read