SOUTHERN DAIRY HUB February 2019 FIELD DAY - 20th February 2019 - Southern ...
←
→
Page content transcription
If your browser does not render page correctly, please read the page content below
SOUTHERN DAIRY HUB
February 2019 FIELD DAY

     20th February 2019

         Lunch kindly supplied by

          Proudly supported by: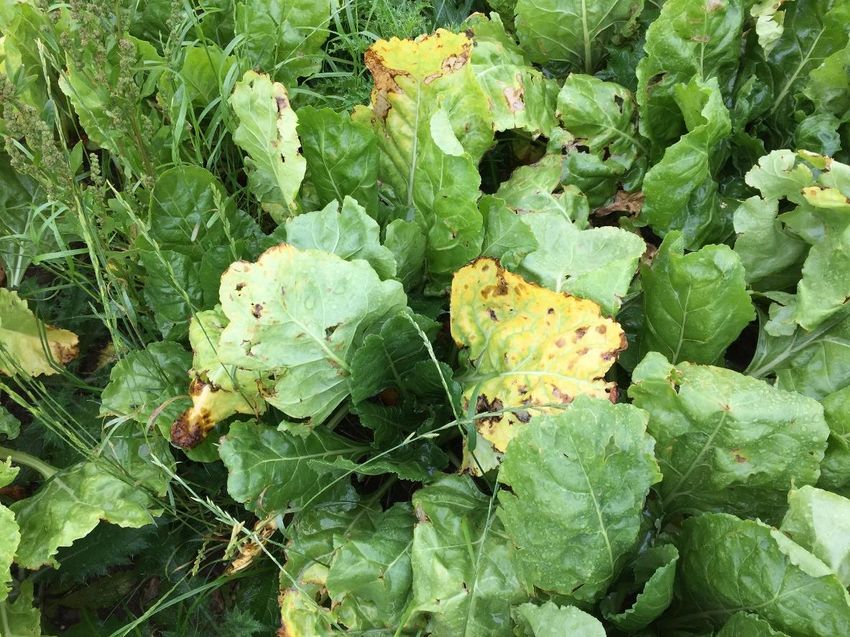
Proudly supported by:

                        1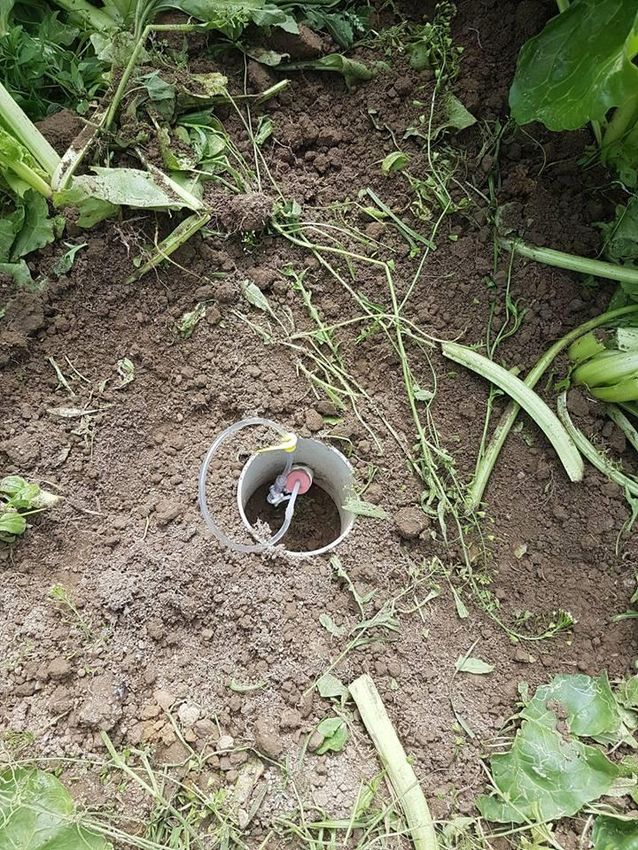
Contents

Visitor Health and Safety Requirements .............................................................................................................................. 3
Biosecurity Requirements for Southern Dairy Hub (SDH) Farm Visits ................................................................................. 4
Mission and Strategic Direction of the Southern Dairy Hub ................................................................................................ 5
Southern Dairy Hub Farm Systems Proposal 2018-2021 ..................................................................................................... 7
Farm Systems Map ............................................................................................................................................................. 10
Environmental Update ....................................................................................................................................................... 11
Dietary N intake and effect on blood, urine, faecal and milk nitrogen ............................................................................. 14
Winter 2018 effect of crop type on N indicators in mixed aged cows and rising 1-year old replacements...................... 17
Soil Mineral N as in indicator of fertiliser N requirements for crops ................................................................................. 20
Farm Systems Summary Season to date ............................................................................................................................ 22
Winter crop feeding plan ................................................................................................................................................... 23
Good practice crop feeding and management for improved environmental and animal care outcomes ........................ 25
Southern Demonstration and Research Farm Ltd - Financials - First Quarter ending 31st August, 2018 ......................... 27
Hub Weekly Farm Update: 14/2/2019 ............................................................................................................................... 31

                                                                             Proudly supported by:

                                                                                                                                                                            2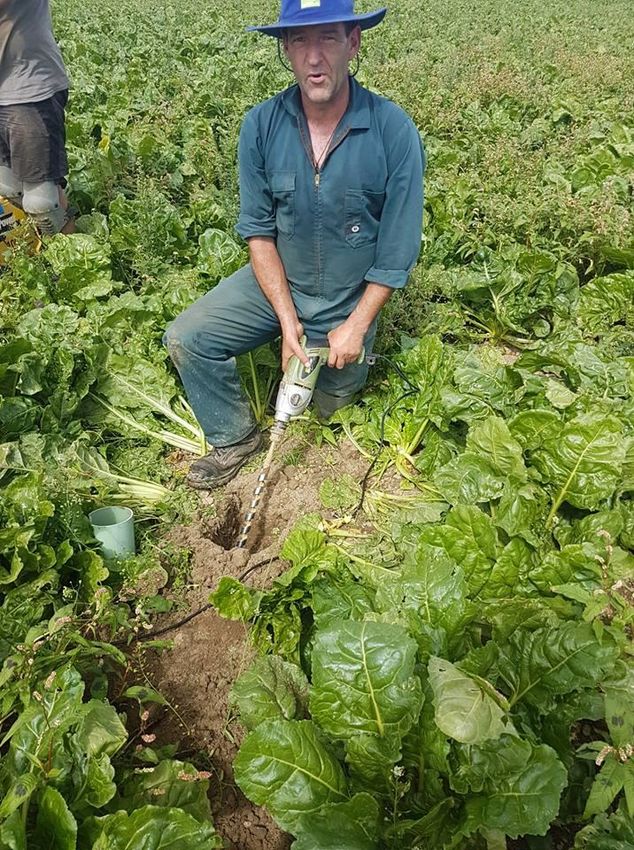
Visitor Health and Safety Requirements

                      Entry onto property by permission and
                                appointment only.
         Contact either:
         Business Manager Guy Michaels 027 564 5595 or
         Farm Manager Charlie McGregor 027 207 6012
         All visitors required to sign in and out accepting farm rules
         A farm map will be provided showing any general hazards on the
         farm; the manager will instruct you of any new hazards

General Rules
  • Communication – sign in and out

   •   Children on farm – must be under constant adult supervision and only with express
       permission of manager

   •   Reporting – Please notify manager immediately any accidents or near miss
       events/hazards

   •   Drive to the conditions – Max speed of 30km/hr

   •   Farm bikes – trained operators only, helmet with strap done up at all times, never operate
       if under 16 years’ old

   •   Vehicles – no one to operate farm vehicles without manager’s permission

   •   Water ponds/troughs – Keep a close eye on children around water sources – do not drink
       from farm taps, troughs, water ways

   •   In emergency – Please report back to farm manager at Assembly point in front of cowshed

   •   Fire extinguishers – found in farm houses, dairy shed, vehicles, and woolshed

   •   No smoking in cowshed, buildings, or vehicles

   •   Firearms – only with approval of farm manager, must hold current licence

                                     Proudly supported by:

                                                                                               3
Biosecurity Requirements for Southern Dairy Hub (SDH) Farm
Visits

All visitors must comply with the Biosecurity Requirements when visiting the SDH
    • All footwear must be disinfected with materials supplied, upon arrival at and departure
         from the SDH farm site. Protective footwear may be borrowed from the SDH upon
         request, and must be cleaned thoroughly before its return. People wearing inappropriate
         (or no) footwear will not be allowed onto the SDH premises.

   •   All visitors are expected to wear clean protective clothing, including wet weather gear if
       necessary when on the farm(s).

   •   No farm visits will be allowed, under any circumstances, from anyone within five days of
       their arrival in New Zealand from Central or South America, any part of Asia or any part of
       Africa. Further restrictions may be applied at any time, dependent upon international
       disease status.

   •   On farm, visiting vehicles must be parked in designated visitor parking areas. Approved
       vehicles may only access the farm after washing the undercarriage. This may be repeated
       prior to departure but this is up to the operator concerned.

   •   SDH retains the right at any time to refuse access to any person or persons deemed not
       to be complying with these requirements.

                                      Proudly supported by:

                                                                                                    4
Mission and Strategic Direction of the Southern Dairy Hub
Farmers in the Southland region took the initiative to establish the Southern Dairy Development
Trust (SDDT) and its fully owned registered trading company, the Southland Demonstration
Farm (SDF) in 2007.

The Charitable Trust Deed outlines that the purpose of the trust is for “the promotion of dairy
farming in Southland and West Otago, and to assist, support and encourage existing dairy
farmers and those interested in joining the dairy industry for general educational purposes”.

Following the expiry of the lease on the Southland Demonstration Farm at Wallacetown in 2016
SDDT and SDF approached DairyNZ and AgResearch seeking agreement to establish a
dedicated Southern Dairy Hub (SDH) to facilitate dairying research and extension in the region.
The anticipated benefits are predominantly associated with the ability for farmers, researchers
and the industry body DairyNZ to work together to create new solutions for the Southland/Otago
and New Zealand Dairy industries.

AgResearch, DairyNZ and SDDT have recognised the current scale and growth potential for
dairying in Southland. However, there are significant local issues faced by farmers dealing with
wet soils, cold winters, and unique environmental issues. The region will require new levels of
research and development activity and resourcing to provide solutions that reflect the area’s
unique climate and soil conditions. Failing to find solutions to address environmental concerns
within the context of long-term sustainable farm systems will impact on the ability of the dairy
industry to grow in the region.

SDH Vision:
   •   To be an internationally recognised, innovative and leading centre of excellence for
       dairy farming, comparative research, and extension

SDH Mission:
   •   Providing economic, social, and environmentally sustainable solutions for the southern
       South Island dairy farmers and community

SDH Fundamental aims:
   •   To improve the performance and protect the viability of existing dairy farms in the
       southern South Island.
   •   To help develop and test new options for dairying in the southern South Island. To
       support the responsible and sustainable growth of dairying in the southern South Island.
   •   To promote the Dairy Industry Strategy.

SDH has leased the farm to the Operating Company (SDRF) for dairy farming and the conduct
of research related to dairy farming.
The Research Advisory Committee and SDH, together with representatives from the Southern
dairy community are currently collating the issues facing farmers in the region, prioritising these
                                       Proudly supported by:

                                                                                                      5
and finalising the research questions that will be addressed with the farm systems comparisons
commencing June 2018. Once established these systems will run for a minimum of 3 years.

Southern Dairy Hub Research Advisory Committee (RAC)
Who is the research advisory committee?
   ➢ Dean Alexander – Dairy Farmer (Central Southland) – SDDT/dairy industry
   ➢ Adam McCall – Dairy Farmer (West Otago) – SDDT/dairy industry
   ➢ Bruce Thorrold (Chair) – Strategy and Investment Leader DairyNZ
   ➢ Dawn Dalley – Senior Scientist Feed & Farm Systems DairyNZ
   ➢ Robyn Dynes – Science Impact Leader Farm Systems & Environment AgResearch
   ➢ Ross Monaghan – Senior Scientist AgResearch
   ➢ Mark Robinson – Head of Fonterra Farmsource – Southland & Otago

Research undertaken on the farm will focus on systems based comparative research and trials that
align with the dairy industry strategy as promulgated by DairyNZ (this will set the priority for
research on farm but research outside of this may also be conducted). All parties have the
common goal of ensuring that research is conducted on the farm to support the growth and
development of the Southern dairy industry.

The role of the RAC is to:

   a) Review all proposed research to be conducted on the farm, and provide recommendations
      to the SDRF board on research trials and activities that can be undertaken on the farm.

   b) Actively plan research for the farm, working with SDH to construct a research programme
      which meets an appropriate standard of science quality, is achievable within the available
      resources and delivers to the goals of the SDH;

   c) Take an active role in linking research opportunities for the farm;

   d) Consider the needs of the southern South Island dairy industry;

   e) Understand and recognise the relationship between providers and the funders of research
      and development;

   f)   Inform the SDRF Board of the risks to the farm, SDRF and SDH arising from actual or
        proposed research including reputational risks; and risks associated with third parties
        seeking to have the Company or SDH endorse or support their use of the results or
        outcomes of scientific research conducted on the farm;

   g) Consider commercial imperatives as part of its decision-making;

Submissions for research ideas and priority issues can be sent to the SDH business manager Guy
Michaels - guy.michaels@southerndairyhub.co.nz

                                      Proudly supported by:

                                                                                                  6
Southern Dairy Hub Farm Systems Proposal 2018-2021
 Background
 The Research Advisory Committee (RAC) has held a series of meetings and workshops to discuss
 farm systems options for implementation from 1 June 2018 for the next 3 lactation seasons. A
 brainstorming session was used to identify issues facing dairy farmers in Southland and Otago.
 These issues were collated into 13 themes from which the top 3 were identified.
 The top 4 issues were:

        1. Fodder beet
        2. Nutrient loss reduction
        3. Wintering

 There is a desire to understand crop vs off-paddock wintering and the impact of infrastructure
 on whole system performance, profitability and achieving environmental regulation. Realistically,
 however, it will be a 2-3 year timeline before this could be considered on the SDH farm due to the
 current lack of infrastructure and the tight budget situation.

 The proposed systems have been designed to better understand crop-based wintering in relation
 to consequences for environmental impact and profit with the view that the best crop system would
 be used as the base farm in the next phase of farm systems comparisons (2021 onwards), that
 might include off paddock infrastructure.

 Several mitigations to reduce the environmental impact were considered in the pre- experimental
 modelling and farmlet design that is described below.

 The RAC opted to only consider system changes where there is high confidence in reducing the
 environmental impact. There were two emerging mitigations – namely plantain and catch crops -
 that have not been considered in the farm systems designs. An additional option within the fodder
 beet systems to reduce the environmental impact is lifting the fodder beet in autumn.

 In developing the systems, consideration was given to the following factors:
    1. Currently SDH is a first year conversion with 80% new pastures and some areas that need
       drainage, ripping etc to improve performance i.e. pastures are still developing
    2. Some leniency in N fertiliser in Year 1 (within defined boundaries) for all systems
    3. The staph aureus infection in the herd may require more aggressive culling in the next
       couple of years to avoid ongoing issues
    4. Young herd with potential for increasing milk production
    5. Production must be sufficient for the farm to have credibility with southern farmers
    6. Assumed good management practice implementation on all farmlets with respect to grazing
       management, reproductive management, calf rearing, fertiliser use etc.
    7. Feed to be purchased for mature cattle rather than stock sent out to grazing and
       concentrate preferred to silage because of quality and consistency of the product

                                      Proudly supported by:

                                                                                                 7
As the farm develops the expectation is that performance will improve in all systems – Targets
below:

Table 1: Targets set year by year
                                2018-19                2019-20               2020-21
MS/cow                            450                  465                   480
MS/ha                             1350                 1395                  1440
N fertiliser on base              Up to 250            200                   180
farm (kg N/ha)
Total supplement to               7-800                7-800                 7-800
milkers (kg/cow)

The Process
The Standard kale system was set up as the base model in Farmax Dairy. The results of this were
used to generate the key input parameters for the Standard fodder beet system.
Further management changes were considered (reduced N fertiliser, less supplementary feed,
reduced stocking rate, dry off date) for each to generate the parameters of the two reduced impact
systems.

During the modelling process we identified several physical aspects of the farm and a constraint of
OVERSEER that could impede model results being achieved. These are:
   1. The pasture growth of the farm (we may have been optimistic on the time to reach potential
      yield given the early stage of farm conversion).
   2. Choice of in-shed supplement and amount that can be consumed during milking
   3. The uncertainties associated with N leaching estimates for autumn-grazed fodder beet
      crops.

                                     Proudly supported by:

                                                                                                 8
System Performance and Input Parameters

Table 2: System performance and input parameters
                                                                   Crop Type
                           Kale (wintering) + grain as lactation       Fodder beet (wintering) + fodder
                                        supplement                      beet as lactation supplement
           Standard         ≥1300 kg MS/ha (milking platform)        ≥1300 kg MS/ha (milking platform)
           Environmental    ≥ 250 days in milk                       ≥ 250 days in milk
           Impact System    Up to 250 kg N/ha for 2018-19            Up to 250 kg N/ha for 2018-19
                            Up to 700 kg/cow lactation               Up to 700 kg/cow lactation
                            supplement (home grown first, use         supplement (home grown first, use
                            driven off pasture deficit)               driven off pasture deficit)
                            23% replacement rate                       23 % replacement rate
 N Input

                                                  th
                            No N applied after 10 April or if soil     No N applied after 10th April or if
                            temperature
Farm Systems Map
Proudly supported by:
10Environmental Update
1. Measurement of N leaching losses from autumn- and winter-grazed crops
Autumn- and winter-grazed fodder beet (FB) crops are key to the FB farmlets at the Southern Dairy
Hub. Kale is included in the 2 remaining farmlets, although only as a winter feed supply. To increase
knowledge of the actual environmental impacts of these grazed forage crops, N leaching losses were
being measured in selected treatments during 2018 to provide:
• Quantitative N leaching data for the crops, soils and climate of SDH.
• N leaching comparisons between:
o autumn-grazed v lifted FB
o winter-grazed v lifted FB
o winter-grazed kale
o selected pastures on the milking platform.
Preliminary results to date summarising yields and imposed grazing pressures are shown in Table
3.
Soil mineral N levels and amounts of N leached to date are shown in Figure 1. Due to a relatively
dry winter, drainage totals were initially less than normal; however, a wet November increased
drainage to near typical (May-Dec = 407 mm; July-Sept = 380 mm). Concentrations of N in Leachate
for the autumn grazed fodder beet have peaked and are now declining while those for the winter
grazed fodder beet and kale are yet to peak (as at January 31st). This indicates that there is still
winter deposited urine in the soil profile available to be leached.
Table 3: Crop yields, N contents and stock grazing pressures for the autumn- and winter-
grazed fodder beet and winter-grazed kale crop treatments.
May July July grazed
grazed grazed Kale
FB FB
Crop yield (t/ha) 24.4 20.4 15.7
Crop N (kg/ha) 288 199 286
N lost per cow wintered (kg 2.1 2.4
N/cow)
Proudly supported by:
11120 100
100
80
Soil Min N (kg/ha)
N leached (kg/ha)
80
60
60
40
40
20
20
0 0
Grazed Lifted Grazed Lifted Kale Pasture
May harvested July harvested
fodder beet fodder beet
Figure 1. N leaching (bars) and soil mineral N contents () in crop and pasture treatments.
Leaching results to date; bar depicts the LSD value comparing the amount of N leached from
the grazed fodder beet treatments only.
Summary
• There was little difference in N leaching between lifted and grazed fodder beet treatments.
• N losses from autumn-harvested fodder beet treatments were relatively large, and higher than
the winter-harvested fodder beet.
• Urine N deposited on winter-grazed fodder crops can take until the following winter to fully
leach down the profile – measurements to therefore continue during 2019.
• The dry summer of 2017/2018 may have increased N mineralisation over the late summer-
autumn period and potentially N leaching losses across all treatments.
• There was a slight reduction in N leached with winter-grazed fodder beet over winter grazed
Kale.
• Measured N losses from the pasture sites are similar to modelled.
Future plans
The trial will be repeated in 2019 with 4 treatments: May-grazed fodder beet; May-lifted fodder beet;
July-grazed fodder beet; July-grazed kale.
Proudly supported by:
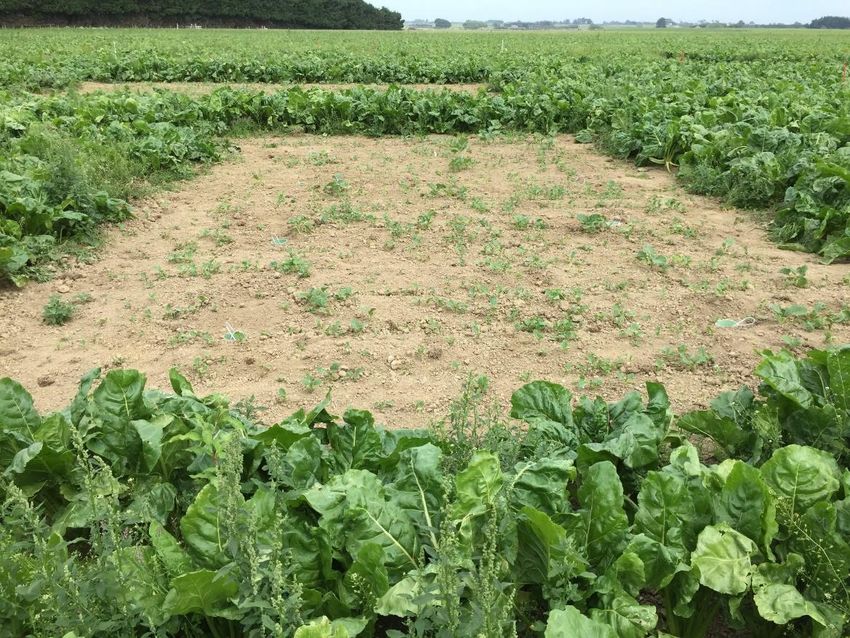
12Figures below show AgResearch installing 348 ceramic cups in their measurement plots for winter
2019. LIFB Paddock 52 has 48 plots of winter crop planted within the trial area to allow
measurements of N leaching to be determined from fodder beet and kale treatments on the same
soil type:
Proudly supported by:
13Dietary N intake and effect on blood, urine, faecal and milk nitrogen
Purpose
To estimate farm system differences in N intake and partitioning throughout the year
Approach
One week per month all paddocks grazed by each herd are plated pre- and post-grazing to
estimate per cow pasture intake. At the same time a pre-graze pasture sample is collected from
each paddock for quality analysis and any supplements being fed at the time are also analysed.
Coinciding with this monitoring activity, four times per year samples of blood, urine, faeces and
milk are collected from 20 monitor cows in each herd during or immediately after each milking on
one day. The first of these samplings occurred mid-January and the next is scheduled for March.
A similar monitoring process is adopted during winter when the cows are grazing winter crops.
Results
We are still waiting on the results of the blood, urine, milk and faeces for the January samples so at
this stage can only report on the pasture quality results since August 2018.
Proudly supported by:
1426
24
22
20
DM%
18
16
14
12
10
Aug 18 Sep 18 Oct 18 Nov 18 Dec 18 Jan 19
LI FB LI Kale Std FB Std Kale
Figure 2: Monthly pasture dry matter % for the 4 farm systems
24
22
20
Crude protein %
18
16
14
12
10
Aug 18 Sep 18 Oct 18 Nov 18 Dec 18 Jan 19
LI FB LI Kale Std FB Std Kale
Figure 3: Monthly pasture crude protein % for the 4 farm systems
Proudly supported by:
1513.0
12.5
12.0
ME MJ/kg DM
11.5
11.0
10.5
10.0
Aug 18 Sep 18 Oct 18 Nov 18 Dec 18 Jan 19
LI FB LI Kale Std FB Std Kale
Figure 4: Monthly pasture metabolizable energy (ME) for the 4 farm systems
Preliminary findings
• No consistent differences or trends measure in pasture quality between the farm systems
• In general average crude protein levels are low, despite high clover content in many pastures
• High quality pasture was on offer through spring but since November there has been a wide
range in the results between paddocks
• High variability in pasture nutritive value within and between months is most likely driven by:
o Cultivar effects
o New grass vs old pasture
o Previous grazing management
o Soil type and landscape features
o Effluent vs non effluent areas
• Spring 2018 sown pastures are currently higher in crude protein and ME and lower in dry
matter than older pastures
• A larger dataset is required to investigate the impact of farm system management, cultivar and
other factors on pasture quality.
Proudly supported by:
16Winter 2018 effect of crop type on N indicators in mixed aged cows
and rising 1-year old replacements
Purpose
To investigate the effect of crop type on nitrogen intake and blood nitrogen parameters
Approach
Monthly during the winter the dry matter yield of each crop paddock was determined and samples
of crop and supplement were collected for quality analysis. Cows were transitioned onto their diets
according to recommended industry good management practice.
Cows were offered the following amounts of crop and supplement (kg DM/cow/day)
Table 4: Winter feed allocation, estimated crop utilisation and DMI for each treatment
Kale Fodder beet Baleage PKE Estimated Estimated DMI
crop kg/day
utilisation
Kale cows 8.5 3.0 2.7 82% 12.7
Fodder 10.9 3.0 - 91% 12.9
beet cows
Kale R1’s 4.8 3.3 - 77% 7.0
Fodder 5.0 3.3 - 70% 6.8
beet R1’s
In mid-July blood samples were collected from 20 monitor cows in each farmlet for mineral, urea
and glucose determination. Blood samples were collected from a subset of R1’s for the same
analysis.
Results
Table 5: Average crop and supplement quality parameters
DM% Crude Protein ME P Ca Mg
Baleage 35.2 14.7 9.9 0.34 0.61 0.20
Kale 12.7 16.7 12.2 0.28 1.18 0.16
Fodder beet leaf 11.3 24.5 11.2 0.33 0.72 0.48
Fodder beet root 15.1 11.4 14.4 0.13 0.15 0.15
PKE 89.7 16.5 11.3 0.58 0.38 0.27
• The kale crops averaged 12.3 T DM/ha with a range of 10.5 to 13.4 T DM/ha
• The fodder beet crops averaged 20.7 T DM/ha with a range of 17.8 to 24.6 T DM/ha
• Fodder beet crops averaged 79% root and 21% leaf from June to August.
Proudly supported by:
17Table 6: Estimated crude protein, phosphorus (P), calcium (Ca) and magnesium (Mg) intake
of the mixed age cows and rising 1yr-old heifers during winter 2018
Estimated Estimated MEI Estimated Diet Estimated Estimated
crude (diet ME P% diet Ca% diet Mg%
protein MJ/kg DM) (requirement (requirement (requirement
intake 0.3-0.35%) 0.6-0.8%) 0.22-0.28%)
kg/cow
(diet CP%)
Kale cows 2.05 145 0.36 0.88 0.19
(16.2) (11.4)
Fodder beet 1.85 165 0.21 0.35 0.21
cows (14.3) (12.8)
Kale R1’s 1.10 74 0.31 0.91 0.18
(15.7) (10.2)
Fodder beet 0.79 73 0.25 0.43 0.20
R1’s (11.6) (10.7)
• The FB diet for the R1’s was deficient in crude protein for good growth and we observed a
lower growth rate in this group of animals over the winter period (Figure 1)
• The kale diet for the cows had more surplus crude protein than the fodder beet diet
• Fodder beet diets were deficient in P and Ca for both classes of livestock
• All diets were below the recommended dietary range for Mg content.
Figure 1: Growth rate of R1’s wintered on fodder beet or kale during winter 2018
Proudly supported by:
18Figure 2: Blood metabolites pre and mid-winter for R1’s wintered on fodder beet or kale
Figure 3: Blood metabolites pre and mid-winter for cows wintered on fodder beet or kale
Trends in blood minerals were similar for mixed age cows and R1’s
• Blood phosphorus and urea decreased on both kale and fodder beet diets but the decline
was greater for cows wintered on fodder beet and for P the decline was larger in the R1’s
on fodder beet. The cows received P supplementation on the baleage but none was
provided to the R1’s
• There were small differences in blood Ca and Mg which reflected differences in mineral
intake
• Blood glucose concentration was significantly higher in animals fed fodder beet
• AST levels were lower mid-winter than prior to crop feeding
Proudly supported by:
19Soil Mineral N as in indicator of fertiliser N requirements for crops
Purpose
To investigate the range in soil mineral N content in winter crop paddocks at SDH and utilise this
information to inform fertiliser N requirements.
Background
Soil mineral N content provides an indication of the mineralised N pool in the soil that is available
for plant growth. Ryegrass/white clover pastures accumulate a large amount of N in the soil
through biological N fixation by clover and through the return of dung and urine N during the
grazing process. This N becomes available for plant growth during the cultivation phase of crop
establishment and therefore should be taken into consideration when determining the fertiliser N
requirements of the crop, especially for kale.
The appropriate fertiliser N rate will depend on soil N supply and potential crop yield, and will differ
from site to site. However, under excess N supply, kale may accumulate large amounts of N
beyond those required to reach maximum yield. This may have negative impacts on animal
production, and can increase N losses when kale crops are grazed.
Recent research conducted by Plant and Food research has demonstrated no yield benefits from
applying more than 100 kg N/ha to fodder beet crops and there was no relationship with soil
mineral N concentration. Higher rates of N fertiliser did increase the N content of the bulb but did
not increase yield.
Approach
Wintering cropping at SDH occurs within the milking platform areas of each farm system. To
minimise the proportion of the farm out for crop in spring each year we have adopted a 2-year crop
rotation so that each year half there is an even split of first and second year crop paddocks.
Soil samples for mineral N analysis were collected from all the 2019 crop paddocks in October and
this information was used to determine the fertiliser N requirements for each crop paddock.
Results
• Up to a 4-fold range in soil mineral N content was observed between paddocks (Table 7)
• 1st year kale paddocks, with the exception of 103, received a single side dressing of 50 kg
N/ha in early February
• 2nd year kale paddocks will receive 2 side dressings of 69 kg N/ha – one in early February
and the other mid-March
• All fodder beet paddocks received a single side dressing of 55 kg N/ha in early February.
• Mineral N content lower in lifted FB paddocks compared with those that were grazed
Proudly supported by:
20Table 7. 2019 Crop paddock soil mineral N values and planned side dressings of N fertiliser
kg N/ha kg N/ha
1st side 2nd side
2019 2018 Pdk Mineral dressing dressing
crop Pdk history crop Comments No N (Jan) (March)
Fodder
ex pasture 52 159 55
beet
Fodder
ex pasture 48 124 55
beet
Fodder
ex pasture 50 157 55
beet
Fodder fodder grazed by
ex crop 6 80 55
beet beet R1's
Fodder fodder grazed by
ex crop 22 90 55
beet beet cows
Fodder
ex crop kale 3rd year crop 98 49 55
beet
Fodder fodder most of crop
ex crop 35 45 55
beet beet lifted
Kale ex pasture 47 156 50
Kale ex pasture 57 149 50
Kale ex pasture 65 180 50
Kale ex pasture 103 97 69 69
fodder most of crop
Kale ex crop 9 37 69 69
beet lifted
fodder most of crop
Kale ex crop 8 36 69 69
beet lifted
fodder grazed by
Kale ex crop 7 79 69 69
beet cows
fodder grazed by
Kale ex crop 5 84 69 69
beet cows
Proudly supported by:
21Farm Systems Summary Season to date
Mating programme
• Synchrony programme with R2’s from the 1st November – 3 days AI followed by bulls until
20th December
o 8% not in calf
• Planned start of mating 8th November for mixed age cows
• 6 weeks of AI until the 20 December
• Bulls run with all herds from 21st December till 10th January
• 1 week of AI with short gestation semen from 10th to 17th January
• First scan on the 25th January
Table 8. Season to date summary of key metrics for the farm systems
Std Kale LI Kale Std FB LI FB
Intended stocking rate (effective 3.1 2.6 3.1 2.6
area)
Actual stocking rate (effective area) 3.0 2.7 2.9 2.7
Actual stocking rate (total area) 2.6 2.3 2.5 2.2
Production
Milk solids (kg/cow; 5 Feb) 322 326 314 322
Milk solids (kg/ha; 5 Feb) 1007 889 898 851
Supplements
Supplements fed (kg/cow) 166 157 97 115
Supplements made (kg/cow; 5 Feb) 169 148 212 242
Nitrogen inputs
N fertiliser (kg/ha) 140 51 123 53
Reproduction
Cows in herd at PSM (8 Nov) 194 173 190 164
Cows scanned 189 170 188 158
3 week submission rate (%) 91 95 91 88
Confirmed in calf (number; 25th Jan) 144 136 150 114
6 week ICR (% of cows at scanning) 76 80 80 72
6 week ICR (% of cows at PSM) 74 79 79 70
Proudly supported by:
22Winter crop feeding plan
Timeline for the next 2 months
• Start yield assessments on all crop paddocks in mid-March
• Complete autumn and winter feed budgets including:
o Finalising order of crop paddock grazing to streamline establishment of new grass
and crops next spring
o Identifying any potential deficits in the budget due to poorer crop yields
o Identifying paddocks/areas within fodder beet paddocks for lifting for autumn and
spring feeding
o Identifying 1st year crop paddocks for 2020
▪ Soil test in the autumn
▪ Manage grazing to set them up as springer paddocks for spring 2019
• Finalise paddock feeding plan including bale placements
Proudly supported by:
23Proudly supported by:
24Good practice crop feeding and management for improved
environmental and animal care outcomes
1. Winter crop establishment – things you can still do
a. Paddock access
i. If a paddock is renowned for getting particularly muddy therefore difficult to walk
through, fence off an access strip along the length of the paddock to allow staff to
easily access gateways and break fences.
b. Selecting grazing direction
i. Aim to graze towards CSA’s or water bodies to protect them from overland flow. If this
is not possible leave a buffer strip to minimise any overland flow (see above for buffer
sizes).
ii. Graze from top of slope to bottom if possible to reduce overland flow by maintaining
soil structure and allowing water to soak into the soil
c. Set out baleage
i. Place bales away from waterways and critical source areas
ii. To reduce the need to drive heavy equipment on wet soils, place bales strategically
throughout the paddock prior to winter, and use ring feeders when feeding the baleage
2. Strategic grazing management of the crop
a. Transitioning
i. Ensure that cows are transitioned onto crop effectively. This requires that all cows
have access to the crop, that enough time is allowed so that the microbes in the rumen
can adapt to the new crop, and that enough supplement is offered during this transition
time to meet cow intake requirements.
b. Cow feeding
i. Ensure that stock has access to enough feed to maintain or if required increase body
condition score
c. Cow condition
i. Cows in good body condition are better able to withstand cold as the fat layer beneath
the skin acts as an insulating layer. Cow condition must be planned for prior to winter.
d. Cow lying time
i. Ensure cows get a minimum of eight hours lying time per day.
ii. Correct lying times reduce the risk of lameness and stress, which leads to better
animal welfare and body condition score.
iii. On a winter break fed paddock this means cows need access to enough dry area to lie
down and meet their lying time requirements.
e. Cold Stress
i. In cold and wet weather allow for decreased utilisation of crop and increased cow
demand for energy. A combination of strong wind, rain, and snow is the trigger to
provide shelter and/or increase feed allowance.
f. Utilisation and back fencing
Proudly supported by:
25i. Reduce trampling wastage by moving the fence once or twice a day rather than
offering a few days feed at a time
ii. Offer long feeding faces rather than blocks. All cows should be able to access fresh feed
at the same time
iii. Back fence to reduce excessive movement of animals and damage to soils
g. Managing CSA’s
i. Fence off CSAs and leave ungrazed or graze quickly in dry conditions and the end of
the paddock grazing.
h. Water access and movable troughs
i. Ensure animals always have access to water troughs
ii. Place portable water troughs at the front of the feeding face
i. Catch crops
i. Where possible investigate options to use catch crops, such as oats, triticale and rye
corn to minimise soil/nutrient losses during fallow periods.
j. Calving cows on crop
i. Cows should not calve on the crop paddock. Ensure that cows are drafted off the crop
paddock at least two weeks prior to their expected calving date.
ii. Ensure that cows calve on a suitable surface and have enough area and that their pre-
calving mineral requirements are met.
Southern Wintering 2020 events coming your way in March/April
• Whether we like it or not, the spotlight is on farming and our fellow NZ’ers and global customers
are only a mouse click away.
• It is the responsibility of all of us to demonstrate to the world that we care for our animals and
the environment.
• Wintering is an important part of our industry and we all need to be aware of our obligations and
ensure we are adopting good management practices when wintering cows on crop or pasture.
Dates and venues for the events will be advertised soon so please encourage everyone
involved with wintering cows in the south to get along. Sessions will be split so there will
be something for everyone including: decision makers, graziers, farm staff, technical
advisors etc.
Proudly supported by:
26Southern Demonstration and Research Farm Ltd - Financials - Second Quarter ending 30th
November, 2018
2018/19 2018/19 Actual 2018/19 Budget Variance % Variance
Year ending May 31 Notes
Budget YTD YTD
(Act—budg)
Production has been reforecast from
310,000kgMS to 287,000kgMS to 31st
Milk production (kgMS) 310,000 114,440 130,200 -15,760
May, 2019. However Budget YTD is
-12% based on original 310,000kgMS
260ha 1192 /ha 440 /ha 501/ha -61 -12%
Peak Cow Nos and Prod. 740 716 740 -24 -3%
Staff 5 5 5 0 0%
In line with Fonterra's payout re-
forecast down to $6.15 per kgMS SDRF
has updated the original and YTD
Income Milksolid Payout $/kgMS $6.10 $6.06 $6.10 0
budget to reflect this, less the discount
for farms on a share up over time
0% contract ($6.15 - .5c =$6.10 kgMS)
Dividend /share $0.00/share $0.00/share $0.00/share 0
Actual YTD Milk Income is $6.06 per
kgMS (this reflects the accrued income
for 2017/18 being higher then actuals
from June - November 2018. Can also
be affected by fat and protein %
differences and timing of supply in
Milksolid Revenue $1,891,000 $693,759 $794,220 -100,461
capacity adjustment months
Budget YTD was 130,200 kgMS @
$6.10 YTD, Actual YTD was 114,440
kgMS which equates to $6.06 per
kgMS - This amount is full Accrued
-13% amount to date
Proudly supported by:Dividend/Rebates/Other $0 $17,753 $0 4394
Surplus dairy stock $107,014 $80,886 $59014 21,872 Timing of 17/18 stock sold due to
37% available culling space
DairyNZ Levy -$11,160 -$4,120 -$4,687 567 -12% Impact of actual lower production
Breeding bulls purchased after a
Stock Purchases 13,600 13,600 0 13,600
change in policy from original AB only
Gross Farm Revenue $2,000,454 $801,879 $848,547 -46,668
-5%
Expenses
Cow
Animal Health -1,344
Costs $74,352 $41,110 $39,776 -3%
Lower due to less AI / use of bulls at
Breeding Expenses 2,939
$61,752 $38,362 $41,301 7% end of mating
$7,000 Forecast Saving, rearing
Replacements -302
$13,330 $6,652 $6,350 -5% completed no further costs required
Cropping costs YTD and Baleage made
at run off more cultivation costs for
Winter grazing -3,196
2nd yr. crops / more baleage / baleage
$77,400 $62,996 $59,800 -5% earlier than budgeted
Baleage to be made at the Run Off and
Feed Feed/Concentrates Purchased 22,628
$169,000 $58,122 $80,750 28% moved to dairy platform
Urea use planned as per decision
Nitrogen 22,573 rules, last round of N delayed till end
$71,600 $22,727 $45,300 50% of ryegrass seeding period in January
Fertiliser, Lime & Spreading $73,500 $46,712 $33,700 -13,012 -39%
Pasture Renewal $20,600 $1,377 $20,600 19,223 93% Work completed, timing of invoices
Freight $4,992 $298 $2,496 2,198 88%
Rubbish bin hire and empty fees,
Farm Working -4,846 baleage wrap to recycling centre over
$17,395 $16,083 $11,237 -43% winter period, consumables tea,
Proudly supported by:coffee etc. Protective equipment and
health and Safety
High labour costs this season with
temporary staff to cover replacement
permanent positions as well as
support the intensive periods and staff
Staff Employment (net of housing) -55,327
living off farm, travel and
accommodation allowances. Forecast
for season end is going to be higher
$275,873 $205,610 $150,283 -37% than originally budgeted
Costs above budget due to higher
electricity than budgeted - Longer
Land Electricity Farm & Run Off -6,867
shed running hours due to new
$40,004 $17,135 $10,268 -67% farmlet systems
Administration $40,301 $25,282 $23,392 -1,890 -8%
Rates & Insurance $39,254 $5,537 $9,313 3,776 14%
Repairs to calf shed at start of the
Repairs & Maintenance -11,310 season, R&M Fencing and yards,
$49,856 $27,846 $16,536 -68% spreading effluent.
Timing of shed Chemical and teat
Shed Expenses -12,353
$25,658 $26,406 $14,053 -88% spray purchased
Higher fuel costs YTD both Diesel and
Vehicle Expenses -12,635 Petrol, and lease costs of Silage wagon
$50,956 $30,683 $18,048 -70% (not budgeted)
Weed & Pest $1,600 $343 $1,000 657 66%
Farm Working Expenses $1,107,423 $633,283 $584,203 -49,080 -8%
FWE/kgMS YTD $3.57 $5.53 $4.48 -1.05 -23%
Depreciation $30,000 $20,437 $15,000 -5,437 -36%
Higher FWE than budgeted, mainly in
Total Operating Expenses $1,137,423 $653,720 $599,203 -54,517 due to labour, this has been
-9% underestimated due to the set up and
Proudly supported by:operational management of the
farmlets, temporary staff has been
required to support the permanent
team with day to day running of the
farmlets.
Dairy Operating Profit $863,031 $148,159 $249,344 -101,185 -41%
DOP/ha $3,319 $569 $959 -389 -41%
We remove expenses related to
research and demonstration into non-
operational to reflect normal farm
Operating Surplus $893,031 $168,596 264,344 95,748 expenses only. For example, the costs
for extra herd testing required by
research. We show the cost of 4 herd
-36% tests only under farm.
Operating Surplus per ha $4,396 $648 $1,017 -368 -36%
Proudly supported by:Hub Weekly Farm Update: 14/2/2019
Proudly supported by:
31Table 1: Farmlet feed wedges and general information
*If you are struggling to few the tables and wedges please visit www.southerndairyhub.co.nz to download the pdf
Proudly supported by:
32General Farm Information
Table 2: Key Numbers 14th Feb 2018
Kale Fodder beet
Soil Temp (oC) 16
Rainfall (mm) 14.2
Milker Intake Target 16.5
(kg DM/cow)
Av. Kg MS/cow/day 1.45 1.48
Average milk fat (%) 4.96 5.05
Average milk prot (%) 4.07 4.12
Average SCC (cells/ml) 166 164
Animal Summary Std Kale LI Kale Std FB LI FB
Pink Blue Green Yellow
Milkers - TAD 179 160 166 147
Milkers - OAD 9 7 19 9
Other/Penos 1 4 3 2
Key Decisions: this week
• Feed wedges are in better alignment with the target line this week after taking out some
additional paddocks at the top of the wedge for conservation. Potentially 1x Std FB
paddock to be conserved this week.
• The x1 Std Kale farmlet paddock that was being prepared for resowing was drilled on
Tuesday evening. Sowing rates were 20 kg/ha Platform AR37, 3 kg/ha Legacy large white
clover and 2 kg/ha Quartz medium white clover. All seed was superstrike treated.
• We are seeking additional advice on the fodder beet crops after we noticed the
appearance of leaf yellowing and damage in several 1st year crop paddocks this week.
These crops were looking much better than the 2nd year crop paddocks until the last week.
Given the challenging start for some paddocks we are looking at options to maximise the
chances of good yields. We are discussing whether a fungicide application would be
beneficial for fodder beet paddocks that will be carried through for spring feeding.
• The next round of N fertiliser across the whole farm will commence the last week of March
to help extend the rotation length out to around 35 days.
Proudly supported by:
33Figure 1: Leaf damage emerging in a first-year fodder beet paddock
General Notes:
• The round length will continue to be held around 30 days for the next 2 weeks and
paddocks dropped for conservation as required if covers exceed the herd target pre-graze
mass.
• 25 kg N/ha will start being applied to all paddocks during the last week of February with
the plan to move the LI farmlets out to a 35-day rotation
• 24-hour grazing has continued, and cows are being put back into paddocks to clean up if
residuals are not achieved. We are in the process of developing pasture mass trigger
points for each farmlet for the farm team to use in decision making around whether there is
sufficient feed to return herds to paddocks (especially for night feeds where they can’t
easily be monitored) or whether they need to be moved on.
• Some post-graze topping has been implemented this week. In the last 2 weeks the amount
of mowing (topping or conservation) has varied across the farmlets as outlined in Table 3
below.
Proudly supported by:
34Table 4: Area mown in the last 2 weeks
Std Kale LI Kale Std FB LI FB
Area Conserved 8.7 14.5 14.5 11.6
Area Topped - 8.7 2.9 5.8
Total area mown 8.7 23.2 17.4 17.4
Total % farm mown 14 37 26 28
• With mown paddocks often being 2-3 days slower returning to pre-graze covers and the %
of the farm mown in the last 2 weeks, there will be no topping on the LI farmlets this week.
• Weed control continues to be a major focus for the farm team – just when we think we are
on top of one weed another one pops up suggesting we have a well-stocked weed
seedbed on the farm!!
• The farm are currently implementing Max-T to increase milking efficiency
https://www.dairynz.co.nz/milking/rotary/maxt-rotary/ and are working on protocols for
successful implementation. With lighter conditioned OAD cows in each herd it is important
that these are considered when the platform speed is being set.
Animal Health
• The x6 calves that were on the platform receiving preferential treatment have been
returned to the support block.
• One calf mob was weighed yesterday, and the rest are being done today so those results
will be reported next week. Calves in the action group in MINDA weights continue to
receive 2 kg calf meal/day.
• X2 mastitis cases were detected this week
• X1 animal has been dried off after damaging muscles when she slipped in the yard.
People Management and Visitors
• A Farmtune session with Lynsey Stratford is scheduled for next week
https://www.dairynz.co.nz/business/farmtune/ . This programme looks to identify
inefficiencies and waste in the systems and processes on the farm and develop practices
to address these.
• The farmer reference group met and discussed setting up for autumn and winter including
rotation lengths, body condition score targets and average pasture cover targets for dry off
and spring.
• Nicole and Caitlin hosted dairy farmers on a UDV tour of NZ
Proudly supported by:
35Figure 2: The dairy farmers from Victoria Australia discussing why the water in the trough was a
cloudy colour
• Guy hosted students from the USA as part of a group called 'Meeker Citizens of the World
Ambassadors 2019’.
Research on-farm
• All calves have been weighed this week as part of the cumulative effects project.
Proudly supported by:
36You can also read