Charter 2021 - ARISE to Reach Serve and Influence - Elim Christian College
←
→
Page content transcription
If your browser does not render page correctly, please read the page content below
ELIM CHRISTIAN COLLEGE

Charter
            2021

                CHARTER 2012
                                       1
  ARISE to Reach Serve and Influence
            School Number: 1190
Charter Checklist
Use this checklist to ensure your charter meets all of the requirements of section 61 of the Education Act 1989.
Please note, any requirement in regards to standards is relevant to schools with students in years 1 to 8 that use The New Zealand Curriculum or Te Marautanga o Aotearoa to set
their teaching and learning programmes.
                                                                                                                                                      Yes (ü)
 Charter contents
 1.   The aim of developing, for the school, policies and practices that reflect New Zealand's cultural diversity and the unique position of the      Yes
      Māori culture.
 2.    The aim of ensuring that all reasonable steps are taken to provide instruction in tikanga Māori (Māori culture) and te reo Māori (Māori        Yes
       language) for full-time students whose parents ask for it.
 3.    A long-term strategic planning section that establishes your board's aims and purposes.                                                        Yes
 4.    A long-term strategic planning section that establishes for the next 3 to 5 years your board's aims, objectives, directions and priorities     Yes
       for intended student outcomes, your school's performance and use of resources.
 5.    A long-term strategic planning section that includes any aims or objectives that designate your school's special characteristics or its        Yes
       special character.
 6.    An annually updated section that establishes for the relevant year your board's aims, directions, objectives, priorities and targets           Yes
       relating to intended student outcomes, your school's performance and use of resources.
 7.    An annually updated section that sets targets for the key activities and achievement of objectives for the year.                               Yes
 8.    Your board's aims, objectives, directions, priorities and targets for student achievement, including the assessment of students against        Yes
       any national standard.
 9.    Your board's aims, directions, objectives, priorities and targets for your board’s activities aimed at meeting general government policy       Yes
       objectives for all schools, being policy objectives set out of referred to in national education guidelines, and specific policy objectives
       applying to your school.

                                                                                                                                                                                   2
10.     Your board's aims, directions, objectives, priorities and targets for the management of your school's and board's capability, resources,   Yes
         assets, and liabilities, including human resources, finances, property and other ownership matters.
 11.     All annual or long-term plans (or a summary or reference to them) your board is required to have or has prepared for its own purposes.     Yes

                                                                           TABLE OF CONTENTS

                                          Pages                                                                                Content
 1                                                                                        Cover Page
 2                                                                                        MOE Checklist
 3                                                                                        Table of Contents & Statement of Intent
 4-8                                                                                      Description, Key Statements and Special Character
 9-17                                                                                     NCEA Results with Analysis of Variance including Maori & Pasifika Success
 18-53                                                                                    Curriculum Levels Data & Analysis of Variance including Maori & Pasifika success
 54-62                                                                                    Analysis of Variance 2020 Annual Plan Actions
 63-70                                                                                    Strategic Planing and Intent 2021-2022
 71-76                                                                                    Self Review / Compliance
 77-82                                                                                    Maori and Pasifika Success Planning 2021-2022

                                                                         STATEMENT OF INTENT
It is our intent to fulfil the requirements of the National Education Goals in the provision of a focused and inspirational learning environment for student achievement.

We are currenty reviewing our ‘Success for Maori & Pasifika Plans’ through accessing MOE documents and consultation with parents who had identified their children as
being of either Maori or Pasifika ethnicity. Each year we report and analyse Maori and Pasifika achievement data and implement support for all students including priority
learners. Such programmes of support are documented and reported to the Board of Trustees through our annual reporting programme.

                                                                                                                                                                             3
We consult with and receive significant support from our community through cottage meetings and a variety of information, reporting and consultation events throughout
the year. Such events keep our parent community engaged and provide for dialogue, feedback and feed-forward contributing to our self-review and planning process.

                                                              DESCRIPTION & KEY STATEMENTS

•   Elim Christian College has a focus on high expectations for student achievement and character development through quality curriculum delivery, planning for student
    needs and assessment for better and on-going improvement in learning.
•   The college environment of three campuses: Golflands (Y1-6) Botany (Y7-13) and Mt Albert (Y1-13) are delightful well-disciplined, safe and caring student culture and
    climate – very encouraging, rewarding, empowering.
•   We have well qualified quality staff that inspire student achievement and contribution to every sphere of society.
•   We report regularly concerning student achievement to the Board of Trustees and community.
•   Our facilities, resourcing, fundraising and financial planning enhance student learning opportunities.
•   We aim to set challenging targets and appraisal expectations for staff performance and student achievement supported by an effective programme of professional
    development.
•   We aim for students to develop a comprehensive skill set, enabling them to compete for tertiary entry, enhance career prospects and expand their knowledge horizons.
•   Our strategic vision and planning produces influential short and long term direction.
•   We want students to develop a Christian worldview of life, values and standards, being equipped for leadership, work and service in the community.

                                                                       VISION STATEMENT

Elim Christian College community aims for each student to be inspired, responsible, academically and practically skilled life-long learners,
living their Christian values (of kindness/ aroha, diligence/pukuahuwhenua and respect/manakitanga) and exploring their God-given potential, to achieve
                                                              personal excellence for God’s glory.

                                                                      ARISE to a future and a hope

                                                                                                                                                                       4
Achievement                We want all students to achieve their personal best
Responsibility             We want all students to be self-disciplined, diligent citizens and life-long learners
Inspiration                We want all students to have fun learning, celebrate success with an attitude for excellence
Skills                     We want all students highly skilled and equipped to make a creative and innovative contribution to society
Elim Christian Character   We want all students to have a foundation of Biblical knowledge expressed vibrantly in Christian values and character

                                                                        Strategic Focus

                                                                                          Supporting BHAGs,
                                                                                           NAGs and NELPs
                                                                         Areas (SFAs)

                                                                                                              Special Character

                                                                                                                                                                                       Communications
       VISION

                                                                                                                                                                                                        Management
                                                                                                                                  Achievement
                                                                                                                                  Sport & Arts

                                                                                                                                                                          Governance
                                                                                                                                                             Reputation
                                                                                                                                                 Personnel
     STATEMENT

                                                                                                                                                                                                                     Facilities
                                                                                                                                  Student
   Elim Christian College
                                            1. To have a strong Elim Special Character
 community aims for each        BHAGs       modelling our operations                                             ü                                             ü
   student to be inspired,         as       2. To become a high performing school of
responsible, academically      supported    choice                                                                                ü ü ü ü                                   ü ü ü ü
   and practically skilled      by SFAs     3. To provide for all students and staff to
                                            optimize leadership growth potential                                 ü ü ü ü                                                    ü ü ü ü
  lifelong learners, living                 4. Maximise the opportunities that growth
 their Christian values (of                 brings                                                                                                                                        ü                            ü
      kindness/ aroha,                      1. Learning Programmes, Evaluation and Special
                                 NAGs       Programmes                                                                            ü ü ü                                     ü                             ü
diligence/pukuahuwhenua
                                   as       2. Strategic Plan Compilation against NEGs
and respect/manakitanga)
                               supported
                                                                                                                                                               ü            ü ü ü
 and exploring their God-       by SFAs     2a. Reporting
given potential, to achieve                                                                                                                                                 ü ü ü
                                            3. Good Employer
                                                                                                                                                  ü                         ü                             ü
                                                                                                                                                                                                                                  5
personal excellence for                          4. Financial Management
                                                                                                                                            ü           ü
     God’s glory.
                                                 5. Safe Environment
                                                                                                         ü                    ü             ü           ü ü
         To Reach,                               6. Compliance with General Legislation
                                                                                                                                            ü           ü
    Serve and Influence
                                                 7. Charter Compilation and Submission
                                                                                                         ü ü ü ü ü                          ü ü ü ü
                                                 8. Gap Analysis
                                                                                                                                            ü           ü
                                                 1. Learners at the centre
                                     NELPs
                                                                                                         ü ü ü ü ü                          ü ü ü
                                       as        2. Barrier free access
                                                                                                         ü ü ü ü ü                          ü ü ü
                                   supported
                                    by SFAs      3. Quality teaching and leadership
                                                                                                         ü ü ü ü ü                          ü ü ü
                                                 4. Future of Learning and Work
                                                                                                         ü ü ü ü ü                          ü ü ü
                                                 5. World Class Inclusive Public Education
                                                                                                         ü ü ü ü ü                          ü ü ü ü

                       The ARISE ‘strategic framework’ guides our curriculum direction, management and delivery

A    Achievement                We want all students to achieve their personal best
R    Responsibility             We want all students to be self-disciplined, diligent citizens and life-long learners
I    Inspiration                We want all students to have fun learning, celebrate success with an attitude for excellence
S    Skills                     We want all students highly skilled and equipped to make a creative and innovative contribution to society
E    Elim Christian Character   We want all students to have a foundation of Biblical knowledge expressed vibrantly in Christian values and character
                                                                                                                                                              6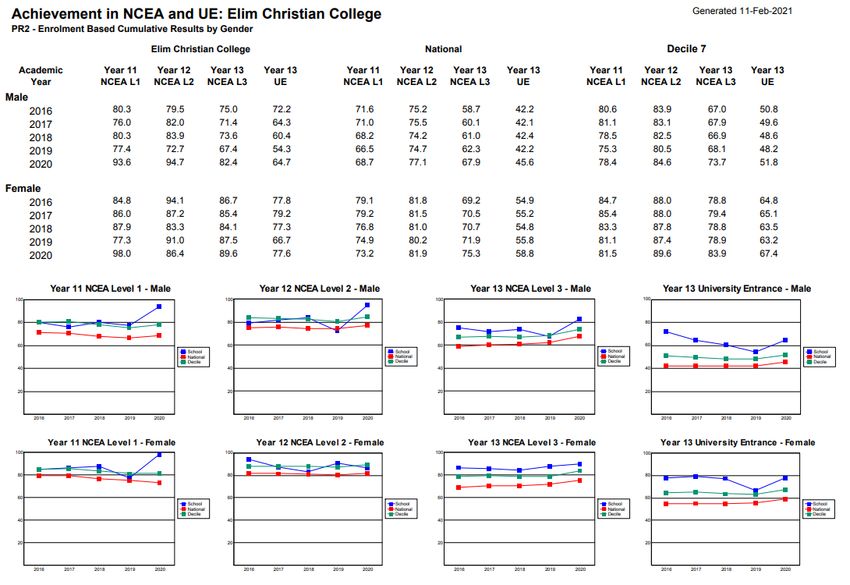
Our 4 BHAGS reflect and guide our strategic direction

   1.   BHAG 1             To have a strong Elim Special Character modelling our operations and programmes on biblical values
   2.   BHAG 2             To become a high-performing school of choice
   3.   BHAG 3             To provide for all students and staff to optimize their personal, professional and leadership growth potential
   4.   BHAG 4             To maximise the opportunities that growth brings

                                                         Special Character Description – Aims and Intent

The Special Character of Elim Christian College is determined by these guidelines and objectives and it is within these that the Principal and Staff operate:

Elim Christian College is a Decile 7 state-integrated area (Y1-13) school community of 1250 students - impacting the whole person and providing a seamless quality education
founded on a biblical world-view and based on sound Christian principles to provide for the educational needs of Christian families and present the message of the gospel
within the context of Biblical truth and practice as recognised by adherents of the evangelical Christian faith. The same Biblical truth and practice encourages a mission
perspective . Our special character is determined by the faith system made up of the Christian beliefs, values and lifestyle of our proprietors, the Elim Church of New Zealand
Inc who shall have the right to determine from time to time what is necessary to preserve and safeguard that Special Character. Parents and students are expected to support
the Special Character of the School.

The School is a caring community built on Christian beliefs which permeate all aspects of school life. These beliefs recognise God’s purposes as revealed in the Scriptures and
in the risen Lord Jesus Christ. They are dynamic and determine the purpose and content of the curriculum.

These beliefs encompass all aspects of the school and permeate the mind and heart of each member of the school community. It is expected that all staff members and
members of the Board of Trustees will demonstrate unqualified commitment to the school’s Special Charter.

The objective of Elim Christian College is to pass onto students the truth that all creation is subordinate to the Will of God as expressed in the Scriptures; that all truth finds
its meaning and centre in God and that God gives purpose and hope to individuals as well as His creation by virtue of the redemptive work of Jesus Christ. It is the redemptive
work of Jesus Christ, communicated by the Holy Spirit operating in the human individual that gives substance to intellectual, physical, spiritual, ethical, emotional, social and
aesthetic development.

                                                                                                                                                                                 7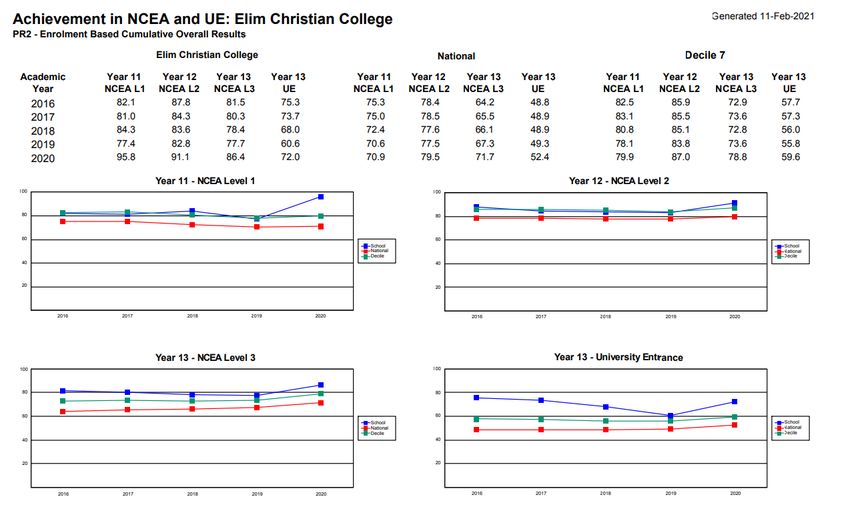
The curriculum, including all the New Zealand Curriculum Statements, is presented within a Christian world view. Such a world view gives perspective and meaning to all
learning in the School.

Implicit in the curriculum is the development of Christian ethical values exemplified by the Ten Commandments and Christ’s Sermon on the Mount. These values are the
foundation for personal and social peace, just government, responsible citizenship, compassionate neighbourliness, wise parenting and a responsible attitude to creation.
Such biblical values also recognise that a life of self-renouncing love is one of liberty.

Elim Christian College seeks to:

   •   Teach and nurture the Christian faith in a warm, friendly, open, disciplined environment, demonstrating respect for authority and all people
   •   Develop in students a biblical view of life, values and standards, teaching the lordship of Jesus Chrtist, the fullness of the Holy Spirit and the ultimate authority of
       the Bible in all aspects of the school and life in general.
   •   Ensure a balanced Biblical worldview curriculum contributing knowledge, skills and experience relevant to contemporary society through the provision of a wide
       range of subjects and learning opportunities
   •   Provide an excellent Christian education where the whole person is equipped for leadership, work and service in a whole of life context, towards personal excellence;
       a view of life fashioned and unified by the Bible
   •   Facilitate excellent stewardship of spirit, mind and body, producing disciples who are released in their God-given gifting and calling. Cultivating servant leadership
       and equipping for work and service in the world of the twenty-first century
   •   Foster an authentic supportive and affirming environment Christian environment that draws church, home and college together through effective communication,
       where all practices reflect respect for all stakholders as people created in the image of God
   •   Provide high quality facilities and equipment in a modern, contemporary environment
   •   Engender school spirit and a sense of community where there is respect for the dignity of each individual and where self-esteem, self-discipline, diligence, initiative,
       tolerance and caring are actively fostered
   •   Encourage students to become self-motivated and self-disciplined, committed to the pursuit of excellence and with high personal standards of endeavour and
       achievement, behaviour, manner and dress

                                                                                                                                                                             8
Variance: NCEA & Maori & Pasifika Success (Annual Report)
For the 2020 school year our Annual Plan as included in the Charter, identified a number of student achievement and school wide development targets to meet
our 4 BHAGS and therefore enable us to meet the requirements of the National Administration Goals (NAGs)
2020 ANALYSIS OF NCEA RESULTS
Summary: Enrolment-Based Cumulative Overall Results
Detailed Comparison:
% of students achieving NCEA Qualifications Elim 2020 (Nat Ave) Elim 2019 (Nat Ave) ELIM 2018 (Nat Avg) ELIM 2017 (Nat Avg)
[Decile 7] [Decile 4-7]
NCEA Level 3 Y13 students 96 (71) [80] 77 (66) [65] 78 (66) [66] 80 (66) [66]
Endorsed with Merit 48 (33) [35] 34 (27) [24] 33 (28) 41 (23)
Endorsed with Excellence 22 (21) [22] 14 (15) [13] 17 (15) 15 (16)
NCEA Level 2 Y12 students 91 (80) [87] 82 (76) [79] 84 (78) [80] 84 (79) [83]
Endorsed with Merit 46 (25) [27] 38 (26) [23] 44 (26) 34 (22)
Endorsed with Excellence 17 (18) [19] 20 (17) [14] 13 (16) 10 (16)
NCEA Level 1 Y11 students 86 (72) [79] 77 (69) [72] 84 (72) [75] 81 (75) [78]
Endorsed with Merit 38 (27) [28] 54 (35) [32] 48 (35) 35 (32)
Endorsed with Excellence 18 (18) [18] 16 (20) [17] 18 (21) 22 (20)
University Entrance 72 (52) [60] 61 (47) [44] 68 (49) [47] 74 (49) [47]
Number of Scholarships 7 6 4
Photography (2) Digital Technology (2) Painting Calculus
English (2) Chemistry (2) Economics (2) Chemistry
Geography Calculus Calculus (Y12 student) Physics
History Biology Geography Statistics (Outstanding)
French Statistics
As from 2018, data is now enrolment-based. NZQA has adjusted all historical data from 2014 to be enrolment-based (previously was participation-based).
9ACCELERATED STUDENTS IN YEARS 9/10:
§ 23 of our Y10 students entered L1 Mathematics:
§ 5 endorsed with Excellence and 9 with Merit
§ 2 of our Y10 students entered L2 Mathematics:
§ 2 endorsed with Excellence
1011
•   L1 Literacy 100% (National Average: 84.9%) [Decile 7: 91.5%]
•   L1 Numeracy 100% (National Average: 83.2%) [Decile 7: 90.6%]
        o Results will fluctuate from cohort to cohort and will not necessarily show incremental growth over the years
        o We are a small inclusive school where our vision is directed at growth of the individual holistically

                                                                                                                         12
o With our relatively small numbers, each cohort is different and opportunities are provided for Scholarship where appropriate
o There are a number of students who were involved in multi-level programmes who have now achieved their goals and are well prepared for their
career pathways ahead.
Number of Students
2020 2019 2018 2017 2016 2015 2014 2013 2012 2011 2010 2009
Y13 126 105 101 90 89 74 62 48 51 48 50 40
Y12 112 129 120 110 104 98 79 67 55 54 57 62
Y11 106 117 137 110 111 95 105 76 71 61 53 60
2020 School Leavers:
Leavers
Leavers With
Total Without
Level 2
Level 2
Students without Level 2:
Y13 126 124 2 • 1 student – mental health. Returning to South Africa
• 1 international student – did not achieve Level 1 or 2
• 1 student gained UE and Level 3 endorsed with Excellence. Gained 3
scholarships. Accepted into University of Auckland.
• 1 student did not gain Level 1 or 2 – significant mental health issues. Extensive support
Y12 14 11 3
from counsellor and NHS. Enrolled with Te Kura
• 1 student – mental health – end of schooling
• 1 student – end of schooling. Part time study
• 2 students enrolled at other schools
Y11 3 NA NA
• 1 student on to apprenticeship
143 135 5
• 94% of school leavers achieved L2 or higher.
• 98% of Y13 students left school with Level 2.
• All levels included a number of international students plus learning needs – aim is to gain L1 & L2 (multi-levelling) over two years
132020 Analysis of Maori and Pasifica Achievement
2020 Maori student achievement: (National Average in brackets)
% Merit
UE Number % Gained
Endorsement
55% (33) [34] • All students have achieved Level 2
5 • 1 student awarded University of Otago Maori Entrance
L3 11 82% (60) [63] 9%
Scholarship
• 5 students gained Level 3 and UE
- • 2 students did not achieve Level 1 or 2.
L2 14 71% (71) [76] 21% Also 2 students with mental health needs and 1 student on special
learning programme
L1 - 8 88% (58) [64] 50% • 1 student did not achieve Level 1
2020 Pasifica student achievement: (National Average in brackets)
% Merit
UE Number % Gained
Endorsement
54% (32) [33] • All students have achieved L2
L3
9 13 85% (68) [67] 15% • 9 students gained Level 3 and UE
L2 - 9 67% (76) [79] 56% • 2 students did not achieve Level 2
L1 - 8 78% (67) [72] 38% • 1 student did not achieve Level 1
142020 Analysis of Male and Female Achievement
2020 Male student achievement: (National Average in brackets)
% Merit % Excellence Endorsement
% UE Total Number % Gained
Endorsement
Level 1 - 50 94 (69) [75] 38% 22%
Level 2 - 61 95 (77) [81] 44% 9%
Level 3 65 (46) [43] 55 82 (68) [68] 29% 11%
2020 Female student achievement: (National Average in brackets)
% Merit % Excellence Endorsement
% UE Total Number % Gained
Endorsement
Level 1 - 51 98 (73) [77] 51% 18%
Level 2 - 50 86 (82) [86] 36% 20%
Level 3 78 (59) [57] 70 90 (75) [77] 36% 17%
Responsive Curriculum at BC: NCEA 2020
• 2020 was a challenging year for NCEA students. Despite this, students have exceeded previous achievement levels with high percentages of pass rates and
endorsements.
• 100% L1 Literacy and 100% L1 Numeracy – this is an excellent result, especially regarding Literacy which has shown significant improvement
• Student success has been accelerated by additional opportunities provided to students to gain credits to achieve NCEA L3 and university entrance.
• Effective tracking of “at risk” and including Maori/Pacific students have allowed for early intervention for success.
• Maori and Pacific results showed significant improvement in pass rates as well as levels of Merit endorsements – this reflects the purposeful emphasis on
recognising the importance of Bicultural identity and the focus on empowerment of Maori and Pacifica cross-cultural groups. All % rates were well above National
and comparative Decile 7 results, except for Level 2 which closely matches – we did have a weak cohort within Y12 Pacifica who were aiming for Level 1
completion.
• There was little discrepancy between Male vs Female students at Elim: At Year 12, Elim Male students’ results were higher than Females, with small differences at
Years 11 and 13. In comparison, National statistics show Females to outperform Males at all levels.
15• Numerous students who were identified as “at risk” have successfully gained their NCEA level(s). Some who have not been as successful would have benefitted
from earlier intervention and closer communication between counsellors, whanau leaders and teaching staff. It is intended that this will be improved through
KAMAR in 2021.
• There is a need to further embed learner agency within the NCEA curriculum to maintain the success rates.
2020 ANALYSIS OF NCEA RESULTS
Summary: Enrolment-Based Cumulative Overall Results
Detailed Comparison:
% of students achieving NCEA Qualifications Elim 2019 (Nat Ave) ELIM 2018 (Nat Avg) ELIM 2017 (Nat Avg) ELIM 2016 (Nat Avg) ELIM 2015 (Nat Avg)
[Decile 4-7]
NCEA Level 3 Y13 students 77 (66) [65] 78 (66) [66] 80 (66) [66] 82 (64) [65] 87 (63) [77]
Endorsed with Merit 34 (27) [24] 33 (28) 41 (23) 35 (27) 34 (28)
Endorsed with Excellence 14 (15) [13] 17 (15) 15 (16) 15 (15) 7 (14)
NCEA Level 2 Y12 students 82 (76) [79] 84 (78) [80] 84 (79) [83] 88 (78) [82] 90 (76) [80]
Endorsed with Merit 38 (26) [23] 44 (26) 34 (22) 47 (26) 49 (26)
Endorsed with Excellence 20 (17) [14] 13 (16) 10 (16) 11 (16) 13 (15)
NCEA Level 1 Y11 students 77 (69) [72] 84 (72) [75] 81 (75) [78] 82 (75) [78] 79 (75) [77]
Endorsed with Merit 54 (35) [32] 48 (35) 35 (32) 46 (34) 51 (34)
Endorsed with Excellence 16 (20) [17] 18 (21) 22 (20) 14 (20) 22 (19)
University Entrance 61 (47) [44] 68 (49) [47] 74 (49) [47] 75 (49) [48] 70 (48) [48]
Number of Scholarships 6 4 3 1
Digital Technology (2) Painting Calculus Calculus Statistics
Chemistry (2) Economics (2) Chemistry Chemistry
Calculus Calculus (Y12 student) Physics Physics
16Biology Geography Statistics (Outstanding)
Statistics
As from 2018, data is now enrolment-based. NZQA has adjusted all historical data from 2014 to be enrolment-based (previously was participation-based).
ACCELERATED STUDENTS IN YEARS 9/10:
SAC (Special Assessment Conditions) Students:
§ 18 of our Y10 students and 2 of our Y9 students entered L1 Mathematics: 2016 – 15
5 endorsed with Excellence and 6 with Merit 2017 – 11
2018 – 39: Y13 = 10, Y12 = 10, Y11 – 19
2019 – 35: 10 new & 27 existing
University Entrance Requirements: Y13 = 7, Y12 = 19, Y11 = 9
MAC: Y13 = 2, Y12 = 1
BC Y11 x 1 doing SPEC
• Achievement of NCEA L3 (minimum 60 credits at L3 plus 20 credits at L2)
From 2014 • 14 credits in each of three approved subjects
onwards • UE numeracy (10 credits at L1 or above)
• UE literacy 10 credits (5 reading and 5 writing from L2 or above from
specified achievemt standards)
172020 Analysis of Variance : Progress & Achievement Data & Maori & Pasifica Success (Annual Report)
2020 National Standard Reporting
School Number: 1190
Name: Elim Christian College Golfland Campus GC Y1-8
READING
READING: Well Below Below At Above At/Ab
Number % Number % Number % Number % %
Y1-8 2020
15 3.0% 70 13.9% 287 57.1% 131 26.0% 83.1%
503
Y1-8 2019
13 2.5% 73 14.1% 281 54.5% 149 28.9% 83.4%
516
Y1-6 2018
4 1.2% 60 17.3% 176 50.9% 106 30.6% 81.5%
346
Male-248 10 4.0% 36 14.5% 141 56.9% 61 24.6% 81.5%
Male -254 11 4.3% 42 16.6% 129 50.8% 72 28.3% 79.1%
Male - 176 2 1.1% 34 19.4% 91 51.7% 49 27.8% 79.5%
Female 255 5 2.0% 34 13.3% 146 57.2% 70 27.5% 84.7%
Female 262 2 0.8% 31 11.8% 152 58.1% 77 29.3% 87.4%
Female 170 2 1.2% 26 15.3% 85 50% 57 33.5% 83.5%
18Māori - 18 2 11.1% 3 16.7% 10 55.5% 3 16.7% 72.2%
Pasifika- 24 3 12.5% 3 12.5% 12 50.0% 6 25.0% 75.5%
Asian- 215 6 2.8% 25 11.6% 133 61.9% 51 23.7% 85.6%
European-
4 1.7% 35 15.2% 123 53.5% 68 29.6% 83.1%
230
MELAA- 13 0 0% 3 23.1% 7 53.8% 3 23.1% 76.9%
Other -3 0 0% 1 33.3% 2 66.7% 0 0% 66.7%
READING: Well Below Below At Above At/Ab
Number % Number % Number % Number % %
After 1yr 43 0 0% 15 34.9% 28 65.1% 0 0% 65.1%
After 2yrs 56 0 0% 14 25.0% 39 69.6% 3 5.4% 75.0%
After 3yrs 60 0 0% 12 20.0% 43 71.7% 5 8.3% 80.0%
EoY4 61 0 0% 12 19.7% 26 42.6% 23 37.7% 80.3%
EoY5 67 1 1.4% 4 6.0% 32 47.8% 30 44.8% 92.6%
EoY6 52 3 5.8% 1 1.9% 17 32.7% 31 59.6% 92.3%
EoY7 78 4 5.1% 5 6.4% 55 70.5% 14 18.0% 88.5%
EoY8 86 7 8.1% 7 8.1% 47 54.7% 25 29.1% 83.8%
READING 2015 2016 2017 2018 Y1-6 2019 Y1-8 2020
Elim GC Y1-8 89% 87% 87% 81.5% 83.4% 83.1%
Elim MAC Y1-8 87.4% 69.8% 85.4%
Elim MAC/GC
82.6% Y1-6 80.5% 84.3%
Combined
192020 National Standard Reporting
School Number: 1190
Name: Elim Christian College GC Y1-8
WRITING
WRITING: Well Below Below At Above At/Ab
Number % Number % Number % Number % %
Y1-8 2020
15 3.0% 81 16.1% 311 61.8% 96 19.1% 80.9%
503
Y1-8 2019
9 1.7% 93 18% 318 61.6% 96 18.6% 80.2%
516
Y1-6 2018
6 1.7% 84 24.3% 195 56.4% 61 17.6% 74%
346
Male-248 10 4.0% 48 19.4% 151 60.9% 39 15.7% 76.6%
Male -254 7 2.8% 64 25.2% 151 59.4% 32 12.6% 72%
Male - 176 4 2.3% 58 32.9% 92 52.3% 22 12.5% 64.8%
Female-255 5 2.0% 33 12.9% 160 62.7% 57 22.4% 85.1%
Female-262 2 0.8% 29 11.1% 167 63.7% 64 24.4% 88.1%
Female-170 2 1.2% 26 15.3% 103 60.6% 39 22.9% 83.5%
Māori -18 2 11.1% 5 27.8% 8 44.4% 3 16.7% 61.1%
Pasifika-24 2 8.3% 4 16.7% 15 62.5% 3 12.5% 75.0%
Asian-215 6 2.8% 24 11.2% 140 65.1% 45 20.9% 86.0%
20European-
5 2.2% 45 19.6% 138 60.0% 42 18.3% 78.3%
230
MELAA-13 0 0% 3 23.1% 7 53.8% 3 23.1% 76.9%
OTHER -3 0 0% 0 0% 3 100% 0 0% 100%
Well Below Below At Above At/Ab
WRITING: Number % Number % Number % Number % %
After 1yr 43 0 0% 10 23.3.% 32 74.4% 1 2.3% 76.7%
After 2yrs 56 0 0% 16 28.6% 39 69.6% 1 1.8% 71.4%
After 3yrs 60 0 0% 12 20.0% 43 71.7% 5 8.3% 85.5%
EoY4 61 1 1.6% 8 13.1% 30 49.2% 22 36.1% 85.3%
EoY5 67 0 0% 9 13.4% 41 61.2% 17 25.4% 86.6%
EoY6 52 3 5.8% 6 11.5% 29 55.8% 14 26.9% 82.7%
EoY7 78 4 5.1% 7 9.0% 59 75.6% 8 10.3% 85.9%
EoY8 86 7 8.1% 13 15.1% 38 44.2% 28 32.6% 76.8%
WRITING 2015 2016 2017 2018 (Y1-6) 2019 2020
Elim GC Y1-8 74% 75% 79% 74% Y1-6 80.2% 80.9%
Elim MAC Y1-8 84% 80.6% 77.2%
Elim GC/MAC
76% Y1-6 80.4% 79.1%
Combined
OLSS Y1-6 88.5%
SMCP Y1-6 89%
St Marks Y1-6 76%
Kingsgate 74%
School Y1-8
212020 National Standard Reporting
School Number: 1190
Name: Elim Christian College GC Y1-8
MATHEMATICS
Mathematics: Well Below Below At Above At/Ab
Number % Number % Number % Number % %
Y1-8 2020 503 19 3.8% 59 11.7% 223 44.3% 202 40.2% 84.5%
Y1-8 2019 516 18 3.5% 45 8.7% 253 49.0% 200 38.8% 87.8%
Y1-6 2018 -346 1 0.3% 30 8.7% 193 55.7% 122 35.3% 91%
Male - 248 11 4.4% 24 9.7% 106 42.7% 107 43.2% 85.9%
MALE - 254 10 3.9% 20 7.9% 115 45.3% 109 42.9% 88.2%
MALE - 176 0 0% 15 8.5% 89 50.6% 72 40.9% 91.5%
Female -255 8 3.1% 35 13.7% 117 45.9% 95 37.3% 83.2%
FEMALE- 262 8 3.1% 25 9.5% 138 52.7% 91 34.7% 87.4%
FEMALE-170 1 0.6% 15 8.8% 104 61.2% 50 29.4% 90.6%
Māori - 18 2 11.1% 4 22.2% 7 38.9% 5 27.8% 66.7%
Pasifika - 24 3 12.5% 3 12.5% 11 45.8% 7 29.2% 75.0%
Asian- 215 4 1.9% 17 7.9% 88 40.9% 106 49.3% 90.2%
European -230 10 4.3% 32 13.9% 111 48.3% 77 33.5% 81.8%
MELAA -13 0 0% 2 15.4% 5 38.5% 6 46.2% 84.7%
Other -3 0 0% 1 33.4% 1 33.3% 1 33.3% 66.6%
22Mathematics: Well Below Below At Above At/Ab
Number % Number % Number % Number % %
After 1yr 43 0 0% 3 7.0% 38 88.4% 2 4.6% 93.0%
After 2yrs 56 0 0% 6 10.7% 42 75.0% 8 14.3% 89.3%
After 3yrs 60 0 0% 14 23.3% 31 51.7% 15 25.0% 76.7%
EoY4 61 3 4.9% 6 9.8% 22 36.1% 30 49.2% 85.3%
EoY5 67 0 0% 7 10.4% 26 38.8% 34 50.8% 89.6%
EoY6 52 3 5.8% 4 7.7% 19 36.5% 26 50.0% 86.5%
EoY7 78 5 6.4% 7 9.0% 29 37.2% 37 47.4% 84.9%
EoY8 86 8 9.3% 12 14.0% 16 18.6% 50 58.1% 76.7%
Mathematics 2015 2016 2017 2018 Y1-6 2019 2020
Elim GC Y1-8 85% 86% 88% 91% Y1-6 87.8% 84.5%
Elim MAC Y1-8 89.9% 79.1% 82.9%
Elim MAC/GC 83.7%
90.8% Y1-6 86.0%
Combined
Data Comparison 2013-2020 For year cohorts
READING:
YEAR 1 Y1
2020
At/Above 65.1%
23YEAR 2 Y1 Y2 2020
2019
At/Above 78.7% 75.0%
YEAR 3 Y1 Y2 Y3
2018 2019 2020
At/Above 72.2% 75.4% 80.0%
YEAR 4 Y1 Y2 Y3 2019 Y4 2020
2017 2018
At/Above 79.6% 84.6% 87.1% 80.3%
YEAR 5 Y2 Y3 Y4 Y5
Y1 2016
2017 2018 2019 2020
At/Above 76% 79.5% 85.7% 86.4% 92.6%
YEAR 6 Y1 Y3 Y4 Y5 2019 Y6
Y2 2016
2015 2017 2018 2020
At/Above 77% 89% 91% 76% 85.5% 92.3%
YEAR 7 Y1 Y2 2015 Y3 Y4 Y5 Y6 Y7
2014 2016 2017 2018 2019 2020
At/Above 70% 93% 93% 92.2% 84.7% 91.7% 88.5%
24YEAR 8 Y1 Y2 Y3 Y4 Y6 Y7 Y8 2020
Y5 2017
2013 2014 2015 2016 2018 2019
At/Above 79.7% 91.2% 96.4% 81% 84.5% 83.7% 79.7% 83.8%
Data Comparison 2013-2020 For year cohorts
WRITING
YEAR 1 Y1 2020
At/Above 76.7%
YEAR 2 Y1 Y2
2019 2020
At/Above 72.3% 71.4%
YEAR 3 Y1 Y2 Y3 2020
2018 2019
At/Above 72.2% 75.4% 85.5%
YEAR 4 Y1 Y3 Y4 2020
Y2 2018
2017 2019
At/Above 85.7% 73.9% 85.5% 85.3%
YEAR 5 Y1 Y2 Y3 Y4 2019 Y5
252016 2017 2018 2020
At/Above 64% 72.6% 71.4% 75.8% 86.6%
YEAR 6 Y1 Y3 Y4 2018 Y5 2019 Y6
Y2 2016
2015 2017 2020
At/Above 70% 71% 76.8% 74% 72.7% 82.7%
YEAR 7 Y1 2014 Y2 2015 Y3 2016 Y4 2017 Y5 2018 Y6 Y7 2020
2019
At/Above 76.7% 83% 87% 82.9% 80% 88.4% 85.9%
YEAR 8 Y1 Y6 Y7 2019 Y8 2020
Y2 2014 Y3 2015 Y4 2016 Y5 2017
2013 2018
At/Above 86.9% 81% 73% 66% 69% 72.7% 81% 76.8%
Data Comparison 2013-2020 For year cohorts
MATHEMATICS:
YEAR 1 Y1
2020
At/Above 93.0%
YEAR 2 Y1 Y2
2019 2020
At/Above 89.4% 89.3%
26YEAR 3 Y1 Y3
Y2 2019
2018 2020
At/Above 85.2% 85.2% 76.7%
YEAR 4 Y1 Y3 2019 Y4
Y2 2018
2017 2020
At/Above 91.8% 95.4% 90.3% 85.3%
YEAR 5 Y1 Y2 Y3 2018 Y4 Y5
2016 2017 2019 2020
At/Above 91% 90.4% 98.4% 84.9% 89.6%
YEAR 6 Y1 Y4 2018 Y5 Y6 2020
Y2 2016 Y3 2017
2015 2019
At/Above 86% 92% 89.3% 92% 92.8% 86.5%
YEAR 7 Y5 2018 Y6 2019 Y7
Y1 2014 Y2 2015 Y3 2016 Y4 2017
2020
At/Above 85% 95% 94% 90.6% 84.7% 95.5% 84.9%
YEAR 8 Y6 2018 Y7 2019 Y8
Y1 2013 Y2 2014 Y3 2015 Y4 2016 Y5 2017
2020
At/Above 92.8% 94% 91% 88% 86.2% 89.1% 79.8% 76.9%
272020 National Standard Reporting
School Number: 1190
Name: Elim Christian College Mt Albert Campus MAC Y1-8
READING
READING: Well Below Below At Above At/Ab
Number % Number % Number % Number % %
Y1-8 2020
7 4.4% 16 10.1% 92 58.2% 43 27.2% 85.4%
158
Y1-8 2019
9 6.5% 33 23.7% 55 39.6% 42 30.2% 69.8%
139
Y1-8 2018
1 0.8% 14 11.8% 45 37.8% 59 49.6% 87.4%
119
Male - 78 7 9.0% 10 12.8% 39 50.0% 22 28.2% 78.2%
Male - 71 7 9.8% 19 26.8% 27 38% 18 25.4% 63.4%
Male - 58 1 1.8% 9 15.5% 24 41.4% 24 41.4% 82.8%
Female - 80 0 0% 6 7.5% 53 66.2% 21 26.3% 92.5%
Female - 68 2 2.9% 14 20.6% 28 41.2% 24 35.3% 76.5%
Female - 61 0 0% 5 8.2% 21 34.4% 35 57.4% 91.8%
Māori - 8 1 12.5% 1 12.5% 5 62.5% 1 12.5% 75.0%
Pasifika -15 1 6.7% 2 13.3% 12 80.0% 0 0% 80.0%
Asian - 107 5 4.7% 9 8.4% 62 57.9% 31 29.0% 86.9%
European-28 0 0% 4 14.3% 13 46.4% 11 39.3% 85.7%
28MELAA- 0 0 0% 0 0% 0 0% 0 0% 0%
Other - 0 0 0% 0 0% 0 0% 0 0% 0%
READING: Well Below Below At Above At/Ab
Number % Number % Number % Number % %
After 1yr 19 0 0% 3 15.8% 11 57.9% 5 26.3% 84.2%
After 2yrs 19 0 0% 1 5.3% 11 57.9% 7 36.8% 94.7%
After 3yrs 24 1 4.2% 3 12.5% 16 66.7% 4 16.7% 83.4%
EoY4 15 0 0% 0 0% 11 73.3% 4 26.7% 100%
EoY5 8 0 0% 0 0% 3 37.5% 5 62.5% 100%
EoY6 17 2 11.8% 5 29.4% 2 11.8% 8 47.1% 58.9%
EoY7 26 2 8.0% 3 12% 17 65.0% 4 15.0% 80.0%
EoY8 30 2 7% 1 3.0% 21 70% 6 20.0% 90.0%
READING 2015 2016 2017 2018 2019 2020
Elim MAC Y1-8 87.4% 69.8% 85.4%
Elim GC Y1-8 89% 87% 87% 81.5% Y1-6 83.4% 83.1%
Elim GC/MAC
82.5% Y1-6 80.5% 84.2%
Combined
292020 National Standard Reporting
School Number: 1190
Name: Elim Christian College MAC Y1-8
WRITING
WRITING: Well Below Below At Above At/Ab
Number % Number % Number % Number % %
Y1-8 2020
6 3.8% 30 19.0% 104 65.8% 18 11.4% 77.2%
158
Y1-8 2019
6 4.3% 21 15.1% 86 61.9% 26 18.7% 80.6%
139
Y1-8 2018
5 4.2% 14 11.8% 65 54.6% 35 29.4% 84%
119
Male - 78 6 7.7% 15 19.2% 52 66.7% 5 6.4% 72.1%
Male - 71 5 7.0% 16 22.5% 43 60.6% 7 9.9% 70.5%
Male - 58 3 5.2% 12 20.7% 34 58.6% 9 15.5% 74.1%
Female - 80 0 0% 15 18.8% 52 65.0% 13 16.2% 81.2%
Female-68 1 1.5% 5 7.4% 43 63.2% 19 27.9% 91.1%
Female-61 2 3.3% 2 3.3% 31 50.8% 26 42.6% 93.4%
Māori - 8 0 0% 3 37.5% 4 50.0% 1 12.5% 62.5%
Pasifika-15 1 6.7% 5 33.3% 9 60.0% 0 0% 60.0%
Asian-107 4 3.7% 18 16.8% 71 66.4% 14 13.1% 79.5%
European-28 1 3.6% 4 14.3% 20 71.4% 3 10.7% 82.1%
MELAA- 0 0 0% 0 0% 0 0% 0 0% 0%
OTHER - 0 0 0% 0 0% 0 0% 0 0% 0%
30Well Below Below At Above At/Ab
WRITING: Number % Number % Number % Number % %
After 1yr 19 0 0% 2 10.5% 17 89.5% 0 0% 89.5%
After 2yrs 19 0 0% 3 15.8% 13 68.4% 3 15.8% 84.2%
After 3yrs 24 0 0% 7 29.2% 17 70.8% 0 0% 70.8%
EoY4 15 1 6.7% 3 20.0% 10 66.6% 1 6.7% 73.3%
EoY5 8 0 0% 0 0% 6 75.0% 2 25.0% 100%
EoY6 17 1 5.9% 6 35.3% 8 47.0% 2 11.8% 58.8%
EoY7 26 3 11.5% 8 30.8% 14 53.9% 1 3.8% 57.7%
EoY8 30 1 3.3% 1 3.3% 19 63.4% 9 30.0% 93.4%
WRITING 2015 2016 2017 2018 2019 2020
Elim Mac Y1-8 84% 80.6% 77.2%
Elim GC Y1-8 74% 75% 79% 74% Y1-6 80.2% 80.9%
Elim GC/MAC 79.1%
76% Y1-6 80.4%
Combined
OLSS Y1-6 88.5%
SMCP Y1-6 89%
St Marks Y1-6 76%
Kingsgate 74%
School Y1-8
312020 National Standard Reporting
School Number: 1190
Name: Elim Christian College MAC Y1-8
MATHEMATICS
Mathematics: Well Below Below At Above At/Ab
Number % Number % Number % Number % %
Y1-8 2020 158 6 3.8% 21 13.3% 89 56.3% 42 26.6% 82.9%
Y1-8 2019 139 5 3.6% 24 17.3% 69 49.6% 41 29.5% 79.1%
Y1-8 2018 -119 2 1.7% 10 8.4% 48 40.3% 59 49.6% 89.9%
MALE - 78 5 6.4% 7 9.0% 46 59.0% 20 25.6% 84.6%
MALE - 71 3 4.2% 13 18.3% 37 52.1% 18 25.4% 77.5%
MALE - 58 1 1.7% 6 10.3% 22 38% 29 50% 88%
FEMALE - 80 1 1.3% 14 17.5% 43 53.8% 22 27.5% 81.3%
FEMALE - 68 2 2.9% 11 16.2% 32 47.1% 23 33.8% 80.9%
FEMALE - 61 1 1.6% 4 6.6% 26 42.6% 30 49.2% 90.3%
Māori - 8 0 0% 4 50% 4 50% 0 0% 50%
Pasifika -15 2 13.3% 2 13.3% 11 73.4% 0 0% 73.4%
Asian - 107 2 1.9% 10 9.3% 61 57.0% 34 31.8% 88.8%
European -28 2 7.1% 5 17.9% 13 46.4% 8 28.6% 75.0%
MELAA - 0 0 0% 0 0% 0 0% 0 0% 0%
Other - 0 0 0% 0 0% 0 0% 0 0% 0%
Mathematics: Well Below Below At Above At/Ab
Number % Number % Number % Number % %
32After 1yr 19 0 0% 0 0% 17 89.5% 2 10.5% 100%
After 2yrs 19 0 0% 1 5.3% 17 89.5% 1 5.3% 94.8%
After 3yrs 24 0 0% 4 16.7% 15 62.5% 5 20.8% 83.3%
EoY4 15 0 0% 1 6.7% 11 73.3% 3 20.0% 93.3%
EoY5 8 0 0% 0 0% 2 25.0% 6 75.0% 100%
EoY6 17 2 11.8% 6 35.3% 4 23.5% 5 29.4% 52.9%
EoY7 26 4 15.4% 6 23.1% 10 38.4% 6 23.1% 61.5%
EoY8 30 0 0% 3 10% 13 43.3% 14 46.7% 100%
Mathematics 2015 2016 2017 2018 2019 2020
Elim MAC Y1-8 89.9% 79.1% 82.9%
Elim GC Y1-8 85% 86% 88% 91% Y1-6 87.8% 84.5%
Elim GC/MAC 90.8% Y1-6 86.0% 83.7%
Y1-8 Combined
Data Comparison 2013-2020 For year cohorts
READING:
YEAR 1 Y1
2020
At/Above 84.3%
YEAR 2 Y1 Y2 2020
2019
At/Above 35.7% 94.7%
33YEAR 3 Y1 Y2 Y3
2018 2019 2020
At/Above 75.0% 52.4% 83.4%
YEAR 4 Y1 Y2 Y3 2019 Y4 2020
2017 2018
At/Above 100% 66.6% 100%
YEAR 5 Y2 Y3 Y4 Y5
Y1 2016
2017 2018 2019 2020
At/Above 91.7% 92.4% 100%
YEAR 6 Y1 Y3 Y4 Y5 2019 Y6
Y2 2016
2015 2017 2018 2020
At/Above 100% 79.0% 58.9%
YEAR 7 Y1 Y2 2015 Y3 Y4 Y5 Y6 Y7
2014 2016 2017 2018 2019 2020
At/Above 75.0% 73.1% 80.0%
YEAR 8 Y1 Y2 Y3 Y4 Y6 Y7 Y8 2020
Y5 2017
2013 2014 2015 2016 2018 2019
At/Above 80.2% 92.9% 90.0%
34Data Comparison 2013-2020 For year cohorts
WRITING
YEAR 1 Y1 2020
At/Above 89.5%
YEAR 2 Y1 Y2
2019 2020
At/Above 78.6% 84.2%
YEAR 3 Y1 Y2 Y3 2020
2018 2019
At/Above 100% 90.5% 70.8%
YEAR 4 Y1 Y3 Y4 2020
Y2 2018
2017 2019
At/Above 84.6% 90.9% 73.3%
YEAR 5 Y1 Y2 Y3 Y4 2019 Y5
2016 2017 2018 2020
At/Above 92.3% 71.4% 100%
35YEAR 6 Y1 Y3 Y4 2018 Y5 2019 Y6
Y2 2016
2015 2017 2020
At/Above 58.4% 92.3% 58.8%
YEAR 7 Y1 2014 Y2 2015 Y3 2016 Y4 2017 Y5 2018 Y6 Y7 2020
2019
At/Above 62.6% 78.9% 57.7%
YEAR 8 Y1 Y6 Y7 2019 Y8 2020
Y2 2014 Y3 2015 Y4 2016 Y5 2017
2013 2018
At/Above 75.0% 61.6% 93.4%
Data Comparison 2013-2020 For year cohorts
MATHEMATICS:
YEAR 1 Y1
2020
At/Above 100%
YEAR 2 Y1 Y2
2019 2020
At/Above 71.4% 94.8%
36YEAR 3 Y1 Y3
Y2 2019
2018 2020
At/Above 100% 71.4% 83.3%
YEAR 4 Y1 Y3 2019 Y4
Y2 2018
2017 2020
At/Above 92.3% 72.7% 93.3%
YEAR 5 Y1 Y2 Y3 2018 Y4 Y5
2016 2017 2019 2020
At/Above 84.6% 76.2% 100%
YEAR 6 Y1 Y4 Y5 Y6 2020
Y2 2016 Y3 2017
2015 2018 2019
At/Above 83.6% 84.6% 52.9%
YEAR 7 Y5 2018 Y6 2019 Y7
Y1 2014 Y2 2015 Y3 2016 Y4 2017
2020
At/Above 85.5% 73.6% 61.5%
YEAR 8 Y6 2018 Y7 2019 Y8
Y1 2013 Y2 2014 Y3 2015 Y4 2016 Y5 2017
2020
At/Above 91.6% 84.7% 100%
372020 National Standard Reporting
School Number: 1190
Name: Elim Christian College GC and MAC Y1-8 Combined
READING
READING: Well Below Below At Above At/Ab
Number % Number % Number % Number % %
Y1-8 2020
22 3.1% 86 12.7% 379 57.5% 174 26.7% 84.2%
661
Y1-8 2019
22 3.3% 106 16.2% 336 51.3% 191 29.2% 80.5%
655
Y1-6 2018
5 1.1% 73 16.4% 211 47.4% 156 35.1% 82.5%
445
Male - 326 17 5.2% 46 14.1% 180 55.2% 83 25.5% 80.7%
Male - 325 18 5.5% 61 18.8% 156 48.0% 90 27.7% 75.7%
Male - 224 2 0.9% 43 19.2% 109 48.7% 70 31.2% 79.9%
Female-335 5 1.5% 40 11.9% 199 59.4% 91 27.2% 86.6%
Female 330 4 1.2% 45 13.6% 180 54.6% 101 30.6% 85.2%
Female 221 3 1.4% 30 13.6% 102 46.1% 86 38.9% 85.0%
Māori -26 3 11.5% 4 15.4% 15 57.7% 4 15.4% 73.1%
Pasifika-39 4 10.3% 5 12.8% 24 61.5% 6 15.4% 76.9%
Asian-322 11 3.4% 34 10.6% 195 60.5% 82 25.5% 86.0%
European-
4 1.6% 39 15.1% 136 52.7% 79 30.6% 83.3%
258
38MELAA- 13 0 0% 3 23.1% 7 53.8% 3 23.1% 76.9%
Other -3 0 0% 1 33.3% 2 66.7% 0 0% 100%
READING: Well Below Below At Above At/Ab
Number % Number % Number % Number % %
After 1yr 62 0 0% 18 29.0% 39 62.9% 5 8.1% 71.0 %
After 2yrs 75 0 0% 15 20.0% 50 66.7% 10 13.3% 80.0%
After 3yrs 84 1 1.2% 15 17.9% 59 70.2% 9 10.7% 80.9%
EoY4 76 0 0.0% 12 15.8% 37 48.7% 27 35.5% 84.2%
EoY5 75 1 1.3% 4 5.3% 35 46.7% 35 46.7% 93.4%
EoY6 69 5 7.3% 6 8.7% 19 27.5% 39 56.5% 84.0%
EoY7 104 6 5.8% 8 7.7% 72 69.2% 18 17.3% 86.5%
EoY8 116 9 7.8% 8 6.9% 68 58.6% 31 26.7% 85.3%
READING 2015 2016 2017 2018 2019 2020
Elim GC/MAC 82.5% Y1-6 80.5% 84.2%
Y1-8
Elim MAC Y1-8 87.4% 69.8% 85.4%
Elim GC Y1-8 89% 87% 87% 81.5% Y1-6 83.4% 83.1%
Howick 81% 81%
Auckland 77% 77%
NZ 78% 78%
2020 National Standard Reporting
School Number: 1190
Name: Elim Christian College GC and MAC Y1-8 COMBINED
WRITING
WRITING: Well Below Below At Above At/Ab
39Number % Number % Number % Number % %
Y1-8 2020
21 3.2% 111 16.9% 415 62.7% 114 17.2% 79.9%
661
Y1-8 2019
15 2.2% 114 17.4% 404 61.7% 122 18.7% 80.4%
655
Y1-6 2018
11 2.5% 98 22% 247 55.5% 89 20% 75.5%
445
Male - 326 16 4.9% 63 19.3% 203 62.3% 44 13.5% 75.8%
Male - 325 12 3.7% 80 24.6% 194 59.7% 39 12.0% 71.7%
Male - 224 7 3.1% 70 31.3% 118 52.7% 29 12.9% 65.6%
Female-335 5 1.5% 48 14.3% 212 63.3% 70 20.9% 84.2%
Female-330 3 0.9% 34 10.3% 210 63.6% 83 25.2% 88.8%
Female-221 4 1.8% 28 12.7% 129 58.4% 60 27.1% 85.5%
Māori - 26 3 11.5% 6 23.1% 13 50.0% 4 15.4% 65.4%
Pasifika-39 3 7.7% 9 23.1% 24 61.5% 3 7.7% 69.2%
Asian-322 10 3.1% 42 13.0% 211 65.6% 59 18.3% 84.1%
European-
6 2.3% 49 19.0% 158 61.2% 45 17.5% 78.7%
258
MELAA-13 0 0% 3 23.1% 7 53.8% 3 23.1% 76.9%
OTHER -3 0 0% 0 0% 3 100% 0 0% 100%
Well Below Below At Above At/Ab
WRITING: Number % Number % Number % Number % %
After 1yr 62 0 0% 12 19.4% 49 79.0% 1 1.6% 80.6%
After 2yrs 75 0 0% 19 25.4% 52 69.3% 4 5.3% 74.6%
40After 3yrs 84 0 0% 19 22.6% 60 71.4% 5 6.0% 77.4%
EoY4 76 2 2.6% 11 14.5% 40 52.6% 23 30.3% 82.9%
EoY5 75 0 0% 9 12.0% 47 62.7% 19 25.3% 88.0%
EoY6 69 4 5.8% 12 17.4% 37 53.6% 16 23.2% 76.8%
EoY7 104 7 6.7% 15 14.4% 73 70.2% 9 8.7% 78.9%
EoY8 116 8 6.9% 14 12.1% 57 49.1% 37 31.9% 81.0%
WRITING 2015 2016 2017 2018 2019 2020
Elim GC/MAC 75.5% Y1-6 80.4% 79.9%
Y1-8
Elim MAC Y1-8 84% 80.6% 77.2%
Elim GC Y1-8 74% 75% 79% 74% Y1-6 80.2% 80.9%
OLSS Y1-6 88.5%
SMCP Y1-6 89%
St Marks Y1-6 76%
Kingsgate 74%
School Y1-8
2020 National Standard Reporting
School Number: 1190
Name: Elim Christian College GC and MAC Y1-8 COMBINED
MATHEMATICS
Mathematics: Well Below Below At Above At/Ab
Number % Number % Number % Number % %
Y1-8 2020 -661 25 3.9% 80 12.2% 312 47.1% 244 36.8% 83.9%
Y1-8 2019 -655 23 3.5% 69 10.5% 322 49.2% 241 36.8% 86.0%
41Y1-6 2018 -445 3 0.7% 38 8.5% 236 53% 168 37.8% 90.8%
MALE - 326 16 4.9% 31 9.5% 152 46.6% 127 39.0% 85.6%
MALE- 325 13 4.0% 33 10.1% 152 46.8% 127 39.1% 85.9%
MALE-224 1 0.4% 20 8.9% 109 48.7% 94 42% 90.7%
Female - 335 9 2.7% 49 14.6% 160 47.8% 117 34.9% 82.7%
FEMALE- 330 10 3.0% 36 10.9% 170 51.5% 114 34.6% 86.1%
FEMALE-221 2 0.9% 18 8.1% 127 57.5% 74 33.5% 91%
Māori - 26 2 7.7% 8 30.8% 11 42.3% 5 19.2% 61.5%
Pasifika - 39 5 12.8% 5 12.8% 22 56.4% 7 18.0% 74.4%
Asian- 322 6 1.9% 27 8.4% 149 46.3% 140 43.4% 89.7%
European -258 12 4.7% 37 14.3% 124 48.1% 85 32.9% 81.0%
MELAA -13 0 0% 2 15.4% 5 38.5% 6 46.1% 84.6%
Other -3 0 0% 1 33.4% 1 33.3% 1 33.3% 66.6%
Mathematics: Well Below Below At Above At/Ab
Number % Number % Number % Number % %
After 1 yr 62 0 0% 3 4.8% 55 88.7% 4 6.5% 95.2%
After 2yrs 75 0 0% 7 9.3% 59 78.7% 9 12.0% 90.7%
After 3yrs 84 0 0% 18 21.4% 46 54.8% 20 23.8% 78.6%
EoY4 76 3 4.0% 7 9.2% 33 43.4% 33 43.4% 86.8%
EoY5 75 0 0% 7 9.3% 28 37.4% 40 53.4% 90.7%
EoY6 69 5 7.2% 10 14.5% 23 33.4% 31 44.9% 78.3%
EoY7 104 9 8.7% 13 12.5% 39 37.5% 43 41.3% 78.8%
EoY8 116 8 6.9% 15 12.9% 29 25.0% 64 55.2% 80.2%
42Mathematics 2015 2016 2017 2018 2019 2020
Elim GC/MAC 90.8% Y1-6 85.8% 83.9%
Y1-8
Elim MAC Y1-8 89.8% 79.1% 82.9%
Elim GC Y1-8 85% 86% 88% 91.0% Y1-6 87.8% 84.5%
2017-2020 Priority Learner Data Analysis
Writing- Maori students
WRITING: Well Below Below At Above At/Ab
Number % Number % Number % Number % %
ALL STUDENTS MAC/GC Combined Writing Results
Y1-8 2020
21 3.2% 111 16.9% 415 62.7% 114 17.2% 79.9%
661
Y1-8 2019
15 2.2% 114 17.4% 404 61.7% 122 18.7% 80.4%
655
Y1-6 2018
11 2.5% 98 22% 247 55.5% 89 20% 75.5%
445
GC Y1-8
13 2.8% 85 18.1% 317 67.4% 55 11.7% 79.1%
2017 470
MAORI STUDENTS Boys and Girls MAC/GC Combined Writing Results
Y1-8 Māori –
3 11.5% 6 23.1% 13 50.0% 4 15.4% 65.4%
26 2020
Y1-8 Māori –
1 3.8% 9 34.7% 15 57.7% 1 3.8% 61.5%
26 2019
43Y1-6 Maori
1 5.6% 6 33.3% 11 61.1% 0 0% 61.1%
– 18 2018
Y1-8 Maori–
1 5.3% 7 36.8% 11 57.9% 0 0% 57.9%
19 2017
MAORI STUDENTS BOYS MAC/GC Combined Writing Results
Y1-8 Maori
Boys–14 3 21.5% 1 7.1% 8 57.1% 2 14.3% 71.4%
2020
Y1-8 Māori
Boys–13 0 0% 8 61.5% 5 38.5% 0 0% 38.5%
2019
Y1-6 Māori
Boys – 9 1 5.6% 6 33.3% 4 61.1% 0 0% 61.1%
2018
GCY1-8
Māori Boys– 0 0% 3 50% 3 50% 0 0% 50.0%
6 2017
MAORI STUDENTS GIRLS MAC/GC Combined Writing Results
Y1-8 Maori
Girls –12 0 0% 5 41.7% 5 41.7% 2 16.7% 58.4%
2020
Y1-8 Māori
Girls–13 1 7.7% 1 7.7% 10 76.9% 1 7.7% 84.6%
2019
Y1-6 Māori
Girls – 9 0 0% 2 22.2% 7 77.8% 0 0% 77.8%
2018
44GCY1-8
Māori Girls– 1 7.7% 4 30.8% 8 61.5% 0 0% 61.5%
13 2017
In 2020, all students at GC/MAC Y1-8 combined are achieving at 79.9% at/ab the expected level in Writing.
This is a slight drop on 2019 (80.4%) but with such a disrupted year, this is pleasing.
GC Y1-8 all students – 80.9% at/ab expected level.
MAC Y1-8 all students – 77.2% at/ab expected level.
• Overall, Maori students continue to achieve at a lower rate than other students with 65.4% at/ab when compared with: Pasifika – 69.2%, Asian – 84.1%, European
78.7%, MELAA -76.9% and Other 100% (These are all GC/MAC combined boys and girls at/ab the expected level results.)
• In 2020, all Maori students at GC/MAC Y1-8 combined are achieving at 65.4% at/ab the expected level in Writing. A 3.9% increase on last year. (61.5%) This is an
encouraging result.
• In 2020, Maori boys at GC/MAC Y1-8 combined are achieving at 71.4% at/ab the expected level. An increase of 32.9% from 2019 with a similar number of students.
This an excellent result.
• However, Maori girls in 2020 at GC/MAC combined are achieving at 58.4% at/ab the expected level, a 26.2% decrease on 2019 with similar numbers of students.
Why did the Maori girls struggle so much this year with their writing in this Covid-19 disrupted year? Boys were not as badly affected by the disruptions and seemed to
make good progress on their return to school. Were we intentionally working harder with our boys during the lockdowns and when they returned to school to ensure they
continued to progress that we neglected our girls? Girls tend to talk about their writing ideas more with their peers and the teacher; so did the lack of social interaction and
group work impact more on the girls’ writing than boys? Teachers must continue to engage all the boys in the writing process, especially our Maori boys; and now perhaps
look at the oral language component for girls during the writing process too, to ensure girls have optimum conditions for exploring their ideas, the structure and endings to
their writing etc through discussion and questioning sessions.
• At MAC – Boys (5 students only) 80% at/ab. Girls (3 students only) 33.3% at/ab the expected level.
• At GC – Boys (9 students only) 66.7% at/ab. Girls (9 students only) 66% at/ab the expected level.
• Both campuses must work hard to improve writing results for their Maori students.
45Review (Analysis of Variance) of 2020: Annual Plan Actions
NAG2A (b)(i) Area of Strength
Progress and Achievement Data: Reading, Writing and Mathematics
Discussion:
We are pleased with our Progress and Achievement Data in 2020 for all our core subject areas. Since this has been such a disrupted year with many of our acceleration
and support programmes not being fully realised this year, it is pleasing to see such good results.
Golflands (GC) and Mt Albert Campus (MAC) Combined Y1-8 Data:
Reading:
84.2% of all Y1-8 students either at or above the expected curriculum level in Reading. 3.7 % higher than 2019.
Boys - 80.7% at or above – 5% higher than last year.
Girls – 86.6% at or above – 1.4% higher than the previous year. As usually girls perform better than boys in this subject with 5.9% higher results.
Maori students – at/ab 73.1% - same as last year.
Pacific students – at/ab 76.9% - 0.5% decrease from 2019.
Asian students – at/ab 86% - 4.7% increase from 2019.
European students – at/ab 83.3%- 2.8% increase from 2019.
46MELAA students – at/ab 76.9% - 3.1% decrease from 2019
Other students (only 3) – 100% - same as last year.
In Reading, our 20202 GC/MAC combined results show we have the following year levels reaching 85% at and above the required curriculum level:
93.4% ‘End of Year 5’
86.5% ‘End of Year 7’
85.3% ‘End of Year 8’
Significant progress: MAC (Mt Albert Campus) Overall Y1-8: 85.4% at/ab the expected level. 15.6% increase from 2019. Assessment protocols following best practice
from TKI have now been established on this new campus and staff have undertaken professional development in how to make an OTJ (overall teacher judgement) using
summative, formative and in class observations etc and using PaCT for Writing. It is pleasing to see more consistent results due to these implementations and the
moderation that is now taking place across the year levels.
Writing:
79.9% of all Y1-8 students either at or above the expected curriculum level in Writing. 0.5% lower than 2019.
Boys – 75.8% at or above – 4.1% higher than last year.
Girls – 84.2% at or above – 4.6% lower than the previous year. As usually girls perform better than boys in this subject with 8.4% higher results.
Maori students – at/ab 65.4% - 3.9% increase from 2019.
Pacific students – at/ab 69.2% - 13.3% decrease from 2019.
Asian students – at/ab 84.1% - 0.5% increase from 2019.
European students – at/ab 78.7%- 1.2% increase from 2019.
MELAA students – at/ab 76.9% - 9.8% decrease from 2019
Other students (only 3) – 100% - same as last year.
In Writing, our 20202 GC/MAC combined results show we have the following year levels reaching 85% at and above the required curriculum level:
88.0% ‘End of Year 5’
Mathematics:
83.9% of all Y1-8 students either at or above the expected curriculum level in Mathematics. 2.1% lower than 2019.
Boys – 85.6% at or above – 0.3% lower than last year.
47Girls – 82.7% at or above – 3.4% lower than the previous year. Girls’ results are usually comparable with the boys, however this year the girls have lower results than
the boys with 2.9% lower results.
Maori students – at/ab 61.5% - 0.1% decrease from 2019.
Pacific students – at/ab 74.4% - 10.6% decrease from 2019.
Asian students – at/ab 89.7% - 0.3% decrease from 2019.
European students – at/ab 81.0%- 3.3% decrease from 2019.
MELAA students – at/ab 84.6% - 4.6% increase from 2019
Other students (only 3) – 66.6% - 33.4% decrease from 2019.
In Mathematics, our 20202 GC/MAC combined results show we have the following year levels reaching 85% at and above the required curriculum level:
95.2% ‘After 1 yr at school’
90.7% ‘After 2yrs at school’
86.8% ‘End of Year 4’
90.7% ‘End of Year 5’
Good progress: MAC (Mt Albert Campus) Overall Y1-8: 82.9% at/ab the expected level. 3.8% increase from 2019.
NAG2A (b)(i) Areas for improvement
Progress and Achievement Results for the core subjects: Targeted areas for improvement at each campus:GC and MAC for particular subjects.
Discussion:
Reading:
MAC (Mt Albert Campus) Overall Y1-8: 85.4% at/ab the expected level. 15.6% increase from 2019.
However, there is quite a discrepancy between boys and girls reading results: 78.2% at/ab for boys; 92.5% at/ab for girls - 14.3% higher for girls.
Acceleration and support programmes to improve the boys’ reading need to be improved at MAC. This will be a targeted area for MAC in 2021.
GC (Golflands Campus) Overall Y1-8: 83.1% at/ab the expected level. 0.3% increase from 2019.
Boys 81.5% at/ab and girls 84.7% at/ab. 3.2% higher for girls. Not as pronounced as MAC.
48However, Maori 72.2% at/ab - 7.8% decrease on 2019 and Pasifika 75.5% - 14.2% decrease on 2019. This is an area of concern. Many of these students were in the
acceleration and support reading programmes. They have missed out on the extra support they needed to maintain their progress in 2020. These students need to be
targeted in 2021.
Writing:
MAC (Mt Albert Campus) Overall Y1-8: 77.2% at/ab the expected level. 3.4% decrease from 2019.
There is again a discrepancy between boys and girls writing results: 72.1% at/ab for boys; 81.2% at/ab for girls - 9.1% higher for girls.
Acceleration and support programmes to improve the boys’ writing need to be established at MAC and professional development to support teachers in how to engage
boys in the writing process need to be a focus for 2021.
Maori students’ Writing results: 62.5% at/ab the expected level but a 29.2% increase from 2019; and Pasifika students’ Writing results: 60% at/ab the expected level –
12.7% decrease from last year. Both well below the expected level and an area of concern.
Writing for boys and also for Maori and Pasifika students will be a targeted area for MAC in 2021.
GC (Golflands Campus) Overall Y1-8: 80.9% at/ab the expected level. 0.7% increase from 2019.
Boys 76.6% at/ab and girls 85.1% at/ab. 8.5% higher for girls. Similar discrepancy to MAC.
However, Maori 61.1% at/ab - 8.4% decrease from 2019, Pasifika 75.0% - 11.2% decrease from 2019. This is contimues to be an area of concern. Many of these
students were in the acceleration and support writing programmes. They have missed out on the extra support they needed to maintain their progress in 2020. These
students need to be targeted in 2021.
Mathematics:
MAC (Mt Albert Campus) Overall Y1-8: 82.9% at/ab the expected level. 3.8% increase from 2019.
There is again a discrepancy between boys and girls mathematics results: 84.6% at/ab for boys; 81.3% at/ab for girls – 3.3% higher for boys. Not as pronounced as the
Reading and Writing results.
Maori students’ Mathematics results: 50% at/ab – same as last year; and Pasifika students’ Mathematics results: 73.4% at/ab the expected level but a huge
improvement on last year when the results at/ab were 18.9% lower.
Mathematics for Maori and Pasifika students will be a targeted area for MAC in 2021.
GC (Golflands Campus) Overall Y1-8: 84.5% at/ab the expected level. 3.3% decrease from 2019.
Boys 85.9% at/ab and girls 83.2 % at/ab the expected level. 2.7% higher for boys. Usually the boys’ and girls’ results in mathematics have been comparable. This is an
area of concern
However, Maori 66.7% at/ab - 8.4% decrease from 2019, Pasifika 75.0% - 11.2% decrease from 2019. This is continues to be an area of concern. Many of these
students were in the acceleration and support writing programmes. They have missed out on much of the extra support they needed to maintain their progress in 2020.
These students will be targeted in 2021.
49NAG2A (b)(ii) Basis for identifying areas for improvement and Planned Actions to continue to lift achievement in 2020 for Writing.
Reading at/ab the expected level:
2018 2019 2020
MAC GC MAC GC MAC GC
Overall 87.4% 81.5% 69.8% 83.4% 85.4% 83.1%
Boys 82.8% 79.5% 63.4% 79.1% 78.2% 81.5%
Girls 91.8% 83.5% 76.5% 87.4% 92.5% 84.7%
Maori students 100% 64.3% 50.0% 80.0% 75.0% 72.2%
Pacific Island students 81.5% 75.0% 45.5% 89.7% 80.0% 75.5%
Writing at/ab the expected level:
2018 2019 2020
MAC GC MAC GC MAC GC
Overall 84.0% 74.0% 80.6% 80.2% 77.2% 80.9%
Boys 74.1% 64.8% 70.5% 72.0% 72.1% 76.6%
Girls 93.4% 83.5% 91.1% 88.1% 81.2% 85.1%
Maori students 75.0% 57.2% 33.3% 70.0% 62.5% 61.1%
Pacific Island students 72.8% 87.6% 72.7% 86.2% 60.0% 75.0%
Mathematics at/ab the expected level:
2018 2019 2020
MAC GC MAC GC MAC GC
Overall 89.9% 91.0% 79.1% 87.8% 82.9% 84.5%
Boys 88.0% 91.5% 77.5% 88.2% 84.6% 85.9%
Girls 90.3% 90.6% 80.9% 87.4% 81.3% 83.2%
Maori students 100% 64.3% 50.0% 64.3% 50.0% 66.7%
Pacific Island students 63.6% 100% 54.5% 96.5% 73.4% 75.0%
NAG2A (b)(iii) Planned actions in 2020 for Developing Improved Consistency and Reliabilty of Teacher OTJs in Mathematics using the Progress and Achievement
50Tool. (PaCT)
Discussion: Mathematics:
Our Progress and Achievement OTJ data for Mathematics continues to be a strength at Elim Christian College Y1-8. (84.5% of students achieving at/ab the expected
curriculum level - GC/MAC combined results. Of note is the 61.5% of Maori students achieving at/ab the expected level in Mathematics. They are the lowest performing
group at Elim Christian College. In 2019, 61.6% of our Maori students were performing at/ab the expected level, so there is still work to be done. Since 2017 we have
been using the PaCT to make our OTJs in Writing and have found this a very useful tool for greater consistency and reliability in making our OTJs, and it also supports the
targeted teaching of Writing in our learning spaces. Last year in 2019, our goal was to embrace the use of this tool in Mathematics to not only support our teachers in
making their OTJs but also to inquire into our teaching of Mathematics to see if this tool can also improve our approach to the teaching and learning of Mathematics
from Y1-6 at GC and MAC. However, the disruptions caused by the Covid-19 pandemic, made this difficult to undertake. We wish to continue with this goal for
Mathematics, with the view of improving the results for girls and Maori and Pacific Island students.
We will continue to embrace every means to continue to our acceleration of writing, especially for boys and aprtivularly Maori boys.
We will also make a check on all assessment tools used for assessing reading progress and achievement and provide professional development for all teachers to ensure
reliability and consistency of delivery.
Actions to achieve your objectives What will success look like? When / Time
Who
frame
51Term 1
a. Engage with Professional Development on PaCT with a. All GC and MAC Y1-6 teachers will attend this first All teachers
an external facilitator – Evaluation Associates. PaCT PLD session for Mathematics
b. Progress and Achievement OTJ (NS) Data for b. Teachers take note of the analysis of Mathematics
Mathematics for all students will be presented to all data presented on the first TODs and see where
staff for discussion. there is room for improvement.
c. Teachers gather Mathematics data on their 2020 c. Teachers look closely at their student data for
students, especially their priority learners including Mathematics in 2019. Any new students will be
Māori and Pasifika students for follow up. assessed. The students will be grouped into targeted
d. Teachers develop their inquiry focus based on teaching groups for term 1. Proirity learners will be
Mathematics with Learner Agency as the lens with targeted and tracked so that all necessary support is
the support of the WSLs. provided to ensure a successful learning year.
e. Make changes to their assessment protocols, d. Inquiry goals will have been established and
teaching practice and/or teaching programmes if published in teachers’ Appraisal Connector folders.
required. e. Teachers will make first changes to their teaching
practice, programmes or assessment protocols to
include the PaCT.
Term 2 All teachers
a. All teachers will have attended PLD on PaCT this
a. Continued Professional Development on the Mathematics term and be familiar with the Mathematics PaCT
PaCT from the Elim leadership team. Aspects and Sets for the curriculum levels.
b. Sharing teaching tips and resources on Mathematics with b. At least one PLD session where teachers share their
Junior Years teachers. goals and any teaching tips and resources theyr have
c. Continue to make changes to Mathematics teaching found they could share.
practice, programmes and/or assessment protocols. c. All teachers reflecting on their Mathematics
d. Gather mid year Mathematics assessment data on teaching and student learning and writing regular
students ready for moderation, reflection entries on Appriasal Connector.
d. All teachers to attend moderation meetings to
ensure the PACT is being used correctly to make
52You can also read