A fiber optic-nanophotonic approach to the detection of antibodies and viral particles of - COVID-19 - De Gruyter
←
→
Page content transcription
If your browser does not render page correctly, please read the page content below
Nanophotonics 2021; 10(1): 235–246

Research article

Navid Rajil, Alexei Sokolov, Zhenhuan Yi, Garry Adams, Girish Agarwal, Vsevolod Belousov,
Robert Brick, Kimberly Chapin, Jeffrey Cirillo, Volker Deckert, Sahar Delfan, Shahriar Esmaeili,
Alma Fernández-González, Edward Fry, Zehua Han, Philip Hemmer, George Kattawar,
Moochan Kim, Ming-Che Lee, Chao-Yang Lu, Jon Mogford, Benjamin Neuman, Jian-Wei Pan,
Tao Peng, Vincent Poor, Steven Scully, Yanhua Shih, Szymon Suckewer, Anatoly Svidzinsky,
Aart Verhoef, Dawei Wang, Kai Wang, Lan Yang, Aleksei Zheltikov, Shiyao Zhu, Suhail Zubairy
and Marlan Scully*

A fiber optic–nanophotonic approach to the
detection of antibodies and viral particles of
COVID-19
https://doi.org/10.1515/nanoph-2020-0357                                     to detect anthrax in real-time. A variation on the laser
Received July 1, 2020; accepted August 31, 2020; published online            spectroscopic techniques we developed for the rapid detec-
September 29, 2020
                                                                             tion of anthrax can be applied to detect the Severe Acute
                                                                             Respiratory Syndrome-Corona Virus-2 (SARS-CoV-2 virus). In
Abstract: Dr. Deborah Birx, the White House Coronavirus
                                                                             addition to detecting a single virus, this technique allows us
Task Force coordinator, told NBC News on “Meet the Press”
                                                                             to read its surface protein structure. In particular, we have
that “[T]he U.S. needs a ‘breakthrough’ in coronavirus testing
                                                                             been conducting research based on a variety of quantum
to help screen Americans and get a more accurate picture of
                                                                             optical approaches aimed at improving our ability to detect
the virus’ spread.” We have been involved with biopathogen
                                                                             Corona Virus Disease-2019 (COVID-19) viral infection.
detection since the 2001 anthrax attacks and were the first

                                                                             Neurotechnologies of the Federal Medical Biological Agency, Moscow
The list of coauthors represents only a fraction of the team working on      117997, Russia
the real-time detection of pathogens from anthrax to SARS-CoV-2.             Volker Deckert, Texas A&M University, College Station, TX 77843,
They are the team members most involved in the current COVID-19              USA; Leibniz Institute of Photonic Technology, 07745 Jena, Germany;
research and we thank coeditors Federico Capasso and Dennis                  and Friedrich Schiller University, 07743 Jena, Germany
Couwenberg for the invitation to contribute to this volume honoring          Philip Hemmer, Texas A&M University, College Station, TX 77843,
the COVID-19 workers.                                                        USA; and Zavoisky Physical-Technical Institute, 420029 Kazan, Russia
                                                                             Chao-Yang Lu and Jian-Wei Pan, University of Science and Technology
Navid Rajil, Alexei Sokolov and Zhenhuan Yi: contributed equally to          of China, Hefei, Anhui, 230026, P. R. China
this work.                                                                   Jon Mogford, Texas A&M University System, College Station, TX
                                                                             77840, USA
*Corresponding author: Marlan Scully, Texas A&M University, College          Benjamin Neuman, Texas A&M University, College Station, TX 77843,
Station, TX 77843, USA; Baylor University, Waco, TX 76798, USA; and          USA; and Texas A&M University, Texarkana, TX 75503, USA
Princeton University, Princeton, NJ 08544, USA,                              Vincent Poor, Princeton University, Princeton, NJ 08544, USA
E-mail: scully@tamu.edu                                                      Steven Scully, Collins Aerospace, Richardson, TX 75082, USA
Navid Rajil, Alexei Sokolov, Zhenhuan Yi, Garry Adams, Girish                Yanhua Shih, University of Maryland, Baltimore County, 1000 Hilltop
Agarwal, Robert Brick, Kimberly Chapin, Jeffrey Cirillo, Sahar Delfan,       Circle, Baltimore, MD 21250, USA
Shahriar Esmaeili, Alma Fernández-González, Edward Fry, Zehua Han,           Szymon Suckewer, Texas A&M University, College Station, TX 77843,
George Kattawar, Moochan Kim, Ming-Che Lee, Tao Peng, Anatoly                USA; and Princeton University, Princeton, NJ 08544, USA
Svidzinsky, Aart Verhoef, Kai Wang and Suhail Zubairy, Texas A&M             Dawei Wang and Shiyao Zhu, Zhejiang University, 38 Zheda Rd,
University, College Station, TX 77843, USA. https://orcid.org/0000-          Hangzhou, 310027, P. R. China
0002-9220-4080 (M. Kim)                                                      Lan Yang, Washington University, St. Louis, MO 63130, USA
Vsevolod Belousov, Shemyakin–Ovchinnikov Institute of Bioorganic             Aleksei Zheltikov, Texas A&M University, College Station, TX 77843,
Chemistry, Russian Academy of Sciences, Moscow 117997, Russia;               USA; International Laser Center, Moscow State University, Moscow
Pirogov Russian National Research Medical University, Moscow                 119992, Russia; and Russian Quantum Center, Skolkovo, Moscow
117997, Russia; and Federal Center of Brain Research and                     Region, 143025, Russia

  Open Access. © 2020 Navid Rajil et al., published by De Gruyter.        This work is licensed under the Creative Commons Attribution 4.0 International
License.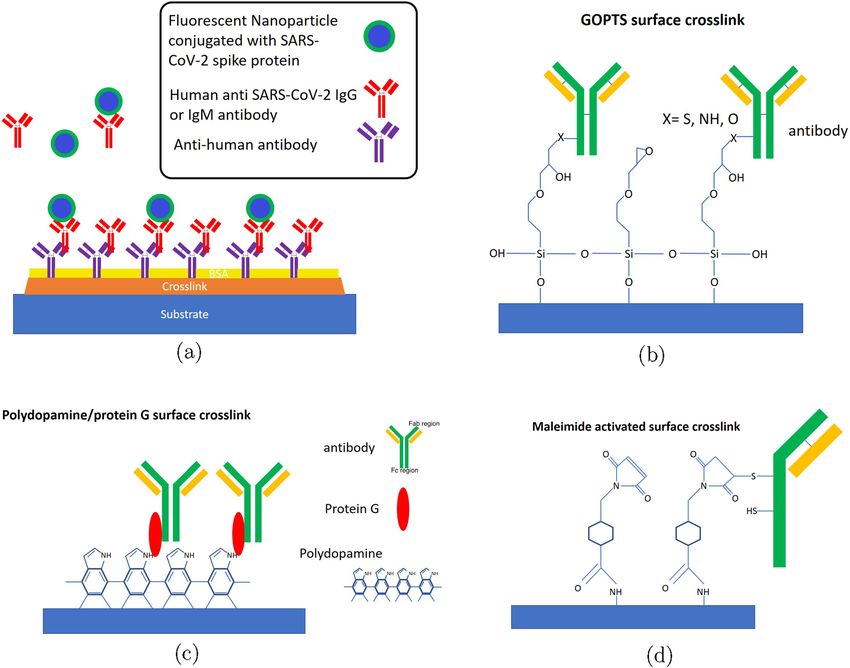
236 N. Rajil et al.: The detection of antibodies and viral particles of COVID-19
Indeed, the detection of a small concentration of antibodies, The present paper focuses on new approaches, build-
after an infection has passed, is a challenging problem. ing on existing work in modern optics and biochemistry,
Likewise, the early detection of disease, even before a and is (hopefully) written in a tutorial fashion in hopes of
detectible antibody population has been established, is very drawing a broader participation from both physical and
important. Our team is researching both aspects of this biological scientists to this important problem.
problem. The paper is written to stimulate the interest of both Figure 1 shows an illustration of virion attachment to
physical and biological scientists in this important problem. It antibodies produced by host immune systems. In the present
is thus written as a combination of tutorial (review) and future paper, we: (1) develop a coherent laser technique, tailored to
work (preview). We join Prof. Federico Capasso and Editor the detection of antibodies in the blood and (2) engineer a
Dennis Couwenberg in expressing our appreciation to all new approach to detect the presence of Severe Acute
those working so heroically on all aspects of the COVID-19 Respiratory Syndrome-Corona Virus-2 (SARS-CoV-2 virus),
problem. And we thank Drs. Capasso and Couwenberg for the causative agent of COVID-19, via a fiber-based reverse-
their invitation to write this paper. transcription polymerase chain reaction (RT-PCR) test.
Central to the broad functionality of the present
Keywords: detection of SAR-CoV-2 virus; hollow-core
approach is an optical platform such as shown in
fibers; laser spectroscopic technique; nanophotonics.
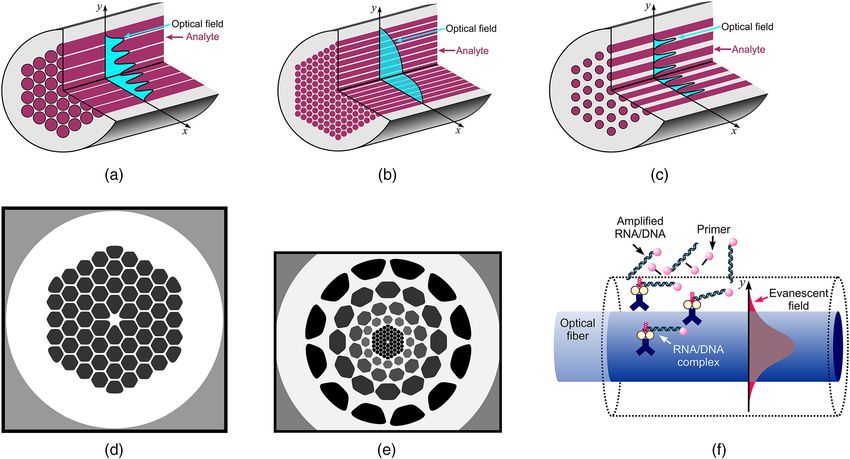
Figure 2a–c. In general, we intend to combine microfluidic,
optical-interrogation, and PCR-/RT-PCR–amplified nucleic
acid identification capabilities. An analyte, such as a blood
1 Introduction sample, can flow through the air holes that run along the
fiber length [3] and thus form a periodic (Figure 2b) or a
As the anthrax attacks and the present pandemic demonstrate, spatially chirped (Figure 2c) photonic lattice within a cy-
improved strategies to detect viral [1] and bacterial pathogens lindrical rod of host glass. The geometry of this lattice
[2] are urgently needed. Recognizing the importance of the along with its pitch, the diameter of air holes (from 1 to
problem, our team has been researching a variety of quantum 50 μm [4]), and the glass-analyte index step define the
optical techniques aimed at improving the detection of the structure of field modes supported by the fiber [5, 6]. When
Corona Virus Disease-2019 (COVID-19) viral infection. coupled into one of its guided modes, an optical field tends
Much, but not all, of our present work follows on our to peak within high-index glass channels (with a notable
earlier research using the laser spectroscopic technique exception of hollow-core photonic crystal fibers. Its
called Coherent anti-Stokes Raman scattering (CARS). In evanescent tails, however, can interact with the analyte
particular, here, we utilize innovative fiber optic platforms (Figure 2a), driving its optical response through a linear [3]
for antibody and virus detection based on a multichannel or nonlinear [7, 8] optical process, thus providing an op-
fiber sensor such as that sketched in Figure 2a–c. tical readout for the detection of viruses and other micro-
organisms in the analyte. With suitable optimization of the
fiber structure, the optical readout can be dramatically
enhanced due to improved spatial overlap between the
optical field and the analyte (Figrue 2a), improving,
sometimes by several orders of magnitudes, the sensitivity
of antibody and/or nucleic acid identification and, hence
as is discussed below, coronavirus detection.
2 Biophotonic SARS-CoV-2
detection schemes
2.1 Fiber-optical antibody tests
Figure 1: The virion (green) with red spikes, gold nanoparticles (gold)
It is our intention that the present approach will result in an
and the antibodies against Severe Acute Respiratory Syndrome-Corona
Virus-2 (SARS-CoV-2) (blue). The virion is approximately 100 nm in
improved antibody test, with increased sensitivity and
diameter, the gold nanoparticles are about 40 nm in diameter, and the reduced false counts. We envision that, due to the
antibodies are about 10 nm in diameter, respectively. improved characteristics at a relatively low production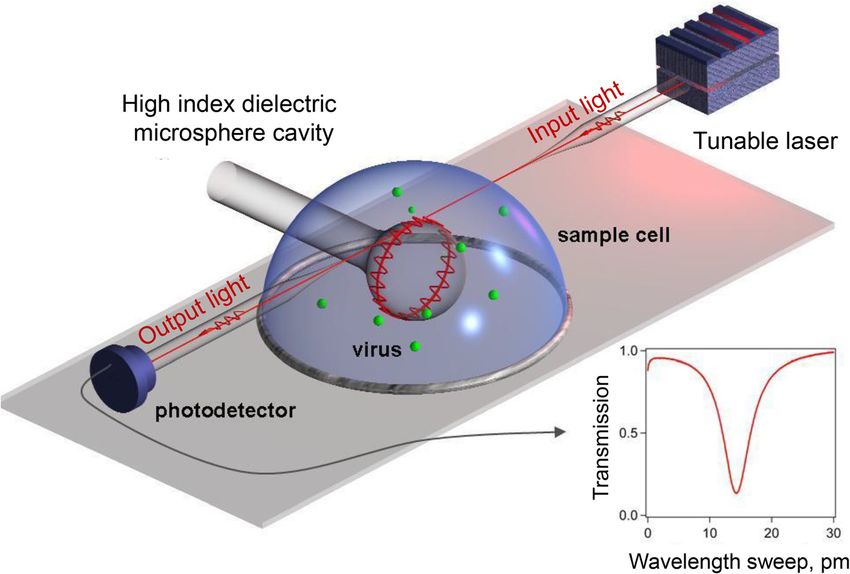
N. Rajil et al.: The detection of antibodies and viral particles of COVID-19         237

Figure 2: Schematics of the multichannel fiber sensor (a–c) and optical fiber structures (d, e) designed for the sensor. Shown in (f) is a fiber
optic fluorometric sensor for the detection of polymerase chain reaction (PCR)–amplified DNA [26].

cost, these tests will become available to a broad popula-                themselves “stuck” to the (properly coated, Section 3)
tion, not limited only to suspected COVID-19 cases. In                    walls. The QDs are now fixed in place and, when driven by
pursuing this, we build upon the existing ideas, based on                 an external laser as in Figure 3, can constitute a lasing
the human IgG and IgM antibody property to bind to                        configuration. Thus, when mirrors are included, the system
SARS-CoV-2–specific proteins, and on the availability of                  will “lase” when the antibody particle number (and
antigens capable of binding the IgG and IgM antibodies.                   therefore the antibody count) increases beyond a certain
We extend prior work by using fluorescent markers                         number.
together with quantum optical techniques such as higher                        The present scheme provides another way to gather
order, e.g., Brown-Twiss, correlations, etc. In general, we               and utilize data. For example, the steady-state photon
employ optical detection configurations that will make                    statistical distribution is given by
sensitive quantitative measurements with relatively low                                     A     A2   1
                                                                                                            n
                                                                                                                     1
levels of antibodies. The proposed “fiber” optical scheme is                     P(n)       !                              ,             (1)
                                                                                            B    BC n + B
                                                                                                         A         A
                                                                                                            F1 ; B       A2
                                                                                                                     + 1 ; BC
sketched below in Figure 3.
     In particular, we shall illustrate our approach by                   where F is the confluent hypergeometric function,
                                                                                     2
concentrating on IgM and IgG antibodies against                           A  2rgγ  is the gain that is directly proportional to the
SARS-CoV-2 in blood as in Figure 3. There, we see blood                   antibody count and C is governed by the cavity quality
mixed with buffer solution containing fluorescent nano-                                        2
                                                                          factor, and B  4gγ2 A where g is the atom-field coupling
particles (FNPs) such as nitrogen vacancy nanodiamonds,                   and γ is the radiative decay rate (11.2 of Ref. [9]).
upconversion nanoparticles or semiconductor quantum                           From Eq. (1), the average number of photons in the
dots (QDs), which have been coated with an antigen pro-                   cavity is given by
tein designed from the surface spike protein of SARS-CoV-
                                                                                                          A A −C
2. In other words, the QDs, thus coated, look like a                                              ⟨n⟩ ≅         ,                          (2a)
                                                                                                          C   B
SARS-CoV-2 virus to the antibodies and are conjugated
(bound) to the antibody as in Figure 3a.                                  and the variance is found from
     The next step involves forcing the antibody-QD fluid
                                                                                                                   A2
through the tube or fiber optics waveguide, where it binds                                         ⟨n2 ⟩ −⟨n⟩2       .                      (2b)
                                                                                                                   BC
with the secondary antibodies (anti-antibody) that are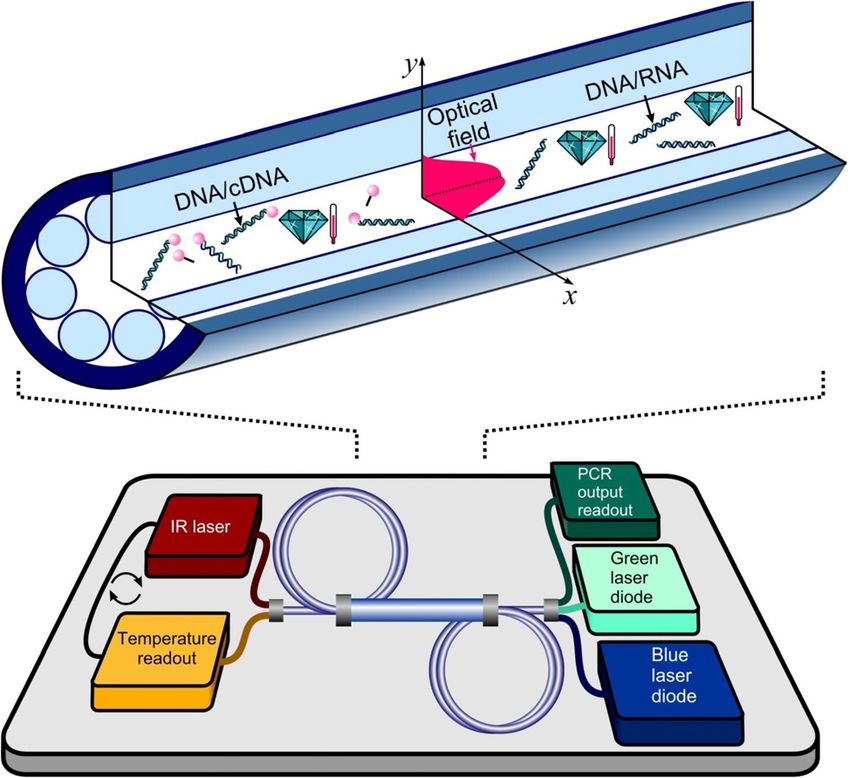
238           N. Rajil et al.: The detection of antibodies and viral particles of COVID-19

                                                                                                Figure 3: (a) Depicts anti-antibody +
                                                                                                antibody-quantum pairs stuck to wall, with
                                                                                                the bound pair configuration shown in (b) and
                                                                                                the Raman level structure shown in (c).

The fiber bundle configuration can be capped with Bragg                                             2π2 d2 γ
                                                                                                N   2 t.                               (6)
reflectors which have a high reflectivity resulting in a                                             3  λ γr
cavity loss rate of C  (c/l)(1 − R), where R is the reflec-
tion coefficient. For a “high Q” configuration with l ≈ 1 cm                 The effect of adding “mirror” shows that (4) is smaller
the loss rate C ≡ ν/Q ≈ 106 – 107 s−1 , where ν is the frequency           than (6) by the factor (1−R). That is to say the treated fiber

of light. Using the fact that the coupling constant g  §ℏ ϵℏν   ,         bundle is more sensitive when the Bragg mirrors are in
                                                              0V
                 2
where V  πd l and radiative spontaneous decay rate                        phase.
γr  §2 ν3 /3πℏϵ0 c3 , we may write A as
                               2
                       g     3              c λ2 γr                        2.2 Using a cavity Quantum
                A  2r                    N      ,               (3)
                       γt   2π 2            l d2 γt                            Electrodynamics (QED) platform for
with antibody number N, wavelength of photons λ, fiber                          enhancing detection for antibodies via
hole radius d, and effective decay rate γt . At threshold                      fluorescence
where A  C , we find the antibody number
                                                                           Biomarkers like green fluorescent proteins are extensively
                         2π2 d2 γ                                          used for detecting tagged biomolecules and antibodies.
                    N    2 t (1 − R).                            (4)
                          3  λ γr                                          Here, we suggest a new platform, where fluorescence
On the other hand, if we have no mirrors then the photon                   detection can be enhanced especially for situations where
                                                                           either the fluorescent yield is low or the density of bio-
flux at z = l will be given by
                                                                           molecules is low. We make use of the well-known Purcell
               d⟨n⟩ 1         3            N λ2 γr                         effect from the field of cavity QED, a field that was hon-
                    A ⟨n⟩                        ⟨n⟩
                dz  c        2π 2          l d2 γt                         ored by the award of the Nobel Prize to S. Haroche. The
                                                                           new platform is sketched in Figure 4, with the test sample
so that
                                                                           in a capillary or hollow-core fiber as indicated in the
                          A                 3    λ2 γ                      figure, i.e., antigen with human IgG (Figure 3b). Anti-
          ⟨n(l)⟩  exp     l⟨n(0)⟩ ≃ 1 +      N 2 r.              (5)    bodies tagged to biomarkers are detected by fluorescence,
                          C                2π 2
                                                 d γt
                                                                           which is enhanced as the system is contained inside a
So to detect one photon beyond the incident photon number                  high quality cavity. Enhancement in fluorescence could be
of ⟨n(0)⟩  1, we have the necessary antibody number                       many times that in the absence of the cavity [10]. The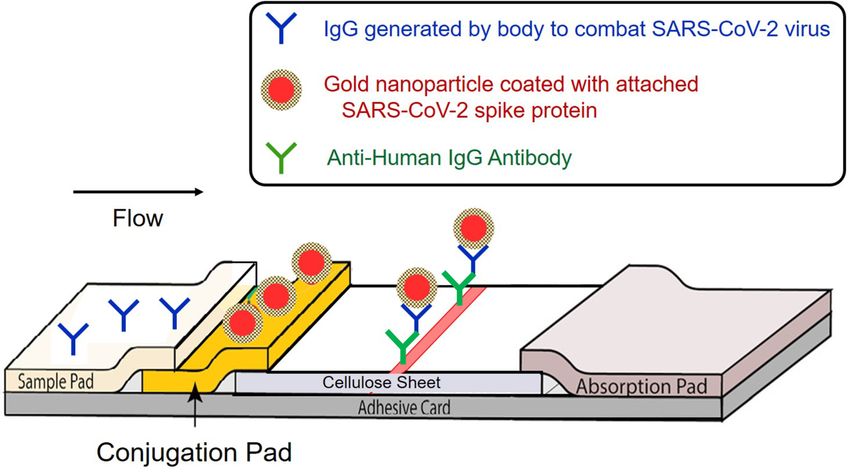
N. Rajil et al.: The detection of antibodies and viral particles of COVID-19        239

result depends on the quality factor Q of the cavity. The          them are the objective (see Appendix B). For example, a
number of photons per second detected outside the cavity           quality factor of Q = 8 × 10⁹ has been measured at
          2
is 2gκ  times the number of excitations inside the cavity        λ = 633 nm in fused silica [11, 12] and Q = 3 × 10¹¹ at λ = 1.5 μm
and hence, in technical terms, the enhancement factor is           for crystalline CaF2 [13].
3λ3 Q
4π2 V , where V is the volume of the cavity and λ is the                Since the evanescent field of WGMs protrudes outside
wavelength of transition. In other words, fluorescence              the resonator volume, such modes are affected by the
probability in the direction of the cavity axis (thin red          environment in which the resonator is placed. The envi-
arrow labeled as detection Figure 4) is given by the factor        ronment shifts the resonant frequencies. Because whis-
  3λ3 Q
4π  2 V γ r . For N active molecules in the cavity the net
                                                                   pering gallery resonators can have extremely large Q-
fluorescence photon flux I along the cavity axis will be             factors (small linewidth) a shift in their resonant fre-
                            3λ3 QN                                 quencies is easily measured. This means that they act as
                       I   2 γr                          (7)    very sensitive sensors which can be affected by chemical
                             4π V
                                                                   (or bio) composition of their surroundings.
and thus                                                                Figure 5 shows a possible scheme for measuring the
                              4π2 V                                presence of viruses or antibodies (with single particle res-
                        N            I.                    (8)    olution [14]) that bind to the surface of a glass microsphere.
                             3λ3 γr Q
                                                                   Coupling is achieved by a tapered optical fiber, and a
Note that the quality factor, Q, of the cavity is inversely        tunable near Infrared laser that sweeps across different
proportional to the cavity leakage, which is proportional          wavelengths to determine the resonance frequencies of the
to (1−R), where R is the reflection coefficient of the mirror.       resonator (on-resonance transmission of the laser beam
It is therefore counter intuitive (but true) that the signal is    through the optical fiber drops), which directly depend on
enhanced. The enhancement of the detected signal                   the number of bound antibodies.
originates from the Purcell effect. The measurement of                  The use of light transmission is a very sensitive tool for
the fluorescence using the scheme of Figure 4 can be                the detection of antibodies and can work even without the
highly beneficial for the detection of a small number of            use of labels [15–20]. This technique has the capability of
IgG molecules attached to antigen-conjugated FNP. In               detecting a single nanoparticle of about 20 nm as demon-
addition, we can improve the detection of IgG by                   strated by Lan Yang et al. [15, 21]. The transmitted spectra
reducing the volume of the cavity and, thus, micron size           could be considerably shifted due to the interaction with the
cavities would be recommended.                                     WGM’s. The shifts will be proportional to the number of
      Spherical dielectric microresonators supporting whis-        active molecules on the surface of microresonator.
pering gallery modes (WGMs) (see Figure 5) could be an
important variation of the above platform. WGMs are res-
onances of a wave field that are confined inside a cavity            2.3 Photonic PCR for SARS-CoV-2 detection
with smooth edges. They correspond to standing waves in
the cavity. Electromagnetic WGMs with ultra-high Q fac-            In this subsection, we propose a photonic platform for real-
tors, low mode volumes, and small resonators supporting            time polymerase chain reaction (qPCR) and reverse-

                                                                                            Figure 4: Excitation in one-sided cavity. The
                                                                                            green arrows show the excitation light. The
                                                                                            red double-arrows show the fluorescence
                                                                                            from quantum dots inside the capillary
                                                                                            tube. The red arrow on the right shows the
                                                                                            output of the cavity which is collected by the
                                                                                            detector. Details of the test capillary inside
                                                                                            the cavity are shown in Figure 3.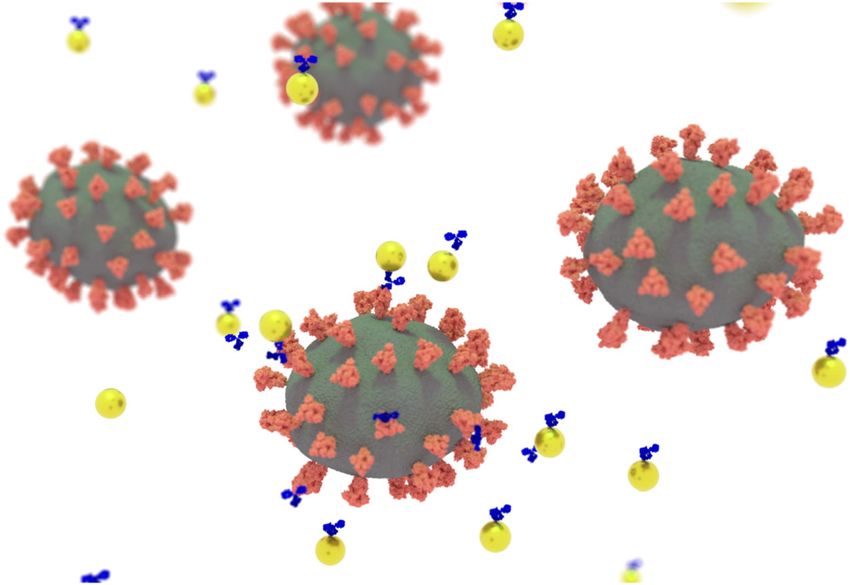
240         N. Rajil et al.: The detection of antibodies and viral particles of COVID-19

                                                                                                 Figure 5: Measuring the presence of a virus
                                                                                                 using a whispering gallery resonator. As
                                                                                                 virus molecules bind to the surface, the
                                                                                                 resonant wavelength position shifts, which
                                                                                                 is measured by the photodetector.
                                                                                                 Adapted from F. Vollmer et al. “Single virus
                                                                                                 detection from the reactive shift of a
                                                                                                 whispering-gallery mode” ©2008 by The
                                                                                                 National Academy of Sciences of the USA
                                                                                                 [14].

transcription qPCR (qRT-PCR) that integrates a rapid-cycle               as saliva) is first converted into complementary DNA
fiber optic PCR chamber with feedback-controlled laser                   (cDNA) using reverse transcriptase and deoxynucleoside
heating and online fluorometric detection of PCR products                triphosphates (dNTPs) [32]. The cDNA produced through
[22–24] (Refer to Appendix A for definition of PCR, qPCR,                 this process is then used as a template for exponential
RT-PCR). Central to this platform is a suitably tailored optical         amplification via PCR.
fiber, whose hollow core provides accommodation for all the                   Our photonic platform (Figure 6) is designed to
PCR components and all the steps of the PCR cycles [25, 26].             accommodate all of the steps necessary for qPCR/qRT-
Infrared laser radiation is used to provide rapid heating of             PCR—denaturation, annealing, and extension. At the
the fiber optic PCR chamber up to the DNA melting point.                  denaturation step, the fiber optic thermal cycler is heated,
The process of laser-induced heating is monitored in real-               using IR laser radiation, up to 94–98 °C, leading to
time by means of all-optical thermometry based on color                  denaturation of DNA/cDNA by breaking the hydrogen
centers of diamond nanoparticles, after the annealing and                bonds between its bases, thus producing two single-
extension steps have been performed at lower temperatures
as required, the PCR cycles are repeated, providing an
exponential amplification of targeted DNA sequences.
This process is monitored in real-time using DNA-bound
fluorescent reporters driven by visible laser radiation,
which is coupled to the hollow fiber core. With careful
optimization of laser-induced heating and heat-removal
geometry, the photonic version of PCR can radically
reduce the PCR cycle duration relative to standard PCR
machines, enabling faster testing as a key strategy to
mitigate spread of infectious disease.
     Our photonic PCR will enable rapid (i.e., as fast as 10
PCR cycles, each cycle being 1 min as described in a study
by Li et al. [25]) and highly specific early detection of
SARS-CoV-2 soon after infection—in most cases, even
before the onset of disease’s symptoms [27–31] (typically
10–15 days), providing much-needed lead time for early
treatment and disease spread prevention. When designed
specifically for SARS-CoV-2 detection, photonic PCR would
                                                                         Figure 6: A photonic credit-card-size platform for rapid-cycle real-
be run in the qRT-PCR mode. In this mode, a small amount                 time polymerase chain reaction (qPCR) and reverse-transcription
of SARS-CoV-2 RNA present in a biomaterial sample (such                  qPCR.
N. Rajil et al.: The detection of antibodies and viral particles of COVID-19   241

stranded DNA molecules. At the annealing step, the                   devices [34, 35], proteins A and G are used to attach the
temperature is lowered to 50–65 °C, allowing left and right          antibody to a substrate that later can be used to detect
primers to base pair to their complementary sequences,               specific viruses using optical techniques or the naked eye.
thus bracketing the DNA region to be amplified. At the                Using polydopamine and protein G solution [35], any sub-
third step, the temperature of the fiber optic thermal                strate can be functionalized such that the antibody can
cycler is maintained in a typical range of 72–80 °C, as the          attach to the substrate using its Fc region. The protein-
DNA polymerase synthesizes a new DNA strand comple-                  coated substrate (see Figure 7c), in our case, the hollow-core
mentary to the targeted DNA/cDNA strand by assembling                optical fiber, is primed to attach to the desired antihuman
free dNTPs from the reaction mixture to build new strands            antibody using the Fc region (base, see Figure 7c). This
complementary to the template in the 5′-to-3′ direction.             strategy will allow will allow the Fab region of the antibody
Experimental and theoretical studies of photonic PCR                 to be available to interact with the target human antibody (in
suggest that a PCR master mix of volume Φ will require a             this case, anti-SARS-CoV-2 IgG and IgM).
nuclease-free water mixture of 0.005Φ of Taq DNA poly-                    In addition, using a fluorescent molecule or, even
merase, 0.1Φ of 10× standard Taq reaction buffer, 0.02Φ              better, an FNP conjugated to the spike protein of
of 10 mM dNTPs, 0.02Φ of 10 μM forward primer, and                   SARS-CoV-2, we can tag the specific antibodies against
0.02Φ of 10 μM backward primer.                                      SARS-CoV-2. In this manner, we will be able to see the
                                                                     signal from very few FNPs or fluorescent molecules. We
                                                                     promote the use of FNPs because they do not bleach under
                                                                     excitation in contrast to fluorescent dyes. This will give us
3 Bioconjugate techniques                                            the opportunity to increase the acquisition time for the
                                                                     Charge-Coupled Device (CCD) camera and, as a result, the
This section addresses biological and biochemical                    excitation time. Hence, we will be able to observe very low
terms for readers from other fields, as well as experi-              amounts of FNPs in a few minutes.
mentalist who intend to implement these ideas as prac-                    A variant of these methods could be coating the optical
tical apparatus.                                                     fiber with the spike protein from SARS-CoV-2. The sample
     An essential component of the devices we discussed in           will contain anti-SARS-CoV-2 IgGs and IgMs tagged with
Section 2 is the preparation of surfaces that are conjugated to      FNPs conjugated to antihuman antibodies. As the sample
bio molecules that we want to detect. Many techniques have           is introduced into the optical fiber, the anti-SARS-CoV-2
been discussed in the literature and compiled in the classic         antibodies will attach to a substrate. Based on the same
book, Bioconjugate Techniques [33]. Since we are working             principle, we can see the signal from FNPs that are attached
with various optical fibers, it is natural for us to work with        to the fiber through linkage between the spike protein and
silane coupling agents, while other generic agents, e.g.,            antispike protein antibody tagged with FNPs conjugated
protein A, G, A/G can be considered (see below).                     with antihuman antibodies. Similar assays have been used
     Silanization is the process of adding silane groups             to detect water pollutants [36].
(R3Si–) to a surface. The most useful compounds would be                  Another method that can be used to attach antihuman
those containing a functional organic component, e.g.,               antibodies to the substrate or optical fiber is to use sulf-
3-glycid-oxy-propyl-trimethoxy-silane           (GOPTS)       and    hydryl (–SH) groups that are naturally existing or added to
3-glycidoxypropyltriethoxysilane that are very commonly              the antihuman antibodies. In this method, the surface is
used in fiber treatment. These compounds can be used to              activated by maleimide. Maleimide is a popular reagent for
conjugate thiol-, amine-, or hydroxyl-containing ligands,            crosslinking sulfhydryl (–SH) groups, and it is used to form
depending on the pH of the reaction [33]. GOPTS is often             covalent links between the cysteine residues of proteins
used in bioconjugate applications, forming a polymer                 [37, 38]. Maleimide surfaces are obtained by amino-
matrix linked by –Si-O-Si– bonds and binding to glass                silanizing a surface with primary amines (–NH2) and
surfaces joining Si-O– bonds. Biomolecules, antibodies in            reacting them with the heterobifunctional corsslinker,
particular in the context of this paper, can bond to fiber            Sulfo-SMCC [39]. The crosslinker sulfo-SMCC is added in
surfaces after reactions with the epoxy group in GOPTS.              order to activate the amino-modified surface. Finally, the
     Another method for attaching antihuman antibodies to            sulfhydryl (–SH) groups on the antibody can attach to this
the surface of an optical fiber optic is the use of proteins A, G,   substrate by covalent bonds.
and L which are widely used in antibody purification pro-                 The adaptability of our optic fiber approach to existing
cedures, where a specific antibody needs to be separated             technologies will make the mass production of this system
from the solution and purified. In some optical detection            relatively straight forward and affordable. However,
242 N. Rajil et al.: The detection of antibodies and viral particles of COVID-19
Figure 7: Schematic of substrate assay for detecting human anti-Severe Acute Respiratory Syndrome-Corona Virus-2 (SARS-CoV-2) IgG and
IgM. The substrate is the inner surface of a hollow-core fiber optic. The cross-links we can use are 3-glycid-oxy-propyl-trimethoxy-silane
(GOPTS), protein A or polydopamine/protein G, or amine-maleimide. The Bovine Serum Albumin (BSA) layer is used to block any other active
part of the substrate. The human IgG and IgM bind to antihuman antibody by their Fc region, while the Fab region binds to spike proteins
immobilized on the surface of a FNP.
depending on the type of test (PCR, antibody detection, etc.) Figure 8. In this type of setup, a drop of blood mixed with
one may need to choose the proper fiber optic setup and a buffer solution is placed on the sample pad and wicked
proper sample preparation. For instance, if original blood by capillary action into the conjugation pad which con-
samples need to be tested, the hollow-core fiber optics tains gold nanoparticles coated with spiked protein
chosen must have hollow regions large enough to accom- from the SARS-CoV-2. In such a case, the spike protein-
modate for large blood cells. Perhaps, for certain detection conjugated gold nanoparticle looks to an antibody like
applications such as antibodies or other proteins, one will a virus and the antibody binds to the coated AuNP.
need to filter and separate blood cells from the sample and This bound, conjugated, gold particle antibody, e.g.,
only use blood plasma (or serum). This will reduce the SARS-CoV-2–specific IgG, is then wicked downstream to
interference caused by large objects such as red and white a strip which contains anti-antibodies (i.e., secondary
blood cells. This filtration can be integrated into the system antibodies) which will now bind to the SARS-CoV-2
like the sample pads in lateral flow assays (LFAs), which antibody-gold complex. When there are enough gold
filter large particles and cells. Sample preparation can also particles, the line looks red, and this signals the presence
be done before the test to promote the best result. of COVID-19 disease. If there are no antibodies, the gold is
swept downstream to the collection pad and a negative
result (no infection) is recorded.
4 Discussion The COVID-19 “test setup” discussed in Section 2.1 has
points in common with LFA and points which are quite
One popular configuration for a COVID-19 test is the gold different. For example, the fiber optic platform of Figure 2
nanoparticle (AuNP) LFA configuration as shown in replaces the wicking membrane of Figure 8. The gold NPsN. Rajil et al.: The detection of antibodies and viral particles of COVID-19 243
Figure 8: Schematic illustration for the
wicking membrane with gold nanoparticle
(NP) coated with Severe Acute Respiratory
Syndrome-Corona Virus-2 (SARS-CoV-2)
(see Table A1) spike protein. When the
patient’s blood with Corona Virus Disease-
2019 (COVID-19) IgG (see Table A1) is flowed,
assemblages of IgG and gold NP will be
attached to the anti-antibody, and it can
produce fluorescent light.
are replaced by the fluorescent NPs as in Figure 3. The fiber Acknowledgments: M. O. S. thanks Chancellor John Sharp
optical scheme is easily enclosed within a fiber optic cavity for many stimulating discussions and he thanks the Robert
as in Figure 3a. A. Welch Foundation, the Air Force Office of Scientific
While antibody sensors provide a measure of the im- Research, the National Science Foundation (NSF), the Of-
mune response to the virus, PCR is the technology of choice fice of Naval Research, and King Abdulaziz City for Science
for early diagnostics, before any virus-specific antibodies and Technology (KACST) for support. The authors thank
can be detected in the bloodstream. Real-time state-of-the- Jane Pryor, and Maria Bermudez Cruz for helpful discus-
art technique, qRT-PCR, which relies on optically excited sions. N. R., S. D., C. L., S. E., M. L. are supported by the
fluorescent reporters, has become a gold standard in virus Herman F. Heep and Minnie Belle Heep Texas A&M Uni-
detection. The greatest downside of this well-established versity Endowed Fund held/administered by the Texas
technology is the time it takes to run a test, limited by the A&M Foundation. J. D. C. is supported in part from funds
PCR thermal cycle duration; it usually takes time to uni- provided by the Texas A&M University System and Na-
formly and precisely heat the sample volume and then cool tional Institutes of Health Grant AI104960. P. H. acknowl-
it down and then heat again (1–5 days to complete tradi- edges financial support from the Government of the
tional PCR and 45 min to complete qPCR [40]). The number Russian Federation (Mega-grant No. 14.W03.31.0028). G. S.
of these cycles determines the DNA multiplication factor. A. thanks the Robert A. Welch Foundation grant no A-1943
With our fiber-based approach, we expect to have a sig- and the AFOSR award No. FA9550-18-1-0141 for support. A.
nificant scale-down of the reaction volume, and a corre- S. acknowledges the support from the Robert A. Welch
sponding reduction of characteristic cooling and heating Foundation grant no A-1547. A. Z. acknowledges support
time intervals. As a result, we expect to reduce the total from the Welch Foundation (Grant No. A-1801-20180324). V.
time required to obtain test outcomes, to about 10 min. B. and A. Z. acknowledge support from the Russian Foun-
Within our approach, the heating and the temperature dation for Basic Research (project Nos. 17-00-00212 and 17-
control will be conveniently provided through fiber- 00-00214). V. D. acknowledges support from German
coupled laser-based methods. Naturally, our photonic Research Foundation (CRC 1375 - NOA - C2). V.P. acknowl-
qRT-PCR platform will incorporate an online fluorometric edges the support of the U.S. Army Research Office under
detection of PCR products. With careful optimization, this Grant W911NF-20-1-0204, the U.S. National Science Foun-
approach will lead to a greatly improved sensitivity, while dation under RAPID Grant IIS-2026982, and a grant from the
reducing the test turnaround times, relative to standard C3.ai Digital Transformation Institute.
PCR systems. In addition, the fiber optic approach, com- Author contribution: All the authors have accepted
bined with microfluidics engineered for sample and re- responsibility for the entire content of this submitted
agent delivery, will allow compact design and scalability, manuscript and approved submission.
resulting in affordable mass production and point-of-care Research funding: The research was supported by the
implementation. Early detection of SARS-CoV-2 virions, Robert A. Welch Foundation (Grant No. A-1943, A-1547,
enabled by the photonic fiber platform for qRT-PCR, will and A-1261), the Air Force Office of Scientific Research
provide much-needed lead time for early treatment and (Award No. FA9550-20-1-0366 DEF), National Science
prevention of disease spread. Foundation (Grant No. PHY-2013771), Office of Naval244 N. Rajil et al.: The detection of antibodies and viral particles of COVID-19
Research (Grant No. N00014-20-1-2184), Texas A&M Appendix B
Foundation, National Institutes of Health (Grant No.
AI104960), and the Government of the Russian Federation Whispering gallery modes
(14.W03.31.0028). This research is also supported by King Let us consider a dielectric cylinder with a refractive index
Abdulaziz City for Science and Technology (KACST). n and radius R. Maxwell’s equation for the dielectric
Conflict of interest statement: The authors declare no medium with inhomogeneous refractive index n(r) reads
conflicts of interest regarding this article.
1 ∂2 2
∇2 E − ∇(div E) − n (r)E 0. (9)
c2 ∂t 2
Appendix A We look for normal modes of the field in the form
Table A: Summary of abbreviations. E(r) E(r)e−iωt+imϕ z , (10)
CARS Coherent anti-Stokes Raman scattering, a where r, ϕ, and z are cylindrical coordinates, z is a unit
technique for using multiple photons for vector along the cylinder’s axis z, and m is the angular
measuring molecular vibration with much quantum number. The mode function (10) is transverse,
greater sensitivity than ordinary (sponta- that is div (E) = 0. In addition, the mode function (10) is
neous) Raman emissions
independent of z, that is electromagnetic wave does not
COVID- The corona virus disease that appeared in late
propagate along the axis of the cylinder.
dNTP Dinucleoside triphosphate, a precursor mole- The Maxwell’s Eq. (9) yields that radial part of the mode
cule for DNA function (10) inside the cylinder (r < R) is given by the
GOPTS (-Glycidyloxypropyl)trimethoxysilane is used cylindrical Bessel function
as a coupling agent for many molecules with
glass or mineral surfaces ωn
E(r) C 1 J m r , (11)
IgG The most abundant immunoglobulin (anti- c
body) in human blood; SARS-CoV--specific
IgG is made by B-cells of the immune system and by the Hankel function of the first kind outside the
following detection of SARS-CoV-; attaches cylinder (r > R)
to the virus spike protein ω
IgM The first immunoglobulin (antibody) to form E(r) C 2 H (1)
m r . (12)
c
following detection of an antigen by the
human immune system; short-lived relative Solution outside the cylinder describes an outgoing
to IgG cylindrical wave, and at r ≫ R the asymptotic of the electric
LF TAMRA (Figure f) A fluorescent oligonucleotide primer molecule
field is
in the DNA polymerase system
NV diamond Nanosize diamond crystals containing defects 1
E(t, r) ∼ √ eiω(c−t)+imϕ .
r
in the form of a vacant space next to a ni- r
trogen atom; Such structures fluoresce
upon impact of a laser beam of specified The outgoing cylindrical wave carries energy out of the
wavelength. system and the modes decay with time. The decay rate Γ is
PCR/qPCR Polymerase chain reaction, the process of
given by the imaginary part of the mode frequency
making new copies of an original sample of
DNA (q indicates the quantitative version of Γ −Im(ω).
PCR)
RT-PCR/qRT-PCR Quantitative reverse transcriptase PCR, the The normal mode frequencies can be found by imposing
process of using the enzyme, reverse tran- the boundary conditions at the cylinder surface, namely,
scriptase, to read a molecule of RNA (or a
E(r) and ∂E(r)/∂r must be continuous at r = R. This gives a
fragment, thereof) to form the complimen-
tary DNA
transcendental characteristic equation for ω
SARS-CoV- Severe Acute Respiratory Syndrome-Corona
Virus-, The causative viral agent of
J m ωn R H (1)′ ω
m c R
n c
, (13)
COVID- J m ωn
c
R H (1) ω
m c R
Taq DNA polymerase A thermal-stable DNA polymerase (enzyme)
Sulfo-SMCC A protein containing an amine-sulfo-NSH-ester where the prime denotes differentiation with respect to the
on one end and melamide on the other. The argument of the Bessel function.
former increases water solubility; the latter
For fixed m, Eq. (13) has an infinite number of
reacts with SH groups.
solutions which are labeled by the radial quantumN. Rajil et al.: The detection of antibodies and viral particles of COVID-19 245
Figure 9: Normal mode frequencies (a) and
their decay rates Γ (b) as a function of the
angular quantum number m for the radial
quantum number l = 1, 2, 3, 4, and 5,
obtained by numerical solution of Eq. (13)
with n = 1.4.
number l = 1, 2, 3, …. The radial quantum number l [3] S. O. Konorov, A. M. Zheltikov, and M. Scalora, “Photonic-crystal
determines the number of field oscillations inside the fiber as a multifunctional optical sensor and sample collector,”
Opt. Express, vol. 13, pp. 3454–3459, 2005.
cylinder. In Figure 9, we plot the normal mode
[4] I. A. Bufetov, A. F. Kosolapov, A. D. Pryamikov, et al., “Revolver
frequencies (a) and their decay rates (b) as functions of hollow core optical fibers,” Fibers, vol. 6, p. 39, 2018.
the angular quantum number m for l = 1, 2, 3, 4, and 5. In [5] P. St and J. Russell, “Photonic crystal fibers,” Science, vol. 299,
these calculations, we assume that cylinder’s refractive pp. 358–362, 2003.
index is n = 1.4. The vertical axis in Figure 9b has a [6] A. M. Zheltikov, “Holey fibers,” Phys. Usp., vol. 43, pp. 1125–1136,
2000.
logarithmic scale.
[7] A. B. Fedotov, S. O. Konorov, V. P. Mitrokhin,
Figure 9b shows that the decay rate of the modes with
E. E. Serebryannikov, and A. M. Zheltikov, “Coherent anti-Stokes
large m is exponentially small. The decay rate of the mode Raman scattering in isolated air-guided modes of a hollow-core
is smallest for l = 1. The modes with l = 1 and large m are photonic-crystal fiber,” Phys. Rev. A, vol. 70, p. 045802, 2004.
known as the WGMs. They are a wave analog to a ray [8] A. M. Zheltikov, “Nonlinear optics of microstructure fibers,”
reflecting m times off the edge of the cavity at a grazing Phys. Usp., vol. 47, pp. 69–98, 2004.
[9] M. Scully and S. Zubairy, Quantum Optics, Cambridge,
angle by total internal reflection forming a standing wave.
Cambridge University Press, 1996, https://doi.org/10.1017/
For large m, the quality factor, Q, of the dielectric CBO9780511813993.
microresonators could be only limited by the intrinsic [10] G. S. Agarwal, Quantum Optics, Cambridge, Cambridge
material absorption. A typical value of Q for such University Press, 2013, p. 175, https://doi.org/10.1017/
microresonators is of the order of 108. CBO9781139035170.
[11] K. J. Vahala, “Optical microcavities,” Nature, vol. 424,
High Q implies a narrow resonance width Δω = ω/Q or
pp. 839–846, 2003.
Δλ = λ/Q. For example, if the resonance wavelength is [12] M. L. Gorodetsky, A. A. Savchenkov, and V. S. Ilchenko, “Ultimate
λ = 1 μm then the width of the resonance is about 10 fm. Q of optical microsphere resonators,” Opt. Lett., vol. 21,
Such small value of the resonance width allows us to pp. 453–455, 1996.
measure the resonance frequency shift produced by a [13] A. A. Savchenkov, A. B. Matsko, V. S. Ilchenko, and L. Maleki,
“Optical resonators with ten million finesse,” Opt. Express, vol.
single virus molecule attached to the surface of the
15, pp. 6768–6773, 2007.
microresonator. As molecules bind to the surface, the [14] F. Vollmer, S. Arnold, and D. Keng, “Single virus detection from
resonant wavelength position, λ, jumps, creating steps in the reactive shift of a whispering-gallery mode,” Proc. Natl.
the time dependence λ(t). Such steps have been observed, Acad. Sci. U. S. A., vol. 105, no. 52, pp. 20701–20704, 30 Dec.
e.g., in the experiment of Armani et al. with interleukin-2 2008.
[15] J. Zhu, S. K. Ozdemir, Y. Xiao, et al., “On-chip single
molecules [41].
nanoparticle detection and sizing by mode- splitting in an
ultra-high-Q microresonator,” Nat. Photonics, vol. 4, p. 46,
2010.
References [16] F. Giovanardi, A. Cucinotta, A. Rozzi, et al., “Hollow core
inhibited coupling fibers for biological optical sensing,”
[1] J. S. Ellis and M. C. Zambon, “Molecular diagnosis of influenza,” J. Lightwave Technol., vol. 37, no. 11, 1 Jun. 12019, https://doi.
Rev. Med. Virol., vol. 12, pp. 375–389, 2002. org/10.1109/JLT.2019.2892077.
[2] M. O. Scully, G. W. Kattawar, R. P. Lucht, et al., “FAST CARS: [17] V. Ahsani, F. Ahmed, M. B. G. Jun, and C. Bradley, “Tapered fiber-
engineering a laser spectroscopic technique for rapid optic Mach-Zehnder interferometer for ultra-high sensitivity
identification of bacterial spores,” Proc. Natl. Acad. Sci. U. S. A., measurement of refractive index,” Sensors, vol. 19, p. 1652,
vol. 99, no. 17, pp. 10994–11001, 2002. 2019.246 N. Rajil et al.: The detection of antibodies and viral particles of COVID-19
[18] Y. Liu, P. Hering, and M. O. Scully, “An integrated optical sensor [30] T. Q. M. Le, T. Takemura, M. L. Moi, et al., “Severe acute
for measuring glucose concentration,” Appl. Phys., vol. B54, respiratory syndrome coronavirus 2 shedding by travelers,
pp. 18–23, 1992. Vietnam, 2020,” Emerg. Infect. Dis., p. 26, 2020, https://doi.
[19] J. L. Dominguez-Juarez, G. Kozyreff, J. Martorell, “Whispering gallery org/10.3201/eid2607.200591.
microresonators for second harmonic light generation from a low [31] L. Zou, F. Ruan, M. Huang, et al., “SARS-CoV-2 viral load in upper
number of small molecules”, Nat. Commun., vol. 2, 2011, Art no. 254. respiratory specimens of infected patients,” N. Engl. J. Med., vol.
https://doi.org/10.1038/ncomms1253. 382, pp. 1177–1179, 2020.
[20] R. Gao, D. Lu, M. Zhang, and Z. Qi, “Optofluidic immunosensor [32] E. A. Bruce, S. Tighe, J. J. Hoffman, et al., “RT-qPCR detection of
based on resonant wavelength shift of a hollow core fiber for Sars-Cov-2 RNA from patient nasopharyngeal swab using Qiagen
ultratrace detection of carcinogenic benzo[a]pyrene,” ACS Rneasy kits or directly via omission of an RNA extraction step”,
Photonics, vol. 5, pp. 1273–1280, 2018. 2020, bioRxiv 2020.03.20.001008, https://doi.org/10.1101/
[21] S. Dutta Gupta and G. S. Agarwal, “Strong coupling cavity 2020.03.20.001008.
physics in microspheres with whispering gallery modes,” Opt. [33] G. T. Hermanson, Bioconjugate Techniques, London, Academic
Commun., vol. 115, p. 597, 1995. Press, 2013, https://doi.org/10.1016/C2009-0-64240-9.
[22] I. V. Fedotov, S. Blakley, E. E. Serebryannikov, et al., “Fiber- [34] A. A. Yanik, M. Huang, O. Kamohara, et al., “An optofluidic
based thermometry using optically detected magnetic nanoplasmonic biosensor for direct detection of live viruses from
resonance,” Appl. Phys. Lett., vol. 105, p. 261109, 2014. biological media,” Nano Lett., vol. 10, no. 12, pp. 4962–4969,
[23] I. V. Fedotov, L. V. Doronina-Amitonova, D. A. Sidorov-Biryukov, 2010.
et al., “Fiber-optic magnetic-field imaging,” Opt. Lett., vol. 39, [35] J. Moon, J. Byun, H. Kim, et al., “Surface-independent and
pp. 6954–6957, 2014. oriented immobilization of antibody via one-step
[24] S. Blakley, X. Liu, I. Fedotov, et al., “Fiber-optic quantum polydopamine/protein G coating: application to influenza virus
thermometry with germanium-vacancy centers in diamond,” ACS immunoassay,” Macromol. Biosci., vol. 19, p. 1800486, 2019.
Photonics, vol. 6, pp. 1690–1693, 2019. [36] A. Hlaváček, Z. Farka, M. Hübner, et al., “Competitive
[25] X. Li, L. V. Nguyen, K. Hill, et al., “Picoliter real-time quantitative upconversion-linked immunosorbent assay for the sensitive
polymerase chain reaction (qPCR) in an all-fiber system,” in Asia detection of diclofenac,” Anal. Chem., vol. 88, no. 11,
Communications and Photonics Conference (ACPC) 2019, OSA pp. 6011–6017, 2016.
Technical Digest, Optical Society of America, 2019. paper S4G.5. [37] http://tools.thermofisher.com/content/sfs/brochures/
[26] J. M. Mauro, L. K. Cao, L. M. Kondracki, S. E. Walz, and TR0005-Attach-Ab-glass.pdf.
J. R. Campbell, “Fiber-optic fluorometric sensing of polymerase [38] D. Kim and A. E. Herr, “Protein immobilization techniques for
chain reaction-amplified DNA using an immobilized DNA capture microfluidic assays,” Biomicrofluidics, vol. 7, no. 4, p. 041501,
protein,” Anal. Biochem., vol. 235, pp. 61–72, 1996. Jul. 2013.
[27] M. M. Arons, K. M. Hatfield, S. C. Reddy, et al., “Presymptomatic [39] A. Sen, “Quantification of cell attachment on different
SARS-CoV-2 infections and transmission in a skilled nursing materials as candidate electrodes for measurement of quantal
facility,” N. Engl. J. Med., 2020, https://doi.org/10.1056/ exocytosis,” PhD thesis, https://doi.org/10.32469/10355/
NEJMoa2008457, Epub ahead of print. 5722.
[28] S. Hoehl, H. Rabenau, A. Berger, et al., “Evidence of SARS-CoV-2 [40] M. J. Espy, J. R. Uhl, L. M. Sloan, et al., “Real-time PCR in clinical
infection in returning travelers from Wuhan, China,” N. Eng. J. microbiology: application for routine laboratory testing,” Clin.
Med., vol. 283, pp. 1278–1280, 2020. Microbiol. Rev., vol. 19, no. 1, pp. 165–256, Jan. 2006.
[29] K. Q. Kam, C. F. Yung, L. Cui, et al., “A well infant with coronavirus [41] A. M. Armani, R. P. Kulkarni, S. E. Fraser, R. C. Flagan, and
disease 2019 with high viral load,” Clin. Infect. Dis., 2020, K. J. Vahala, “Label-free, single-molecule detection with optical
https://doi.org/10.1093/cid/ciaa201. microcavities,” Science, vol. 317, p. 783, 2007.You can also read


