Partial unlock caseload management for COVID-19 can save 1-2 million lives worldwide - Preprints.org
←
→
Page content transcription
If your browser does not render page correctly, please read the page content below
Preprints (www.preprints.org) | NOT PEER-REVIEWED | Posted: 15 April 2020                  doi:10.20944/preprints202004.0239.v1

       Partial unlock caseload management for
       COVID-19 can save 1-2 million lives worldwide

       Robert L. Shuler, Theodore Koukouvitis

       April 14, 2020 (preprint)
       (Affiliation): Shuler Research
       Email: robert@shulerresearch.org, theodore@koukouvitis.com

       Abstract
            This paper analyzes the stability and usefulness of a human-in-the-loop caseload management method for
       COVID-19. This can control the balance between medical resource utilization and economic shutdown duration
       across significant scenario variation. It reduce the total cases by controlling the rate of spreading as groups cross
       the herd immunity threshold, and suggests late intervention has more effect on total cases than early intervention
       once containment has failed. Data as of April 11, 2020 show that “flattening” strategy for COVID-19 in both the
       world and the U.S. is working so well that a significantly effective removal of social distancing (aka “unlock”) at
       any time in the next few years, other than after widespread and effective vaccination, will produce a rebound over-
       loading the healthcare system. For the world, by early April flattening was working so well that a world rebound
       could be projected in 2021 that would exceed in critical demand even the additional million or so ventilators re-
       quested by world governments. In the U.S., whose trajectory is somewhat ahead of the world, the projected re-
       bound of a late year unlock is already greater than the current crisis projected peak. Most citizens are tacitly ex-
       pecting much sooner rather than much later unlocks. Leaving economies locked down for a long time is its own
       catastrophe, especially for countries that cannot provide substantial economic aid to their citizens. An SIR-type
       model was used with clear parameters suitable for public information, and both tracking and predictive capabilities,
       and an additional simulation of a decision-maker on selected-day partial unlock designed mainly to manage venti-
       lator or other critical resource utilization, to make sure they are neither idle nor over committed. Using certain
       days of the week, already practiced by some countries, is not a necessary part of the method, but was used in the
       simulation to give a highly quantified unlock scheme. It also helps restore economic activity. While the model
       shows total cumulative cases, and therefore deaths, declining initially with flattening, when flattening begins to
       produce large rebounds the death rate goes back up. Partial unlock to manage critical resources brings the cumu-
       lative cases down about 8-12% between now and the second half of 2021, and therefore saves lives with some de-
       gree of certainty.

       Keywords
             Coronavirus, COVID-19, pandemic, model, partial unlock, social distancing, economic impact, ventilator uti-
       lization, SARS-CoV-2

       1. Introduction
            The goals of the global effort against the COVID-19 pandemic are threefold: (1) reduce the number of infected
       individuals and therefore deaths, (2) avoid overtaxing the healthcare system thereby making services not available

                                                                    1

            © 2020 by the author(s). Distributed under a Creative Commons CC BY license.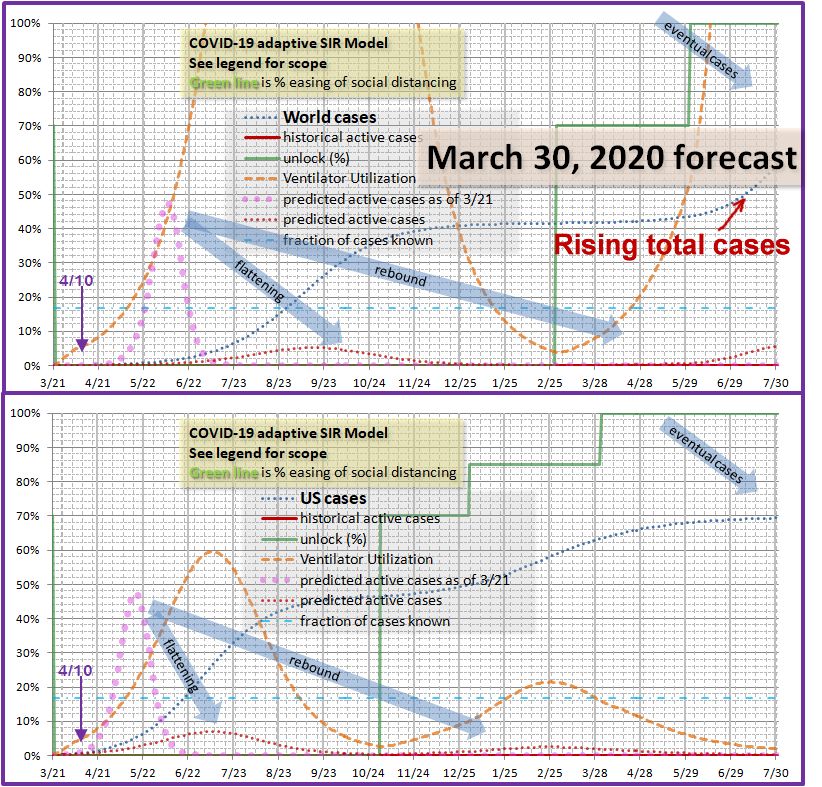
Preprints (www.preprints.org) | NOT PEER-REVIEWED | Posted: 15 April 2020                   doi:10.20944/preprints202004.0239.v1

       Shuler, Koukouvitis

       (for all needs not just COVID-19), and (3) reduce the social and economic impact of the pandemic [1].
       It is generally conceded that the effort is failing catastrophically on the third count, social and economic impact.
       The natural cycle of COVID-19 without intervention we will show would have ended by late July with only one
       month of effective shutdown while more than 20% of the world population was simultaneously ill. Current strat-
       egies guarantee a high degree of economic and travel shutdown for nearly two years even if vaccine development is
       successful, which we will also show. Perhaps more troubling for the long run, governments are now considering
       COVID I.D. cards to identify those with immunity, who will be permitted to travel and work, while enforcing a
       kind of mandatory quarantine on innocent and socially compliant citizens, as well as totalitarian-like individual
       monitoring and tracking.
             As regards the second goal, the world healthcare system for elective procedures is already shut down, likely
       for the same period as economic shutdown, and in the U.S. it is considered marginally possible to accommodate all
       anticipated demand for ventilators even if there were no other uses for them. This conclusion will be supported by
       our simulations also. The world at large has ordered 880,000 or more new ventilators, which may or may not be
       producible in time. We will further show this is about the right number, preferably rounded up to a million if per-
       fectly allocated, or more for allocation and error margin.
             What is less fully appreciated, and not at all in some circles, is that in regard to the first goal the eventual death
       toll has not been reduced significantly by recent actions. The primary aim of this paper is to show that while ini-
       tial flattening unequivocally reduced eventual death toll, with or without a vaccine, the gradual escalation of the
       policy combined with natural public fear and self-isolation will increase it in either of three cases:
             1. An effective vaccine is not available.
             2. Social chaos and hardship create unrest that forces unlock any time prior to vaccine deployment.
             3. The hoped for supply of ventilators and other medical equipment and personnel is not forthcoming.
       In addition to these three purely epidemiological consequences, social unrest may claim lives directly, topple oth-
       erwise stable governments, and undermine the long term geopolitical stability of the world.

       2. Approach
            Our approach considers containment as an opportunity past and a vaccine as a prospect too far in the future to
       avoid economic catastrophe. Opinions differ as to the effect of severe and prolonged recession on mortality and
       health. For example, there are fewer motorway deaths due to less driving [2]. During the COVID-19 pandemic
       there may well be fewer deaths due to pollution. On the other hand, the 2008 financial crisis resulted over the
       next few years in at least 260,000 additional cancer deaths [3]. Economic losses from pandemics, even without a
       long term global shutdown, have been estimated at the low end of but within the range of impacts from climate
       change [4]. These historical analyses are likely to vastly underestimate the impact from the economic and social
       disruption of COVID-19. While we currently have hostilities on pause in a few regional conflicts, when people
       are starving because they have no money there is likely to be mass unrest and replacement of governments, even in
       some very large countries, possibly even those like India and Pakistan that have nuclear weapons.
            That leaves the approach of curve flattening, which can have one or both of two objectives as they lie on a
       continuous spectrum:
            1. Keep the number of cases extremely low (and in consequence the economy completely shut down) until
                someone develops a therapy that prevents the disease or dramatically lowers mortality, or until the disease
                disappears on its own (unlikely if no herd immunity is building).
            2. Keep the number of cases moderately low while herd immunity builds more slowly, but the medical sys-
                tem remains operational and the economy is not fully shut down.
       Various governments and regions are currently implementing shutdown (or lockdown) rules or recommendations
       based on cultural preferences and the number of cases they have. Only a few exceptions use severe lockdown

                                                                    2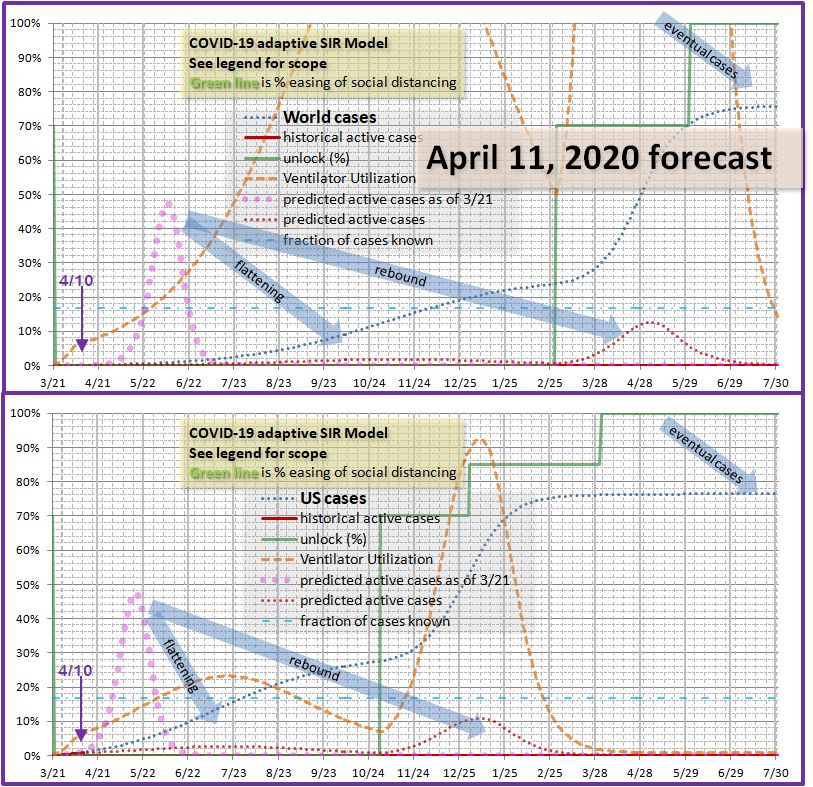
Preprints (www.preprints.org) | NOT PEER-REVIEWED | Posted: 15 April 2020                   doi:10.20944/preprints202004.0239.v1

                                                                                     Partial unlock caseload management for COVID-19

       with few cases (e.g. Russia). Most regions or entities lock down in proportion to cases. Instead of taking control
       of the situation from the pathogen as intended, by the implicit dependence of strategy on cases this hands control
       right back to the pathogen, and we will show this assures the survival of the pathogen long into the future, as it de-
       cays very slowly under heavy lockdown. Even at current case levels which are far below those anticipated in the
       near future, fear-based shutdown as evidenced by traffic reductions in cities that have no shutdown may be nearing
       its maximum potential. Figure 1 shows world cases, normalized to 1.0 on March 21, and the replication rate of
       the pathogen R0 defined in terms of new cases, active cases, and the average length of cases. R0 appears to cor-
       relate well with a damped exponential function given in the figure.

                          Figure 1. Empirical relation between replication rate R0 and normalized world cases.

            While lockdowns began to be enforced outside China from late January, they were initially selective and di-
       rected at international travel. By mid-March they were widespread. We would expect a few days delay before a
       reduction in R0 would appear in the new cases data (largely taken from the CDC, with supplementary data from
       https://www.worldometers.info/coronavirus/ ). Prior to March 21 the US cases were doubling every two days for
       about a week. This quickly declined following March 21, so that date was chosen as the start date for our tracking
       and modeling.
       Any method of caseload management must affect the replication rate, and act quickly enough to provide control
       authority without overshoot. The chart suggests case data from changes in lockdown of a week or slightly less.
       It further suggests the initial reaction was primarily due to the rules and recommendations. Lockdowns were
       mostly in place by the end of March. On the other hand, traffic surveys of cities with no lockdown showed sub-
       stantial reduction in traffic without lockdown, perhaps 70-80%, and that traffic had already plummeted in other
       cities prior to lockdown (see https://www.bbc.com/news/world-51235105 ). Taking the damped exponential cor-
       relation as a possible predictor, effectiveness of lockdown has nearly reached maximum. It is possible there
       would be little response if governments eased lockdown, unless they also declared the environment safe, which
       isn’t true any time soon. However, as economic distress builds, coupling easing with the ability to work would
       likely be a powerful motivator.
            The authors of this paper believe that such measures should be voluntary. Those healthy and at low risk and
       in economic need are likely to be willing to expose themselves to the environment, especially if governments
       maintain the integrity of the healthcare system and people are not dying from neglect. We take it as an assump-

                                                                   3
Preprints (www.preprints.org) | NOT PEER-REVIEWED | Posted: 15 April 2020               doi:10.20944/preprints202004.0239.v1

       Shuler, Koukouvitis

       tion that fear could be overcome to some degree and a partial unlock implemented. Controlling the degree of R0
       rebound is a separate problem. In our simulation we simply establish a percentage of R0 recovery to the initial
       level of March 21, and to provide an additional degree of control we allow the activity that results in this R0 re-
       bound to occur on selected days of the week. We simulate a decision maker with access to week-old data, who
       would decide what days of the week would be partially unlocked. This demonstrates that even a crude on/off lev-
       el of control is adequate. Our per day effectiveness ranges from 20% to 60%, with lower numbers used early on,
       and larger numbers when herd immunity is reducing R0 and it needs more of a push to progress toward herd im-
       munity and is not in danger of exploding and overloading the healthcare system.
            In a real world implementation, the simulated unlock manager is replaced by humans looking at new cases da-
       ta, and from that calculating future ventilator utilization. New cases data should in turn lag their decisions by no
       more than a week. Our simulations will attempt to show that in a variety of scenarios, over a range of disease pa-
       rameters, whatever happens the managers will have control authority to accomplish their goal. One thing we
       cannot do with epidemiological “trajectory” models is plan the whole thing out in advance, because tiny changes in
       R0, often due to behavior, make large changes in future caseload in the future. What we demonstrate instead is
       that it is possible by making decisions in the future to accommodate those changes in intrinsic R0 and counter
       them, even with measurement lag in the system. The unlock managers and policy makers must determine what
       actual social distancing measures correspond to the desired percent of unlock by empirical means.
       The original goal of this research was just to assure that the constraint of medical resources could be met while re-
       ducing economic impact. It was an unexpected discovery that under realistic scenarios, such as a world unlock
       approximately a year from now, cases and presumably deaths would be reduced by as much as 8-12% as compared
       to simpler lockdown release strategies, or a long lockdown that results in social unrest.
            At this writing, a few countries such as Denmark are planning to slowly ease lockdowns. This may inad-
       vertently accomplish some of the goals of this paper. But without intention, the authors feel it is just as likely to
       create panic and backfire. The intent of such moves is to slowly return to normal. The intent of the easing ad-
       vocated in this paper is to quantitatively manage caseload, including increasing caseload when it is too low to ef-
       fectively utilize available resources, reduce economic distress, and prevent deadly rebounds later this year or next
       year.

       2.1. Model parameters and algorithm
            Most model parameters are user adjustable. The model is in a spreadsheet to be uploaded with this paper,
       and also available at http://shulerresearch.org/covid19.htm . A thumbnail view of the parameters is shown in Fig-
       ure 2. To actually study the parameters and determine how to use them in detail, download the spreadsheet and
       read the short user guide embedded within it. It is very easy to change regions, with parameters for name of a
       main region and one sub-region (perhaps a large city, any area with a different phase of the epidemic, perhaps
       partly quarantined from the larger region), their populations, and ventilator availability.
            An initial value of R0=2.5 was taken from the March 20-21 case data for the US and within range of CDC and
       other estimates [1, 5].
            The number of ventilators in the U.S. including reserves, alternatives (anesthesia machines) and older equip-
       ment is taken at 200,000 [6]. The number of ventilators in the world is harder to obtain. About 340,000 were
       identified at https://en.wikipedia.org/wiki/List_of_countries_by_hospital_beds but a number of large countries
       were listed as “unknown”. A rough estimate of 500,000 was assumed. Simulations were also run with
       1,500,000 reflecting requests for manufacture of additional ventilators. No schedule for them is available. Ob-
       viously these questions have to be addressed by any entities using our strategy. In the final few simulations we
       will address some of these issues based on public comments of planners. The model has a mode switch that will
       automatically allocate ventilators by population. This might be helpful, for example, within a country, as it is in
       the country’s interest not to have one region in dire straits while another has excess resources. It is useful in re-
       balancing New York vs. the rest of the U.S., for example. It is not likely to be practical between countries and it

                                                                4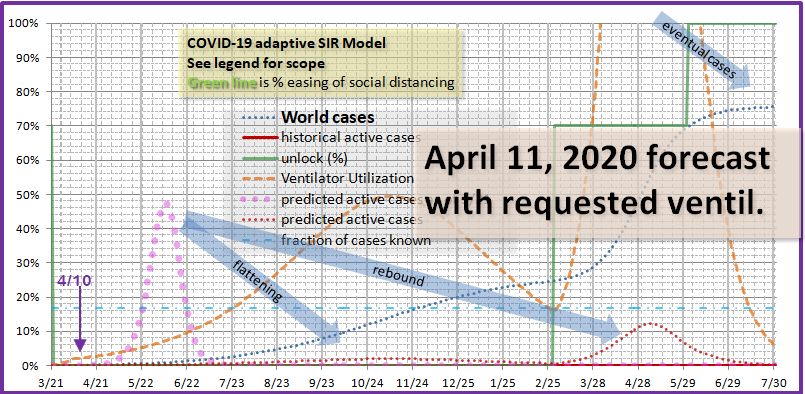
Preprints (www.preprints.org) | NOT PEER-REVIEWED | Posted: 15 April 2020                 doi:10.20944/preprints202004.0239.v1

                                                                                   Partial unlock caseload management for COVID-19

       is not very effective. Even if the entire ventilator supply of the U.S. were available to the world (it might be freed
       up if the U.S. aggressively followed the method of this paper), it is not enough to make a big difference. It really
       does take a million ventilators not to have a utilization crisis at the world level.

                            Figure 1. Model parameters and modes of operation (not every parameter shown)

             The ratio of total likely cases to known reported cases is taken at 6 (16.6% known) with alternative scenarios
       checked at 5 (20% known). The lower numbers are more critical due to the way the model calculates ventilator
       requirements. Published numbers are typically around 14% [7] which is a ratio of 7.1, so our assumption has
       some margin of safety. Sensitivity analysis was conducted over a range of multiples. Higher multiples produce
       herd immunity sooner, and since our critical cases estimate is based on known cases, higher multiples are easier to
       handle and lower multiples are harder. Presumably if in the future additional testing lowers this multiple by iden-
       tifying milder cases, it will correspondingly change the mortality rate.
             A precise number for how long a case of COVID-19 lasts is of course not obtainable due to the wide variation.
       However this number is not critical for our model. Somewhat more important is the length of time a ventilator is
       required, if one is required. The best estimate we could obtain was “up to weeks.” We used 14 days for both
       numbers. This parameter can be easily changed by a user of the model.
             The fraction of cases that require resources such as a ventilator is also important. We used 3.0% of known
       cases, or about half of critical cases, taken from Meng, et. al. [8]. Lower estimates exist. This is an area in
       which additional data and input from more specialized simulations would be used before public policy formulated.
       Regionalization is also important as ventilators may not be distributed where needed. Daily publication of model
       predictions, assuming they predict or exceed the actual data coming in, we believe would increase confidence and
       promote redistribution of ventilators according to need.
             Social networks, location tracking and other massive data mining efforts recommended in research of more
       persistent (non-pandemic) diseases [9] are specifically not part of our approach. They take time, where we require
       rapid feedback. They invite abuse for other applications later. But most importantly, social networks change as
       soon as a pandemic is announced, change again when government policy is announced, and keep changing. An
       aggregated tracking and feedback method will work better.
       Four unlock dates are provided each with its own percentage effectiveness (or degree of unlock). The first is con-
       trolled by a column of data with an entry for each day saying what the ventilator usage threshold is for that day.

                                                                 5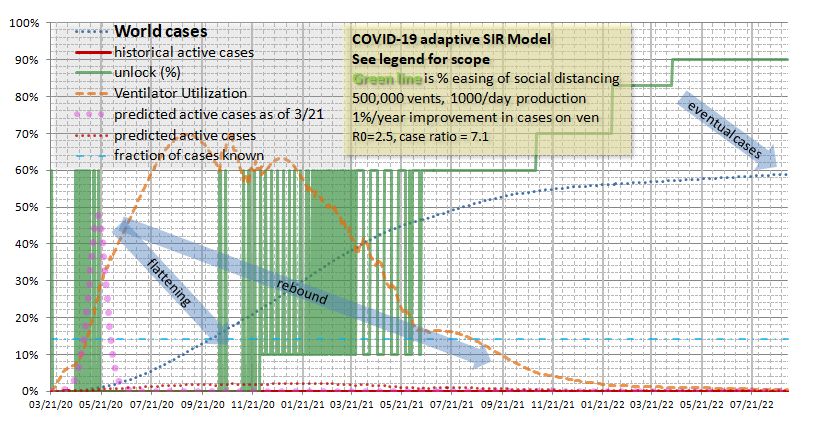
Preprints (www.preprints.org) | NOT PEER-REVIEWED | Posted: 15 April 2020 doi:10.20944/preprints202004.0239.v1
Shuler, Koukouvitis
In addition to the user specified threshold, often the same for a range of days (e.g. Monday, Wednesday and Friday)
the model varies each day of the week in a cycle by 2% from the previous day to avoid a hard turn on/off and lower
the loop gain, in other words, to avoid being a bang-bang (on-off) controller like a thermostat.
2.2. Model dynamics
We use a standard SIR modeling approach [10]. During “lockdown” the reproductive factor is adjusted ac-
cording to (a) the ratio of new cases from the previous day, and (b) the increase in herd immunity factor over the
previous day. Only when the caseload is rapidly peaking will day to day changes in herd immunity factor be rel-
evant. When an “unlock” policy is established in the predictive model, the reproductive factor is biased toward
the initial value and proportioned toward the last data-derived reproductive factor according to the unlock effec-
tiveness. Then it is reduced by the herd immunity factor. Calibrating unlock effectiveness, i.e. what policy will
have what percentage unlock effect, is an important activity that is left to the user and local authorities.
Each day actual data was used to replace predicted data based on CDC data at the link specified above. This
affects the model’s integration base and the effective reproduction rate R. The number of total cases, used for the
herd immunity calculation, is calculated by the given ratio of total to known cases as described, with the default
being 7.1 for 14% known.
Using the reproductive factor either taken from the data, or for future projections calculated using the last val-
ue, the herd immunity, and the unlock percentages as described above, the model calculates the number of new
cases. Based on the number of days entered for average case duration it updates the total active and resolved cas-
es and calculates ventilator utilization. There is no data filtering currently in the model. There is no predictive
anticipation of changes in R0. Both these techniques were tried and found to add nothing useful while obscuring
the otherwise simple algorithm.
3. Results for Curve Flattening and Caseload Management
The progress toward “curve flattening” is shown in Figure 3 and Figure 4, with predicted plots based on actual
data from 3/21 and 3/30. The unlock dates assumed are as far out in the future as we can imagine them, March 1,
2021 for the world generally and November 1, 2020 for the US.
One can see that to say flattening was successful is putting it mildly (red dotted curve). Thus arises the di-
lemma: not enough people are getting sick to develop herd immunity. Rebounds are developing beyond the un-
lock dates, despite how far in the future they are. The world rebound looks particularly ominous.
The US looks like it comes within its ventilator supply (see orange dashed line for ventilator utilization),
though barely considering some 30-40,000 of the ventilators counted are old or repurposed equipment, many are in
use, and there are issues getting them to where they are needed. But the model gives an idea that the magnitude of
the problem perhaps could be managed.
If the world at large wants to offer ventilators to those that might possibly be saved by them, it is clear the
world supply will have to increase, probably before the end of June.
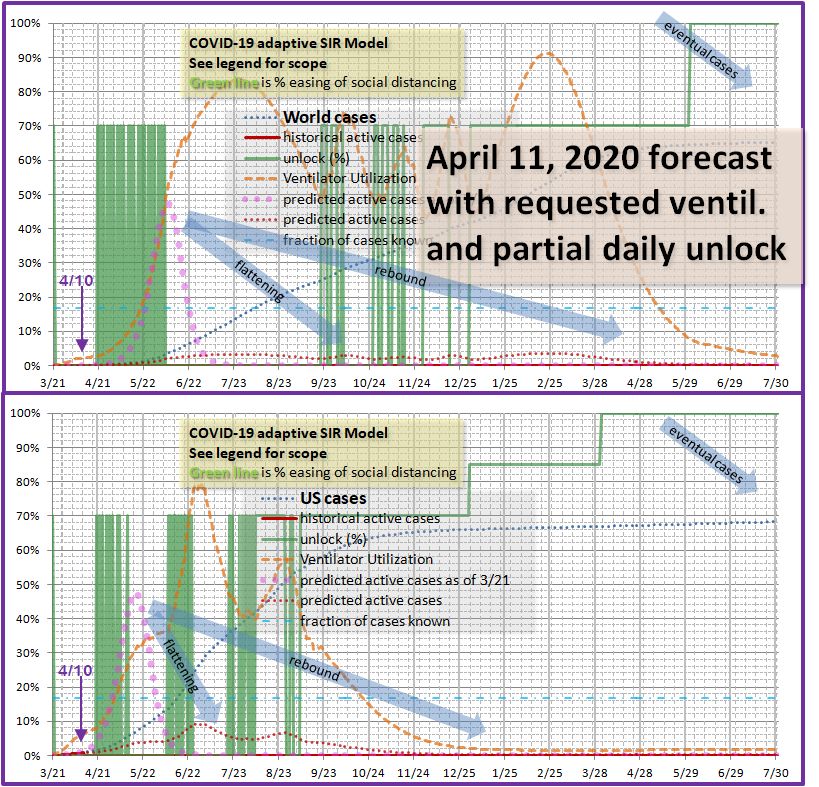
Figure 5 shows the curves projected from actual data through April 11. This is well into the period at the far
right of Figure 1, suggesting it describes an epidemic trajectory under maximum compliance with social discipline.
Clearly authoritarian measures such as used in China could decrease R0 further, and further flatten the US and
world curves, but we have currently no real ability to anticipate that most nations of the world would or even could
do this. Most do not have such authoritarian apparatus already in place.
In the disturbing Figure 5 the U.S. has its ventilator problem well in hand during lockdown, but a crisis looms
should there be an unlock any time within a few years, or until a vaccine is developed. The ventilators the US
has, moreover, are largely sitting idle prior to November. This is a wasted resource. Yet they could not be
loaned out because when the US needs them, the rest of the world would still need them.
The world has bought two and a half months, from July 1 until about September 15, for the date when its ven-
6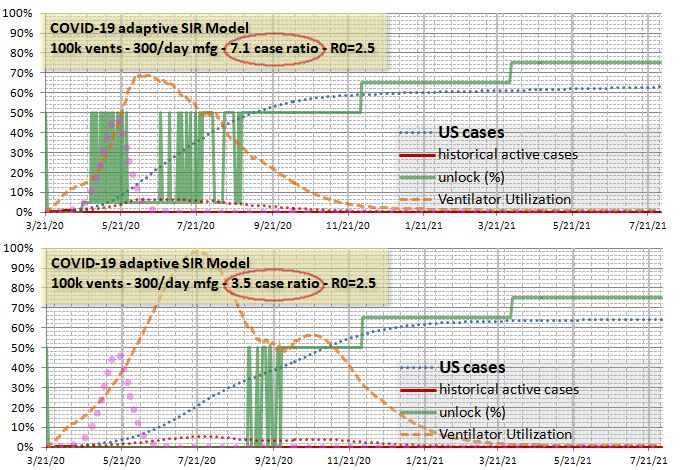
Preprints (www.preprints.org) | NOT PEER-REVIEWED | Posted: 15 April 2020                    doi:10.20944/preprints202004.0239.v1

                                                                                      Partial unlock caseload management for COVID-19

       tilator supply will be completely broken, but at the cost of immediate renewal of the crisis after unlock, or indefi-
       nite postponement of unlock. Notice that the number of cases and therefore number of deaths prior to unlock is
       still quite large. Overlooking the fact that the ventilators are only effective in saving about 15% of the lives to
       which they are applied, perceptions matter. If some countries have ventilators for everyone and others don’t, there
       will be massive resentment.
             Figure 6 shows what the ventilator utilization is if the world manages a total of 1.5 million ventilators (at least
       an additional one million). It is a reasonable solution for the lockdown period, with ventilator utilization held at a
       practical 50%, allowing for some allocation inefficiencies. But any unlock period remains totally broken.

                                Figure 3. Initial projection for world and US based on data through 3/21.

           Even more alarming, the total cases (and therefore total deaths) had been mitigated to about the 52% level
       without serious rebound in the moderate flattening effectiveness indicated by data around the March 26 timeframe
       with an effective R0=1.566. From the plot of cumulative cases (blue dotted curve) in Figure 7 it appears there is a
       64% infection of the population.

                                                                   7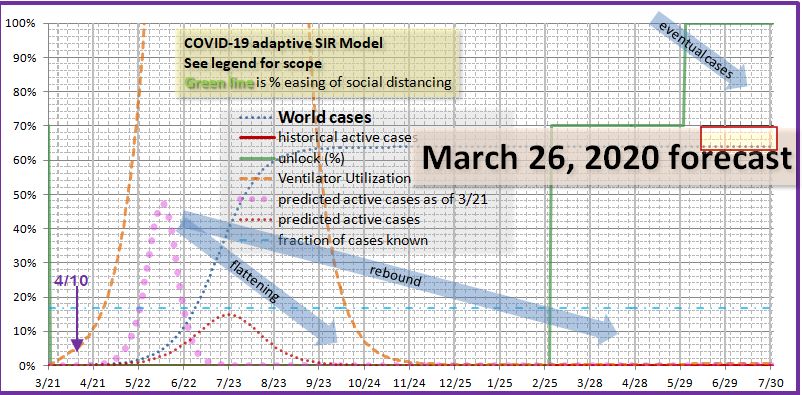
Preprints (www.preprints.org) | NOT PEER-REVIEWED | Posted: 15 April 2020                  doi:10.20944/preprints202004.0239.v1

       Shuler, Koukouvitis

                              Figure 4. Flattening progress for world and US based on data through 3/30.

            There is a lot of uncertainty in the literature on mortality rates. Only part of it is due to the unknown cases.
       There are differences in the care provided, not only from place to place, but over time as things are learned about
       treating the disease. Currently the mortality in known cases seems, based in CDC and other published data, to be
       running around 2.7-3% of known cases, just under the number on ventilators (in many countries including the US
       survival rates post-ventilation are low). In countries where it is practical, now forewarned, more vulnerable indi-
       viduals can isolate themselves no matter what the unlock policy is, and the effect will be to reduce that rate. If we
       assume this effect, along with better treatment, reduces the mortality to 1.2%, then the mortality among all not just
       known cases, assuming a ration of 6, is 1.2/6 = 0.2%. We use this conservative number to avoid overestimating
       the number of lives potentially saved by utilizing our method. The number of deaths by this method for Figure 7
       is 0.2% of 64% of 7.5 billion or 9.6 million direct deaths from disease. Some estimates will range more than
       twice that much.

                                                                  8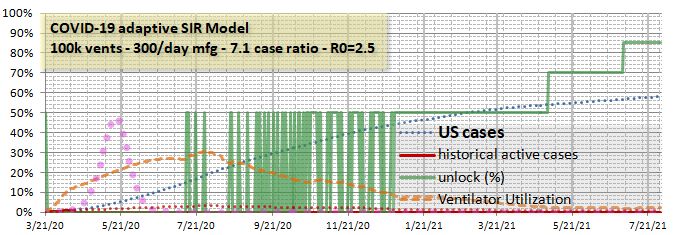
Preprints (www.preprints.org) | NOT PEER-REVIEWED | Posted: 15 April 2020                  doi:10.20944/preprints202004.0239.v1

                                                                                    Partial unlock caseload management for COVID-19

                              Figure 5. Flattening progress for world and US based on data through 4/11.

       Referring to Figure 6, which has an effective R0 of 1.158, shows very effective flattening. The total cases are
       76%, 8% higher, or a difference of conservatively 1.2 million additional deaths from extreme flattening followed
       by a vicious rebound. If there is social unrest the R0 will not be maintained and there won’t be as many deaths
       directly from disease, but there could easily be that many from social unrest. If our estimate is too conservative,
       there could be 2 or more million additional deaths.
            Figure 8 shows the use of a select-day partial unlock strategy with feedback to maintain ventilator utilization,
       so that ventilators are not idle while a dangerous rebound builds.
       There are still some practical issues evident. Either the world ventilator supply has to be augmented by the middle
       of next month, or the entire strategy shifted to the right until the ventilator supply is augmented. However, from
       the US portion of the chart – and we assume Europe could if desired follow a similar pattern – by October a reser-
       voir of immune medical volunteers and perhaps even some ventilators may become available. The rest of the
       world will still be in dire need until at least May of 2021, and beyond if they have shifted forward in time to wait
       on ventilators.
            However, the astonishing thing about this seemingly chaotic strategy is that it works. The total number of
       cumulative cases is back down around 64%. At least 1.2 million lives are saved, possibly two or three times that.

                                                                  9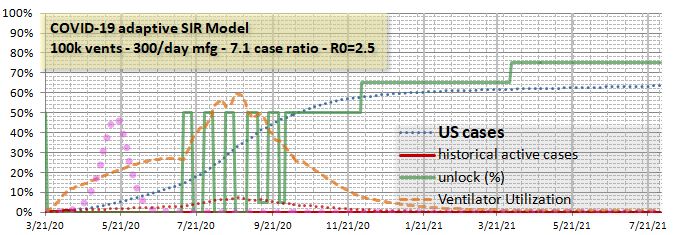
Preprints (www.preprints.org) | NOT PEER-REVIEWED | Posted: 15 April 2020                             doi:10.20944/preprints202004.0239.v1

       Shuler, Koukouvitis

       Much of the world’s economy is out of trouble half a year or more earlier than otherwise.

                                      Figure 6. World ventilator utilization with total of 1.5 million ventilators.

                             Figure 7. Lowest projected cases is for March 26 R0 of 1.566, 64% of population (red box).

            4. Validity of Model and Mechanism of Reduction in Cases
            Parameters for cases on ventilators, number of ventilators, length of illness and/or time on ventilators and ratio
       of total to known cases primarily affect the ventilator utilization calculation, and somewhat the timing of peaks, but
       not the disease spreading rate. Timing of peaks was not a goal of this model. It is evident that lowering or rais-
       ing a near peak during lockdown has the opposite effect on the rebound, up until herd immunity kicks in, which is
       not dependent on these parameters. Ventilator estimates are consistent with other studies because they were taken
       from other studies. It is only the purpose of this research to show how to manage critical resources to smooth out
       rebounds and reduce deaths.

                                                                           10
Preprints (www.preprints.org) | NOT PEER-REVIEWED | Posted: 15 April 2020 doi:10.20944/preprints202004.0239.v1
Partial unlock caseload management for COVID-19
Figure 8. Partial and select-day unlock with feedback to optimize ventilator utilization.
This study is also not particularly sensitive to R0. It in fact uses empirical R0 and various ratios dependent
on it that are unspecified in detail, only in example, and intended to be determined as one goes. The results are
essentially the same over a reasonable variation. If we assume a case ratio of 5, of course ventilators appear bro-
ken, as in any case they would be in real life. But the dynamics of managing ventilator utilization still work in the
same way.
There are two legitimate caveats. One is the possibility that while citizens have complied more than expected
with lockdown (so far), they may not be enthusiastic about partial unlock with the objective that more of them get
sick.
The second is that total cases really do vary with strategy and avoiding a dramatic rebound really will reduce
the total cases. It is apparent that it will reduce social unrest, but we have not claimed a quantity of lives associ-
ated with that. It is a traditional, simple principle in epidemiology that herd immunity occurs when 1-1/R0 of the
population have been infected, or 60% in the case of R0=2.5.
In the unlocked no-flattening case for the world (Figure 3), the infected fraction is changing at 4% per day as it
goes through 60% and R0=1. The new cases at that time will last, in the mathematics of our model, 14 days.
Thus the infection rate continues upward, reaching 89% before that 14 day period is up. By then R0=0.276, but
11Preprints (www.preprints.org) | NOT PEER-REVIEWED | Posted: 15 April 2020 doi:10.20944/preprints202004.0239.v1
Shuler, Koukouvitis
not zero. There are still some new cases, and still some contagion from cases created in the previous 14 days.
So the peak infections slowly rise to 92%. This appears to be real, and not an error or simulation artifact.
The same general principle will apply to the dramatic rebounds of mismanaged unlock and over-flattening.
The rise from the baseline 64%, which seems about as close to the theoretical 60% as we can realistically expect, to
76% in the rebound cases, is much more modest and certainly credible. The savings of life is as real as the saving
in economic depression and social unrest. But now that we understand something about the mechanism of over-
shoot of the theoretical herd immunity threshold, whatever it may be (60% happens to correspond to R0=2.5, but it
is likely in the range of 50-75%), can we do an even better job of reducing total cases while preserving some eco-
nomic claw-back? The US cases in the preceding simulations were around 70%. Certainly that should be able to
be improved. How close to the theoretical limit can we come with this awkward control mechanism?
5. Results for Minimizing Total Cases with Realistic Resources
It appears from the foregoing analysis that total cases should approach the herd immunity threshold very
slowly to avoid overshoot, and associated deaths. To investigate this under somewhat more realistic conditions,
several changes were made to the model:
Automatic pre- and post-peak detection by the select-day partial unlock decision simulator.
Lockdown floor other than 0% for the partial unlock decision simulator.
Ability to augment ventilators with a per-day manufacturing capacity.
Ability to slowly improve the fraction of cases requiring ventilators, to simulate gradual knowledge gain
and therapy development.
First, we applied these techniques to the US simulation, attempting to lower the total cases toward the theoret-
ical threshold without giving up too much of the economic benefits. The parameters used in the new round of US
simulations were as follows:
100,000 ventilators (instead of the optimistic 200,000)
Ventilator manufacturing of 300 per day (this capacity is announced by several auto makers working un-
der license to GE, see
https://www.theverge.com/2020/3/30/21200216/ford-ge-ventilators-coronavirus-covid-19-manufacturing
Reduction in fraction of known cases that require ventilation by 0.003% per day. This results in a reduc-
tion from 3% to 2% in about a year.
Total to known case ratio from 3.5 (the lowest the model would handle without breaking the medical re-
sources) to 7.1 (corresponding to the published 14%). We know the model is roughly tracking actual da-
ta with this ratio set at 6, so we believe this spread represents a reasonable sensitivity analysis.
Threshold settings for ventilator management of 50% pre-peak (0% for 3.5 case ratio scenario) and 70%
post peak, with a 5% minimum partial unlock (0% for 3.5 case ratio).
Results for case-ratio sensitivity are shown in Figure 9. Total cases are down to 63% from 70% for the US
with little loss of economic activity compared to the 70% case, and the medical resources (ventilator and related)
requirements have been cut in half. For the 3.5 case ratio the early economic benefits are lost, but medical resources
are not broken and it looks like a late start fall school session is possible. Total cases only went up 1%. By the
earlier assumptions, compared to the 70% case, 54,000 and 47,000 lives are saved respectively in the two new cas-
es.
For the US sensitivity to R0, values of R0=2.0 and R0=3.0 were used for the same parameters as the R0=2.5
case, with a 7.1 case ratio. The modest changes in the simulated-decision-maker partial unlock strategy were able
to handle this variation. Theoretical herd thresholds for these cases are 50% and 67% respectively. The 3.0 case
comes within 2% of theoretical. The 2.0 case is 8% above the theoretical. This is without optimization specifi-
12Preprints (www.preprints.org) | NOT PEER-REVIEWED | Posted: 15 April 2020 doi:10.20944/preprints202004.0239.v1
Partial unlock caseload management for COVID-19
cally for either of these, and the 2.0 case can be improved from an 8% overshoot to a 4% overshoot by cutting the
target ventilator utilization post-peak from 70% to 40%, slowing the final rise in cases.
Figure 9. Unknown to known case ratio sensitivity for US with slow approach to herd threshold
Second we applied these to the world model. For the world simulation little improvement in total cases is
theoretically possible, so we attempted to achieve some economic gains while addressing the severe medical re-
source shortfall, which as before we take the ventilators as a proxy. For unlock thresholds, see the green solid line
on the chart. Other parameters were set as follows:
500,000 initial ventilators with 1000 a day manufacturing capacity. This was set because it was the
minimum needed to make the model work. It seems reasonable in light of the US projection.
The same 1% per year improvement in ventilator needs among known cases as in the US.
22% pre-peak ventilator utilization target and 65% post-peak, and a partial unlock floor of 10% unlocked
which does not start until December 1, 2020. This allows time for the ventilator supply to build, though
it delays economic benefits.
The results are shown in Figure 10. While the world must endure about 5 months of greatly reduced economic
and social activity, it appears the total cases will never exceed 60% giving an even larger saving of 1.8 million
lives, conservatively estimated.
For sensitivity analysis we applied the same parameters excepting a 0% pre-peak ventilator utilization target.
The world can endure a case ratio of 5.5 and R0=3.0 at the same time, though with no medical resource margin.
Even under this stress it saves nearly a million lives over our default scenario.
Third, we return to the US and ask whether early mistakes have significant effect on cases. We do not con-
sider containment. Whether containment elsewhere was possible once it failed in China is far beyond the scope of
this paper, though in the author’s view, considering the large fraction of asymptomatic and mild cases, it seems an
13Preprints (www.preprints.org) | NOT PEER-REVIEWED | Posted: 15 April 2020 doi:10.20944/preprints202004.0239.v1
Shuler, Koukouvitis
extreme proposition. That leaves treatment, vaccines and herd immunity. The final cumulative cases for herd
immunity are fixed at a minimum of 1-1/R0unlocked. Our analysis has shown that it is easy to exceed that if the rate
of cases is high as one approaches the limit.
Figure 10. World scenario optimized for actual available and likely manufactured ventilators
Figure 11 shows the US continuing the current lockdown until January of 2021, with then a 40% unlock, pos-
sibly enough to support a spring school semester. The virus is not gone, and the cases rise, with the case total eas-
ily passing 64% and continuing to climb as the chart ends in August. Possibly in this time frame a vaccine might
be available, but notice that no lives are saved by a vaccine in this time frame unless we completely give up even
the tiniest amount of unlock. Certainly we have to give up a spring school semester next year. Based on the
amount of agitation now, it seems unlikely to assume such a long and total lockdown. The personalities of isolat-
ed children will be altered. Family dynamics will become extremely difficult. The author who lives in the US is
already noticing this. Against this likely baseline, our methods become relatively more important.
Figure 11. US with full lockdown until 2021, then 40% unlock for spring school, not business.
So waiting until next year appears unhelpful. There is still significant rebound, before a vaccine, and we
14Preprints (www.preprints.org) | NOT PEER-REVIEWED | Posted: 15 April 2020 doi:10.20944/preprints202004.0239.v1
Partial unlock caseload management for COVID-19
overshoot the minimum herd immunity. There is NO BENEFIT to such delay since the cases increase. What
about shorter term waiting? Figure 12 gives the result for waiting until July 1 to start a partial unlock regime.
Figure 11. US with delayed partial unlock strategy starting on July 1, past the lockdown peak.
Before going further, the authors wish to point out that week-long locks and unlocks, such as appear in Figure
11, should not be taken too literally. These are artifacts of a simplistic simulation of an unlock decision maker.
Using manually adjusted daily schedules, verified closer to the time in question by simulations, these almost cer-
tainly can be smoothed over into a regular schedule that is easy to remember and routine. The point of the present
simulation is to quickly make large judgments about how to plan the whole cycle without tediously modifying in-
dividual days.
The July partial unlock occurs just past the project May peak (on which point we generally agree with many
other models) and produces no change in total cases, but it produces an immediate rebound that doubles the peak.
This is likely to meet stiff public disapproval, and even cause fear that could make the unlock ineffective. Can
this be smoothed out? It also loses a lot of economic advantage as compared to Figure 9, top part, though this too
incurs a steep rise in cases that may be alarming. Various smoothing options could be the subject of a long inves-
tigation. Figure 12 shows an example demonstrating it is possible, but partial unlock extends all the way to 2021,
increasing the economic impact.
Figure 12. US with delayed partial unlock strategy starting on July 1, past the lockdown peak.
It appears that early variations in lockdown have little effect on the total cases, which is determined late in the
cycle as total cases approaches and/or passes through the theoretical herd immunity value. Criticisms regarding
lack of early action can apply only to containment strategies, or to shortages of medical resources. In fact there
15Preprints (www.preprints.org) | NOT PEER-REVIEWED | Posted: 15 April 2020 doi:10.20944/preprints202004.0239.v1
Shuler, Koukouvitis
were also criticisms of US officials for attempting containment by shutting down foreign air travel. In a democ-
racy, there is criticism of every strategy in the natural course. There will be criticism of our strategy. We be-
lieve that when practical facts are considered, it has little downside in light of the results in Figure 11 with extended
lockdown.
Finally we ask whether avoiding the partial unlock strategy altogether and unlocking 40% for a fall semester
produces a viable result. This is shown in Figure 13. It is our estimate this likely doesn’t allow for much busi-
ness activity. In each of these charts we have adjusted subsequent unlock levels (the stair steps in the green line)
to manage total cases. It appears such a fall semester unlock would have to remain at that level through April of
2021, with significant economic loss and a disturbing rebound peak in early November of 2020, though the cumu-
lative cases is managed satisfactorily. This last figure we believe cements the case that we can and should manage
the epidemic trajectory with partial unlock and feedback.
Figure 13. US with with fall 40% unlock for school, partial unlock strategy not used.
6. Conclusion
We leave more detailed regional and local analysis to the many regions and locations of the world, but with
the suggestion that perhaps each locality should independently assure that this threshold is approached slowly.
Each region can also best devise and measure its partial unlock strategy based on culture and responsiveness, ge-
ography, types of industry and so forth.
Without active management, our simulations suggest a badly broken world economy and medical equipment
supply, even with a successful lockdown strategy and assuming no major social unrest (Figure 5, massively ex-
ceeded ventilator supply by the end of summer). Applying partial unlock with feedback control to efficiently use
medical equipment, and using economic unlock to effect this control, provides relief from not only the medical re-
source problem, but some relief from economic shutdown, and a significant improvement in deaths due to total
cases.
The consistent gentle slowp of the increase in cases, which directly reduces the total cases by avoiding over-
shoot, is difficult to accomplish by any other method. Locking down in a reactionary way too hard for too long is
particularly dangerous. But an uncontrolled unlock feels very dangerous. The method described in this paper
provides predictable control over the situation which should help maintain calm as cases build in a planned way,
rather than just shooting up as COVID-19 clearly has the potential to do.
It has been suggested that COVID-19 and its related cousins (SARS, MERS) do not kill directly, as the virus count
has already passed the peak when death occurs, but the coup de grâce is delivered by the immune system fighting
back too hard. [11, 12]
Is that how our society and civilization is going to die, by fighting too hard? Given the current data and di-
16Preprints (www.preprints.org) | NOT PEER-REVIEWED | Posted: 15 April 2020 doi:10.20944/preprints202004.0239.v1
Partial unlock caseload management for COVID-19
rection, it appears likely.
We had neither the knowledge nor cooperation level to fight the 1918 flu epidemic by shutting down our
world. But we survived it. It may have had some effect on the WWI armistice, some think, keeping the Ameri-
can President Woodrow Wilson away and imposing harsher terms on Germany which may have contributed to
WWII. It is possible that despite the warning shots of SARS and MERS and urging from influential scientists and
wealthy activists that we just don’t have the medical technology to shut down this pandemic out of hand.
However, we have the ability to shut not only our economy down, but so throttle the progress of the disease
that it doesn’t run its course and remains in the wings, forcing us to continue down for so long that social order will
be called into question, and countless lives will be economically ruined. Not every country can afford trillion
dollar a month compensation for losses due to lockdowns, and those that can will not manage to distribute it equi-
tably, and those that receive it will be demoralized by the loss of their life’s work. It may be intellectually un-
comfortable to compare social and economic losses, however large, to a medical body count.
So this paper provides a medical body count associated with following a less than optimal unlock strategy, and
specific tools and theoretical understanding for finding and following a near-optimal strategy. Now that is some-
thing concrete we can pursue.
References
[1] Uddin, M., Mustafa, F., Rizvi, T..A., Loney, T., et.al. (2020). SARS-CoV-2/COVID-19: Viral Genomics, Epidemi-
ology, Vaccines, and Therapeutic Interventions. Preprints 2020, 2020040005
https://doi.org/10.20944/preprints202004.0005.v1
[2] He, M.M. (2016). Driving through the great recession: why does motor vehicle fatality decrease when the economy
slows down? Soc. Sci. Med., 155, 1-11, April, https://doi.org/10.1016/j.socscimed.2016.02.016
[3] Maruthappu, M., Watkins, J., Noor, A.M., Williams, C., Ali, R., Sullivan, R., et. al. (2016). Economic downturns,
universal health coverage, and cancer mortality in high-income and middle-income countries, 1990–2010: a longitu-
dinal analysis, The Lancet, 388, 10045, 684-695, August, https://doi.org/10.1016/S0140-6736(16)00577-8
[4] Fan, V.Y., Jamison, D.T., Summers, L.H. (2018). Pandemic risk: how large are the expected losses? Policy & Prac-
tice, Bulletin of the World Health Organization, 96, 129-134, December, http://dx.doi.org/10.2471/BLT.17.199588
[5] Huppert, A. and Katriel, G. (2013). Mathematical modeling and prediction in infectious disease epidemiology, Clin.
Microbiol. Infect., 19, 999-1005, June, https://doi.org/10.1111/1469-0691.12308
[6] Halpern, N.A. and Tan, K.S., (2020). U.S. ICU Resource Availability for COVID-19, Soc. Of Crit. Care Med.,
SCCM Ventilator Taskforce, ver. 2, March 25,
https://www.sccm.org/getattachment/Blog/March-2020/United-States-Resource-Availability-for-COVID-19/United-
States-Resource-Availability-for-COVID-19.pdf?lang=en-US
[7] Li, R., Pei, S., Chen, B., Song, Y., Zhang, T., Yang, W. and Shaman, J. (2020). Substantial undocumented infection
facilitates the rapid dissemination of novel coronavirus (SARS-CoV2), Science, eabb3221, March,
https://doi.org/10.1126/science.abb3221
[8] Meng, L., Qiu, H., Wan, L., Ai, Y., Xue, Z., et. al. (2020). Intubation and Ventilation amid the COVID-19 Out-
break: Wuhan’s Experience, Anesthesiology, special section on COVID-19, no pagination specified, March,
https://doi.org/10.1097/ALN.0000000000003296
[9] Marathe, M. and Ramakrishnan, N. (2013). Recent Advances in Computational Epidemiology, IEEE Intell. Syst.,
28, 4, 96-101, July-August, https://dx.doi.org/10.1109%2FMIS.2013.114
[10] Marathe, M., Vullikanti, A.K.S. (2013). Computational epidemiology, Communications of the ACM, 56, 7, 88-96,
July, http://doi.acm.org/10.1145/2483852.2483871
[11] Pearson H., Clarke T., Abbott A., Knight J., Cyranoski D. (2003). SARS: what have we learned? Nature,
424(6945):121-126, June 30. https://doi.org/10.1038/424121a
[12] He, F., Deng, Y., Li, W. (2020) Coronavirus disease 2019: What we know? Journal of Medical Virology, no volume
specified, 1-7, March 12. https://doi.org/10.1002/jmv.25766
17You can also read