Faceted spurs at normal fault scarps: Insights from numerical modeling
←
→
Page content transcription
If your browser does not render page correctly, please read the page content below
JOURNAL OF GEOPHYSICAL RESEARCH, VOL. 114, B05403, doi:10.1029/2008JB005955, 2009
  Click
  Here
    for
 Full
Article

Faceted spurs at normal fault scarps: Insights from numerical
modeling
C. Petit,1 Y. Gunnell,2 N. Gonga-Saholiariliva,2 B. Meyer,1 and J. Séguinot3
Received 24 July 2008; revised 7 February 2009; accepted 27 February 2009; published 8 May 2009.

[1] We present a combined surface processes and tectonic model which allows us to
determine the climatic and tectonic parameters that control the development of faceted
spurs at normal fault scarps. Sensitivity tests to climatic parameter values are performed.
For a given precipitation rate, when hillslope diffusion is high and channel bedrock is
highly resistant to erosion, the scarp is smooth and undissected. When, instead, the
bedrock is easily eroded and diffusion is limited, numerous channels develop and the scarp
becomes deeply incised. Between these two end-member states, diffusion and incision
compete to produce a range of scarp morphologies, including faceted spurs. The
sensitivity tests allow us to determine a dimensionless ratio of erosion, f, for which faceted
spurs can develop. This study evidences a strong dependence of facet slope angle on throw
rate for throw rates between 0.4 and 0.7 mm/a. Facet height is also shown to be a linear
function of fault throw rate. Model performance is tested on the Wasatch Fault, Utah,
using topographic, geologic, and seismologic data. A Monte Carlo inversion on the
topography of a portion of the Weber segment shows that the 5 Ma long development of
this scarp has been dominated by a low effective precipitation rate (1.1 m/a) and a
moderate diffusion coefficient (0.13 m2/a). Results demonstrate the ability of our model to
estimate normal fault throw rates from the height of triangular facets and to retrieve the
average long-term diffusion and incision parameters that prevailed during scarp evolution
using an accurate 2-D misfit criterion.
Citation: Petit, C., Y. Gunnell, N. Gonga-Saholiariliva, B. Meyer, and J. Séguinot (2009), Faceted spurs at normal fault scarps:
Insights from numerical modeling, J. Geophys. Res., 114, B05403, doi:10.1029/2008JB005955.

1. Introduction                                                             spond to the termination of a topographic spur forming a
                                                                            strike-perpendicular interfluve between V-shaped valleys in
  [2] Faceted spurs or triangular facets are geomorphologic                 the incised footwall. Triangular facets are thus landforms
features frequently observed at normal fault scarps [e.g.,                  that bear the influence of tectonic (i.e., fault dip, earthquake
Cotton, 1950; Birot, 1958]. Whereas spectacular faceted                     recurrence intervals, amount of coseismic slip) and external
spurs are currently observed in regions of active extension                 (incision and diffusion rates, landsliding) parameters. For
such as the Basin and Range [e.g., Wallace, 1978], Baikal                   example, the so-called wineglass canyons that flank faceted
Rift [Houdry, 1994; San’kov et al., 2000], and Aegean                       spurs in many regions are generated by a combination of
region [e.g., Armijo et al., 1991; Meyer et al., 2002; Ganas                footwall uplift and increased fluvial incision that has been
et al., 2005], other areas affected by active extension show                occurring since the last glacial maximum [e.g., Wallace,
weakly incised normal fault scarps lacking faceted spurs                    1978; Benedetti et al., 1998; Goldsworthy and Jackson,
(Figure 1). In contrast to reverse faulting, which creates a                2000]. As shown later, tectonics, fluvial incision and in situ
gravitationally unstable topography due to relative uplift of               diffusion on hillslopes are governed by specific rules, and
the hanging wall above the ground surface, normal faulting                  different combinations of these have different impacts on
allows topographic expression of fault surfaces to be main-                 the shapes of faceted spurs. As a result, these can be used as
tained in the landscape for relatively longer periods of time.              quantitative tectonic and climatic markers.
Once a topographic step is formed above the hanging wall,                     [3] Inferring the tectonic signal from the analysis of
the normal fault scarp is progressively incised by drainage                 topography has long been a challenge to geomorphologists.
[e.g., Hamblin, 1976; Wallace, 1978]. This process can                      Some studies have attempted to extract the tectonic signal
generate triangular facets in which facet summits corre-                    from the analysis of river long profiles and drainage slope
                                                                            distribution [e.g., Wobus et al., 2006; Whittaker et al., 2007,
   1
    ISTeP, UMR 7193, UPMC, CNRS, Paris, France.                             2008], based on scaling laws between channel slopes and
   2
    Laboratoire de Géographie Physique, UMR 8591, Université Paris VII,   contributing drainage areas. Alongside these analytic stud-
CNRS, Paris, France.                                                        ies, numerical landscape evolution models (LEMs), also
  3
    LGIT, Université Joseph Fourier, Grenoble, France.
                                                                            called surface process models (SPMs), have proved to be
Copyright 2009 by the American Geophysical Union.                           useful tools in predicting topographic evolution relating to
0148-0227/09/2008JB005955$09.00                                             tectonic and erosive processes on both small [e.g., Anderson,

                                                                     B05403                                                         1 of 13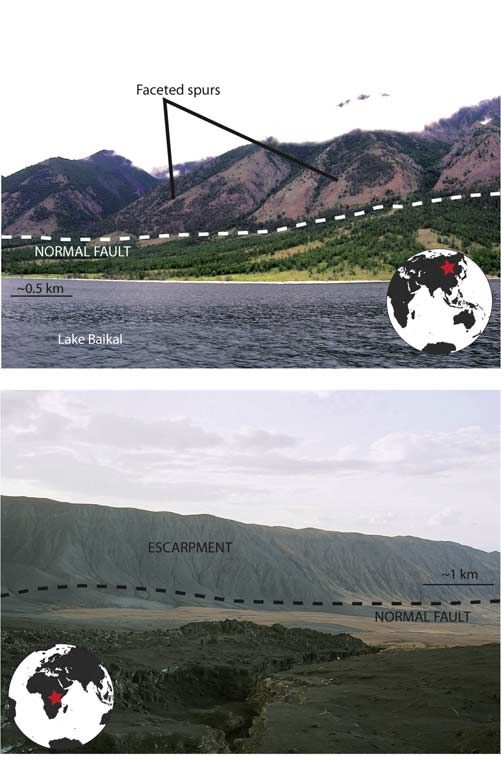
B05403                         PETIT ET AL.: NUMERICAL MODELING OF FACETED SPURS                                        B05403

                                                                 importance of landsliding. Following this study, Ellis et
                                                                 al. [1999] modeled the development of the Basin and Range
                                                                 topography using the Zscape algorithm which includes
                                                                 vertical motions along one or several normal faults, and a
                                                                 combination of fluvial incision, linear diffusion and sto-
                                                                 chastic landsliding. Their model produces triangular facets,
                                                                 which the authors interpret as being predominantly gener-
                                                                 ated by landsliding. According to this study, triangular
                                                                 faceted spur morphology is entirely controlled by rock
                                                                 strength, which defines the maximum slope angle under
                                                                 which the facet remains stable. These authors also conclud-
                                                                 ed that facet height probably bears no relation to fault slip
                                                                 rate. However, several observations have allowed us to
                                                                 question these conclusions. First, triangular facets commonly
                                                                 display a convex topographic profile with steepening slopes
                                                                 at the scarp base of the scarp. This militates in favor of
                                                                 progressive fault plane exhumation and restrained scarp
                                                                 erosion rather than for massive landsliding. Second, as
                                                                 noticed by Ellis et al. [1999], the products of such frequent
                                                                 landslides are not observed in the field and some faceted spurs
                                                                 still retain components of the fault plane. Third, the strange-
                                                                 looking topography generated by Zscape when the landslid-
                                                                 ing function is switched off [Densmore et al., 1998] suggests
                                                                 that mass movement is probably overestimated in the model
                                                                 formulation.
                                                                   [5] In this paper, we present sensitivity tests performed
                                                                 with a coupled surface processes and tectonic model. The
                                                                 tests allow us to separately determine the climatic and
                                                                 tectonic parameters (fault slip rate, fault dip) that control
                                                                 the development and morphology of faceted spurs. We
                                                                 show that the morphology of triangular facets does retain
                                                                 some information about the tectonic processes. The model is
                                                                 tested against topographic and geologic data from the
                                                                 Wasatch Fault, Utah.
Figure 1. Two examples of active normal fault scarps.
(top) Faceted scarp along the western shore of Lake Baikal,
Siberia. (bottom) Nonfaceted scarp on the Natron fault           2. Tectonic and Surface Process Model
system, East African rift, Tanzania.                               [6] We developed a SPM that incorporates long-scale
                                                                 fluvial erosion and short-scale diffusion on a regular grid,
                                                                 inspired by previous formulations by Kooi and Beaumont
1994; Gilchrist et al., 1994; Kooi and Beaumont, 1994;           [1994] and Braun and Sambridge [1997]. The SPM is
1996; Cowie et al., 2006; Attal et al., 2008] and large [e.g.,   mixed with a kinematic uplift model which simulates the
Densmore et al., 1998; Ellis et al., 1999; Lague et al., 2003]   activity of a normal fault following the elastic dislocation
spatial and temporal scales [Merritts and Ellis, 1994].          solution of Okada [1985]. We tested model sensitivity to
Reviews of the algorithms governing landscape evolution          climatic parameters over an 8  4 km grid with a grid
are given by Coulthard [2001], Dietrich et al. [2003],           spacing of 0.1 km, and the model was run for 1.5 Ma with a
Codilean et al. [2006], and Braun [2006]. Until now,             time step of 1 ka. The time duration of the model ensures
however, the development of faceted spurs has not been a         that the output topography has reached a steady state in
primary focus of most SPM studies (Ellis et al. [1999]           which crustal and erosional processes are balanced, and that
excepted). Among other SPM studies focused on extension-         facet growth is achieved [see, e.g., Ellis et al., 1999].
al tectonics, Cowie et al. [2006] modeled the development
and evolution of a drainage system during the growth and         2.1. Surface Process Model
linkage of normal faults, but the large grid spacing used          [7] Hillslope transport is modeled using a linear diffusion
(1 km) is not suited to the characterization of faceted spurs   law where the rate of erosion is linearly related to the
which are typically 1 – 2 km wide. Allen and Densmore            curvature of the topographic slope:
[2000] studied the evolution of sediment supply from the
uplifting footwall in response to tectonic and climatic                                    @h
changes. These and later similar studies [Densmore et al.,                                    ¼ KD Dh                       ð1Þ
                                                                                           @t
2004, 2007] show models that produce faceted spurs, but
they do not discuss this precise topic.                          where D is the Laplace operator, h is the elevation, t is time
  [4] Densmore et al. [1998] studied the evolution of            and KD is the diffusion coefficient. Different diffusion
normal fault-bounded mountains while focusing on the             coefficients can be used for the bedrock and regolith. Mass

                                                            2 of 13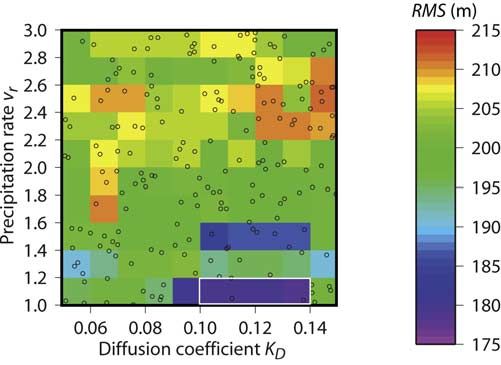
B05403                           PETIT ET AL.: NUMERICAL MODELING OF FACETED SPURS                                       B05403

conservation is verified by the computation of the diffusive       [Whittaker et al., 2007]. The assumption of uniform
flux, qD:                                                          precipitation rate is consistent with the relatively small
                                                                   catchment areas (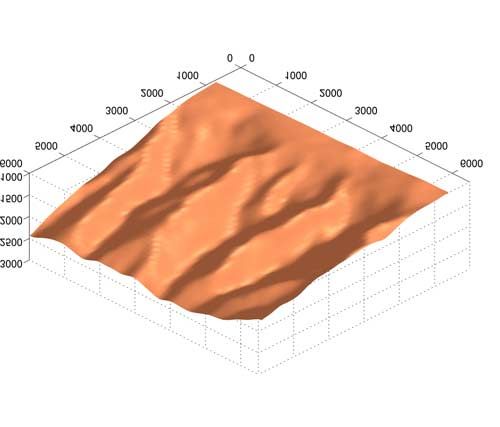
B05403                         PETIT ET AL.: NUMERICAL MODELING OF FACETED SPURS                                           B05403

                                                                  1996; Densmore et al., 1998; Ellis et al., 1999] and
                                                                  correspond to a wide range of scarp shapes. Note, however,
                                                                  that the value of the diffusion coefficient is model-
                                                                  dependent and cannot be compared directly with field
                                                                  measurements. For a given precipitation rate, when diffu-
                                                                  sion is high and channel bedrock is barely erodible (high Lf
                                                                  and/or low vr), the scarp is smoothed and not incised. When,
                                                                  instead, the substratum is easily eroded and diffusion is
                                                                  limited, numerous channels develop and the fault scarp
                                                                  becomes deeply incised (Figure 3). Between these two
                                                                  end-member cases, diffusion and incision compete to pro-
                                                                  duce various scarp shapes, including faceted spurs. The
                                                                  latter are found to develop for relatively low diffusion
                                                                  coefficients (KD 0.2 m2/a) and a moderately high incision
                                                                  rate due either to a high precipitation rate or to high
                                                                  erodibility of the substrate. The sensitivity tests summarized
                                                                  in Figure 3 allow us to determine a characteristic dimen-
                                                                  sionless diffusion/incision ratio, f, for which faceted spurs
                                                                  can develop:

                                                                                        f ¼ 106 KD Lf =ðvr SÞ                  ð5Þ

                                                                  with S being the surface area of the model, implying that vrS
                                                                  is the total amount of water available for surface runoff (i.e.,
                                                                  for mechanical erosion) in the model space (S 30 km2).
                                                                    [13] Given the initially defined fault dip angle and slip
                                                                  rate and the chosen grid spacing, the f ratio suitable for
                                                                  faceted spur development ranges between 10 and 90
                                                                  (Figure 3). For f values lower than 9, both the scarp and
                                                                  the footwall upland are totally destroyed by river incision,
                                                                  whereas f values higher than 700 characterize smoothed
                                                                  scarps with few or no incised channels. For intermediate f
                                                                  values ranging between 100 and 360, the scarp can
                                                                  either be weakly incised when precipitation and diffusion
Figure 2. Schematic evolution of a faceted fault scarp            are low, or display rounded spurs if both precipitation and
based on a successful numerical model (see Animation 1            diffusion are higher. Finally, for f values between 40 and
and text for detailed commentary).                                100, the scarp can display either triangular or rounded
                                                                  facets depending on whether the diffusion is low or high,
erosion balances out tectonic footwall uplift. The number         respectively. The transition from one morphology to another
and shape of triangular facets also remains constant, as they     is progressive and spans a range of f values.
intersect progressively deeper levels of the footwall during
exhumation [Ellis et al., 1999]. The time necessary to reach      3.2. Tectonic Parameters
steady state varied between 0.7 and 1 Ma.                           [14] The influence of tectonic parameters (fault dip angle
                                                                  and slip rate) on the shape of triangular facets was also
3. Results of Parameter Sensitivity Tests                         tested. The fault dip angle was changed from 30 to 75° and
                                                                  the total fault slip rate from 0.25 to 1.5 mm/a, all such
3.1. Climatic Parameters
                                                                  changes producing different throw rates as a function of dip
  [12] We first tested the influence of erosion parameters on     angle. Three different erosion parameter sets were tested
the development of faceted spurs by successively changing         corresponding to f ratio values of 18, 36, and 72 (KD =
the diffusion coefficient KD, the effective precipitation rate,   0.05 m2/a, vr = 1 m/a, and Lf = 10 km; KD = 0.05 m2/a, vr =
vr, and the characteristic length scale Lf (Figure 3). The        1 m/a, and Lf = 20 km; KD = 0.1 m2/a, vr = 1 m/a, and
transport coefficient Kf equals 0.01. For this set of experi-     Lf = 20 km, respectively). Mean facet height was measured
ments, the fault is assumed to have a dip angle of 60°, a slip    as the difference in altitude between the fault trace and the
rate of 0.5 mm/a, and the model is run for 1.5 Ma. The            crest of the exhumed fault wall, and mean facet slope was
initial topography is a gentle (1°) slope in the same direction   defined perpendicularly to the fault between these two
as the fault dip, with a random white noise of 0.2 m of           points. Error bars correspond to the standard deviation
amplitude. The diffusion coefficient varies between 0.01          between the different values.
and 0.2 m2/a, the precipitation rate varies from 0.5 to 5 m/a       [15] Results are plotted as a function of throw rate and
and Lf ranges between 25 and 100 km (Figures 2 and 3). All        initial fault dip angle, for each of the three different f ratios
parameters are constant over the whole grid. These values         (Figure 4). The upper graphs on Figure 4 (facet slope)
are similar to those tested in previous studies with the same     evidence a strong dependence of facet slope on the throw
model formulation [see, e.g., Kooi and Beaumont, 1994,            rate for throw rates lower than 0.7 mm/a. In this part of the

                                                             4 of 13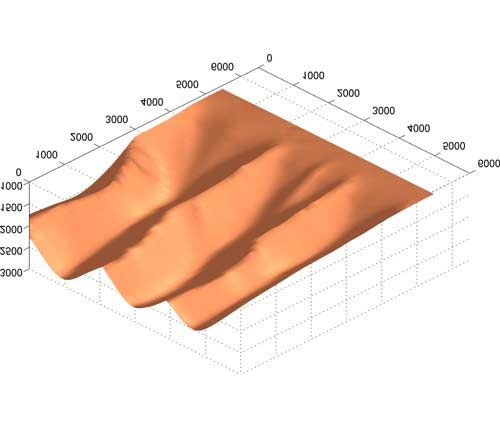
B05403                         PETIT ET AL.: NUMERICAL MODELING OF FACETED SPURS                                         B05403

         Figure 3. (top and middle) Testing the sensitivity of fault scarp morphology sensitivity to climate-
         related parameters KD, vr, and Lf. These tests demonstrate that faceted spurs develop for an f ratio ranging
         between 10 and 90. (bottom) The geometric symbols depict typical scarp morphologies as a function of f.

curve, a higher rate of exhumation produces a steeper slope,      of the fault plane creates large local slope changes that boost
and the relationship is linear. Surprisingly, for greater throw   erosional processes. As a result, mean scarp slope decreases.
rates (and/or for slope angles greater than 25°) the facet        Note that this behavior is identical whatever the f ratio
slope increases much more slowly. A possible explanation          (18, 36, and 72). Equally surprisingly, mean facet slope
for this behavior lies in the high sensitivity of diffusion to    does not seem to be primarily controlled by fault dip angle:
slope curvature: when fault slip is low, erosion is given         for given erosion parameters, fresh scarps will be more
enough time to smooth the scarp before a new one is               rapidly eroded when the normal faults dip more steeply than
created, and few breaks in slope are generated. Conversely,       at shallower dip angles, resulting in a similar facet slope
when fault throw rate is high, rapid exhumation of new parts      whatever the fault dip angle. Finally, facet height appears to

                                                             5 of 13
B05403 PETIT ET AL.: NUMERICAL MODELING OF FACETED SPURS B05403
Figure 4
6 of 13B05403 PETIT ET AL.: NUMERICAL MODELING OF FACETED SPURS B05403
be a linear function of throw rate irrespective of the fault dip Canyon complex [Bryant, 1988]; see Figure 5), (4) the
angle, the latter being taken into account in the computation impact of Pleistocene cirque glaciation on the scarp face is
of the throw rate (Figures 4b, 4d, and 4f). It is worth noting negligible (Figure 6), and (5) the geometry of the drainage
that the facet height value does not depend on the duration network is simple with a suite of short (5 km), strike-
of the experiment because the facet shape reaches a steady perpendicular perennial streams (Figure 6). Furthermore,
state after a relatively short growth stage (0.7 to 1 Ma). the catchments exhibit convex hypsometric curves (not
[16] The three different erosion parameter sets yield very illustrated) with hypsometric integrals (0.4 – 0.6) typical of
comparable results in terms of facet slopes and heights, young catchments. This configuration suggests that most of
especially for throw rates lower than 1 mm/a (Figure 4). As the drainage system is contemporaneous with fault devel-
explained above, this is likely to reflect a predominant role opment. We also avoided areas with conspicuous landslid-
of tectonic processes on facet shape; climatic conditions ing in order to maintain field parameters similar to basic
being subsidiary. For higher throw rates, the values are more model parameterizations. For that reason, the study area is
scattered and reflect an increasing importance of climatic situated to the north of the Farmington lobe of Quaternary
parameters, especially with respect to facet heights: both landslide deposits indicated on the 1:100,000 geologic map
high and low f ratios (72 and 18, respectively) predict of the Central Wasatch Front [Davis, 1983; Bryant, 1988].
smaller facets compared to an f ratio of 36. This suggests Sporadic interlayers of debris flow deposits within the
that, when erosion is dominated either by diffusion (larger f mountain front alluvial fans are reported on the quadrangle
ratio) or incision (lower f ratio), the dominant process is so geologic maps and suggest intermittently more turbid flow
intensely boosted by the tectonic signal that it dampens the conditions during the Pleistocene and Holocene, but fluvial
influence of the high throw rate on facet height more incision has remained the dominant process.
efficiently than when diffusion and incision balance each [ 19 ] From low-temperature thermochronology data,
other out (intermediate f ratios). Armstrong et al. [2004] inferred an age of 3.9– 6.4 Ma for
[17] In summary, this test shows that, in addition to the exhumation of the Weber fault segment scarp, and a
erosion parameters, the fault throw rate is the main tectonic mean vertical exhumation rate ranging between 0.2 and
control on faceted spur shape, here defined by height and 0.3 mm/a. The analysis of active facet heights led De Polo
fault-perpendicular topographic slope. Fault dip angle does and Anderson [2000] to infer a mean throw rate of
not seem to exert such a strong influence on either facet 0.8 mm/a on the Weber fault segment. Depending on
height or facet mean slope. the assumed fault dip (45 or 60° for instance), these values
correspond to horizontal slip rates of 0.4 to 0.8 mm/a. A
4. Application: The Wasatch Fault comprehensive study of the morphology of faceted spurs
has also been carried out by Zuchiewicz and McCalpin
4.1. Fault Geometry and Slip Rate
[2000]. On the Weber segment, these authors measured
[18] The Wasatch Fault is the longest active normal fault mean facet heights of 570 ± 100 m, and a mean slope of 20 ±
in the United States, and is located at the junction between 2°. From the graphics shown on Figure 4, this would
the Colorado plateau and the Basin and Range system, in correspond to throw rates of 0.6 ± 0.15 mm/a. These values
Utah (Figures 5 and 6). It is delineated by triangular facets are only indicative as the erosion parameters chosen for the
and is made up of several 50 km long segments [e.g., sensitivity tests shown on Figure 4 might not correspond to
Machette et al., 1991; Armstrong et al., 2004]. The tectonic the Wasatch Fault climatic setting. However, the inferred
characteristics of the Wasatch Fault (Table 1) are well slip rate is quite consistent with, though slightly lower than,
constrained by a large number of studies that have defined the one found by De Polo and Anderson [2000]. The
its dip, long- or short-term slip rates, earthquake recurrence geologic cross section of the Wasatch front in the Weber
intervals, and locking depth [see, e.g., Machette et al., 1991; segment shows a total throw of 4000 m (Figure 5 after
McCalpin and Nishenko, 1996; De Polo and Anderson, Hintze [1974] (modified by G. C. Willis, 2005) and Yonkee
2000; Mattson and Bruhn, 2001; Malservisi et al., 2003; and Lowe [2004]). Considering the age of exhumation
Armstrong et al., 2004]. In this study, we try to assess the given by Armstrong et al. [2004], this yields a throw rate
average long-term erosion parameters likely to have pre- of 0.6 to 1 mm/a.
vailed during the growth of the Wasatch Fault scarp. We [20] Numerical models of scarp degradation led Mattson
focus on the central portion of the Weber segment of the and Bruhn [2001] to propose a short-term (10 to 100 ka)
Wasatch Fault, close to the Great Salt Lake, because (1) its total slip rate ranging between 1 and 2 mm/a for the Weber
tectonic parameters are well constrained, (2) both its surface segment (i.e., 0.7 to 1.4 mm/a of horizontal extension and
trace and the drainage divide are linear, largely parallel to 0.7 to 1.7 mm/a of uplift with the previously assumed fault
one another (Figure 6), and thus closely match our model dip angles). Nelson and Personius [1993] described the
geometry, (3) its lithology is homogeneous (quartz monzo- geometry of recent scarps on the Weber segment in great
nite gneiss corresponding to the Precambrian Farmington detail. From their study, the mean total fault slip rate on this
Figure 4. Effect of tectonic parameters (fault throw rate and dip angle) on (a, c, and e) the mean slope and (b, d, and f)
height of faceted spurs, for three different erosion conditions (f = 18, 36, and 72, respectively, from left to right). Dashed
line depicts inferred relationship between tectonic parameters and facet shape. For extreme values of throw rates and fault
dip angles, some models succumbed to numerical instabilities and outputs are not illustrated. Orange rectangles represent
mean facet slope (Figures 4a, 4c, and 4e) and height (Figures 4b, 4d, and 4f) values for the Wasatch fault according to
Zuchiewicz and McCalpin [2000] and also mention the corresponding throw rate.
7 of 13B05403 PETIT ET AL.: NUMERICAL MODELING OF FACETED SPURS B05403
segment is about 1 ± 0.5 mm/a, and the earthquake modeled the displacements measured by GPS data across
recurrence interval is about 1200 ± 900 years. This value the Wasatch Fault by a 45° dipping normal fault in a 10 km
is roughly similar to the one found by McCalpin and thick elastic layer lying above a viscoelastic half-space.
Nishenko [1996] based on fault trench analyses (1782 ± Their model yielded instantaneous horizontal extension
102 years). Characteristic earthquakes are assumed to have rates as high as 3.0 to 4.5 mm/a, which is much higher
a mean magnitude of 7. Finally, Malservisi et al. [2003] than long-term slip rates obtained by the other methods.
[21] In summary, with the exception of GPS-based mod-
els, which predict a much higher value, previous studies of
the Weber fault segment estimate a mean long-term total
slip rate of about 0.75 ± 0.45 mm/a. Assuming a mean
segment length of 50 km, a downdip width of about 15 km
and a mean coseismic slip of 1 m, this slip rate corresponds
to a characteristic earthquake of magnitude 7 every 500 to
1500 years, which is in good agreement with observed
recurrence intervals. On the basis of those studies, the throw
rate is thus estimated to lie within the 0.3 –1 mm/a bracket
depending on the assumed fault dip angle (45 or 60°), which
is only a crude estimate. Our model allows us to narrow the
range of acceptable throw rates to 0.45 – 0.75 mm/a
(Figure 4). Clearly, such estimates do not take into account
possible temporal variations of the slip and throw rates,
which are beyond the resolution of our model.
4.2. Inversion of Climatic Parameters
[22] Here we test our model on the Weber scarp in order
to retrieve the mean values of climatic parameters (i.e., KD,
Lf, and vr) that would have prevailed during its develop-
ment. On the basis of the previously presented tectonic
constraints, we assume the following fault characteristics:
50 km length, 10 km locking depth, 45° dip, vertical slip
rate of 0.6 mm/a (according to our estimates, see Figure 4),
fault age of 5 Ma. A common difficulty in surface process
modeling is to define an objective ranking of the output
models (see Dietrich et al. [2003] on visual realism and the
choice of morphologic properties when testing SPMs). In
this study, we chose to implement a more objective evalu-
ation of the quality of fit by computing a root-mean-square
(RMS) residual, defined as the mean error between the
reference and computed 2.5-D topography:
vffiffiffiffiffiffiffiffiffiffiffiffiffiffiffiffiffiffiffiffiffiffiffiffiffiffiffiffiffiffiffiffiffiffiffiffiffiffiffiffiffiffiffiffiffiffiffiffi
uN
uP
u ðhobsðx;yÞ hcompðx;yÞ Þ2
t1
RMS ¼ ð6Þ
N
Here, the reference topography was defined by the 90 m
Shuttle Radar Topography Mission digital elevation grid,
resampled to a 100 100 m pixel size in order to match the
model grid dimensions. In order to avoid unwanted noise
from the upstream drainage catchments interfering with
Figure 5. (top) Location map and geologic setting of
study area in the Wasatch Mountains, Utah [after Hintze,
1974]. The chosen model test area (Weber segment, see also
Figure 6) corresponds to the most homogeneous lithological
continuum of the Wasatch (Precambrian gneiss), and one of
the straightest segments of the mountain front. Tectonic
subdivison of the Wasatch Fault into segments (delimited by
horizontal dashed lines) after Machette et al. [1991].
(bottom) Cross section AB (between points A and B in
Figure 5 (top)) and estimates of the total throw (interpreted
after Yonkee and Lowe [2004]).
8 of 13B05403 PETIT ET AL.: NUMERICAL MODELING OF FACETED SPURS B05403
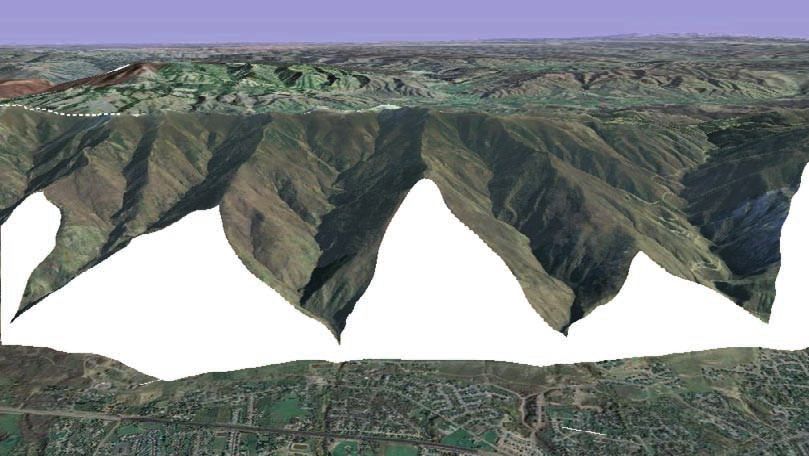
Figure 6. View of the study area (Weber segment) generated from ortho images draped over a USGS
digital elevation model. Ortho image ground sample distance (GSD) of 1 m (source is National
Agricultural Imagery Program, 2006). NAIP quarter quadrangles are rectified to the UTM coordinate
system NAD83. The USGS digital elevation model (GSD = 10 m) is a 1-degree DEM (3 by 3 arc sec data
spacing). The 1-degree DEM consists of a regular array of elevations referenced horizontally on the
geographic (latitude/longitude) coordinate system of the WGS-84 and converted to the UTM coordinate
system NAD83. Additional source is the Utah GIS Portal. The main drainage divide trending parallel to
the fault strike is indicated as a, main facet-bounding catchments; and b, older fault-perpendicular
catchments (see Figure 2 and Animation 1).
error computations relevant to scarp morphology, the RMS tions for the 5 Ma period considered here. No clear
calculation was restricted to a narrow, strike-parallel swath minimum, however, appeared for Lf. Indeed, since Lf
of the topographic grid covering the scarp and its triangular predominantly controls the river length scale, error maps
facets. Without any other constraints, the modeled river computed close to the river mouth will not be sensitive to
network depends on the random noise superimposed on the variations in Lf variations. Other synthetic tests and a visual
initial topography. Any 2.5-D error will therefore be estimation of the topographic resemblance between the
affected by slight mismatches in river channel locations model and reference topographies tend to indicate that
more than by the morphology of the fault scarp. To low values of Lf (around 15 km) might provide a better fit
overcome this problem, initial model conditions involved to the data. The mean annual effective rainfall (vr) value of
grooving the model grid topography (a 1° slope in the same 1.2 m/a is also realistic for the Weber segment, where
direction as the fault dip) to depths of just a few meters at 1961– 1990 annual rainfall totals on the mountain front are
locations dictated by observed stream spacing in the digital given as 1 – 1.5 m (http://www.nationalatlas.gov/printable/
elevation model of the Weber segment. Such a procedure images/pdf/precip/pageprecip_ut3.pdf). The presence of
forces the rivers to flow in channels positioned in those large lakes during the colder Pleistocene epochs suggests
predefined locations, with the result that model outputs wetter climates, and it has been argued that the lakes were
generate models that are objectively realistic in terms of formed both because of lower evaporation rates relating to
stream spacing with respect to the Weber segment lower mean temperatures [Hostetler et al., 1994; Kaufman,
topography. Any RMS error is thus unlikely to be 2003] and because of greater precipitation rates [Benson
contributed by channel offsets between the model and the and Thompson, 1987; Oviatt, 1997]. Humid climates do not
reference topographies. These initial surface conditions thus systematically result in large runoff rates (i.e., large vr).
defined only control the resulting facet width. We next Humid climates may also promote denser vegetation, deeper
performed a Monte Carlo inversion consisting of 190 runs, weathering, and the rounding of hillslope profiles as a
sampling random values of KD , Lf and vr between 0.05 and consequence of enhanced slope diffusion [e.g., Kooi and
0.15 m2/a, 15 and 35 km and 1 and 3 m/a, respectively. Beaumont, 1994]. Because the climatic parameter, vr, is a
[23] RMS results for the 190 tests were interpolated to proxy for bedrock erosional response to climatic conditions
generate a continuous RMS map for different values of KD rather than a direct expression of specific weather systems
and vr (Figure 7), with Kf = 0.01. The map shows a clear and past atmospheric conditions, the relatively high diffu-
RMS minimum for 0.11 KD 0.13 m2/a and vr = 1.1 m/a. sion coefficient obtained for the Wasatch range might thus
This set of values represents the average erosion condi-
9 of 13B05403 PETIT ET AL.: NUMERICAL MODELING OF FACETED SPURS B05403
Table 1. Tectonic Characteristics of the Wasatch Fault Zone From Previous Studiesa
TSR (mm/a) HSR (mm/a) VSR (mm/a) a (deg) H (m) S (deg) ER (years) References
0.5 – 1.5 0.2 – 1.1 0.3 – 1.3 45 – 60 1200 ± 900 Nelson and Personius [1993]
45 – 60 1787 ± 102 McCalpin and Nishenko [1996]
0.9 – 1.1 0.4 – 0.8 0.8 45 – 60 De Polo and Anderson [2000]
0.7 – 1.1 0.4 – 0.8 0.45 – 0.75 45 – 60 470 – 670 18 – 22 Zuchiewicz and McCalpin [2000]
1–2 0.5 – 1.4 0.7 – 1.7 45 – 60 Mattson and Bruhn [2001]
4.2 – 6.4 3 – 4.5 3 – 4.5 45 Malservisi et al. [2003]
0.2 – 0.4 0.1 – 0.3 0.2 – 0.3 45 – 60 Armstrong et al. [2004]
a
Age is 3.9 – 6.4 Ma. TSR, HSR, and VSR refer to total, horizontal, and vertical slip rates, respectively; a is the fault dip angle, H is the facet height, S is
the facet slope, ER is the earthquake recurrence interval. Numbers in bold correspond to published values, and numbers in italics are those that could be
deduced from the latter.
reflect the effect of wetter intervals that prevailed during formation of faceted scarps is therefore not strongly limited to
enhanced glacial conditions. particular climatic conditions. This conclusion is supported
[24] Overall, the optimal RMS parameterization corre- by the fact that faceted spurs and scarps occur in a wide range
sponds to an f value band of 46 to 54, which falls well of climatic settings around the world.
within the range required for the development of triangular [27] Tests performed using different tectonic parameters
facets as proposed in Figures 2 and 3. Figure 4 tends to (fault dip angle and slip rate) and three different f ratios have
indicate that the facet height/throw rate line has a steeper also indicated that the fault dip angle does not significantly
slope for high f values (36 or 72) than for low ones (18). As affect mean facet height or slope. Both attributes are instead
the inversion is very sensitive to facet height (which will predominantly controlled by the throw rate, a finding that is
strongly affect the RMS value) it is likely that an error in the at odds with the conclusions of Ellis et al. [1999]. However,
fault throw rate (whatever its sense) will bias the result f ratios corresponding to either dissection-dominated or
toward larger f values, i.e., larger diffusion coefficient of diffusion-dominated erosion seem to dampen the influence
characteristic length scale, or lower precipitation rates. The of the fault throw rate on facet height. Fault dip angle
resulting topography (Figure 8) depicts 2 km wide, 560 m obviously has a strong influence on facet height, as it
high triangular facets with an average slope of 23°, hence controls the amount of vertical uplift for a given extension
very similar to those observed on the Weber segment scarp rate. However, its long-term influence on facet slope is
[Zuchiewicz and McCalpin, 2000]. The facet-perpendicular minor because the facet almost always retreats back from
topographic profile is also well reproduced (Figure 8c). The the fault plane and its gradient declines, except at the scarp
total sediment thickness accumulated during the 5 Ma time foot where rejuvenation by the last few earthquakes has
span (about 400 m) underestimates the actual 2000 m of occurred. The models thus indicate that steep fault planes
sediment present in the Great Salt Lake basin at the foot of will initially produce steep scarps in which slope declines
the escarpment [Yonkee and Lowe, 2004]. However, our
results cannot be compared with the total Cenozoic sedi-
mentary sequence of the Wasatch front basin because the
model accounts neither for the real basin configuration
(geometry, sediments sources, subsidence and flexure and
accommodation space), nor for the occurrence of synsedi-
mentary faults within the basin.
5. Discussion
[25] We developed a simple coupled SPM and tectonic
model which allows us to determine the conditions of growth
of faceted spurs at normal fault scarps. Our sensitivity tests
indicate that a fault scarp bears faceted spurs only when
diffusion and incision processes balance out (Figure 3). In
other conditions, the scarp is either smoothed or dissected.
[26] Other tests performed allow defining a characteristic
f diffusion/incision ratio that determines the climatic con-
ditions suitable for the development of faceted spurs. For a Figure 7. Results of a Monte Carlo inversion for the
model surface of 30 km2, suitable conditions are met effective precipitation rate (vertical axis) and diffusion
when f ranges between 10 and 90. Figure 3 shows that this coefficient (horizontal axis) on the Weber segment of the
theoretical range of values covers a wide spectrum of the Wasatch Fault. Color scale refers to the root-mean-square
variables KD , Lf , and vr . For example, we find that f = 36 is residual (RMS in meters) between the observed and
valid for settings where vr values can be anything between modeled topography. Open circles indicate the parameters
0.5 (arid) and 5 m/a (hyperhumid) while letting KD and Lf tested. A visible minimum (blue color, circled) is found for
vary accordingly. Similar conclusions can be drawn when f = low effective precipitation rates (1.1 m/a) and relatively
72 or f = 89. This suggests that similar landforms are produced high (0.12 m2/a) diffusion coefficients (best fitting models
when rainfall varies by 1 order of magnitude, and that the are delineated by the white rectangle).
10 of 13B05403 PETIT ET AL.: NUMERICAL MODELING OF FACETED SPURS B05403
rapidly because of erosion, whereas low-dipping fault
planes will produce more gently sloped scarps where
erosion is accordingly less active, resulting in facet slope
angles that remain similar to the fault dip.
[28] It follows that with even a rough approximation of
the average climatic parameters (rainfall and diffusion
coefficient), the measurement of facet slopes and heights
can help estimate an unknown throw rate [Ganas et al.,
2005]. Conversely, when average fault dip angle and slip
rates are known, it is possible to recover the approximate
rainfall parameters that prevailed during scarp evolution by
inversion of the 2.5-D scarp topography. A Monte Carlo
inversion on the Weber segment of the Wasatch Fault shows
that the 5 Ma long development of this fault scarp has been
dominated by a low effective precipitation rate (1 m/a)
and a moderate diffusion coefficient (0.13 m2/a), its long-
term throw rate of 0.6 mm/a being determined from
average facet height prior to the inversion. The 2.5-D scarp
shape and the fault-perpendicular profile are successfully
retrieved, though the amount of sediments deposited at the
foot of the scarp cannot be directly compared with the late
Cenozoic sediment thickness inferred from geologic cross
section [Yonkee and Lowe, 2004].
[29] The limitations of our model arise in part from the
use of numerical parameters that are not easy to measure in
the field: the f ratio, for example, depends upon parameters
derived from incision and diffusion laws, which cannot be
measured directly. The f ratio is also grid-dependent because
the amount of incision/deposition and the diffusion rate
depend on the grid spacing. This, however, can be readily
tested by varying grid cell size in model grids and by using
reference topographies corresponding to different DEM
resolutions. The assumption that flexural isostatic response
of the lithosphere is negligible remains valid for a small area
close to the fault, such as that studied here for the Weber
segment, but would not hold true on the scale of a whole
mountain range and its adjacent basin, hundreds of kilo-
meters squared. Isostasy can readily be included in models
when appropriate. Moreover, the inverted diffusion coeffi-
cient and effective precipitation rate only represent a long-
term (Pliocene to Pleistocene) average of the erosional
conditions that prevailed during the development of this
segment of the Wasatch Fault. Depending on the resolution
of available data, a higher resolution model could be used to
obtain greater precision on facet evolution, for example as a
function of glacial and interglacial episodes, and incorporate
temporal variations in slip rate responsible for transient
landscape signatures.
[30] Our study has focused on steady state topographic
systems, i.e., where tectonics and erosion are in equilibrium.
Transient landscapes, however, also exist in active footwall
uplands, and useful tectonic information can be retrieved
from drainage patterns and river long profiles to evidence
this [e.g., Whittaker et al., 2008]. Nevertheless, the steady
state assumption allows us to constrain the mean fault throw
Figure 8. (a) Observed and (b) modeled 2.5-D topography rate from facet heights and slopes. In the case of a transient
for the best fitting parameters determined from the Monte topography, this would not be possible. Our model also does
Carlo inversion (see Figure 7). (c) Observed and modeled not include any considerations on the history of fault
facet-perpendicular profiles (solid line in Figure 8b growth, interaction and linkage. In the Wasatch worked
indicates profile location). example, data on these aspects do not exist. However, as
argued by Ellis et al. [1999], the steady state configuration
that we are concerned with is only weakly dependent upon
11 of 13B05403 PETIT ET AL.: NUMERICAL MODELING OF FACETED SPURS B05403
the initial stages of fault evolution. As a result, treating the Braun, J., and M. Sambridge (1997), Modelling landscape evolution on
geologic time scales: A new method based on irregular spatial discretiza-
kinematics of fault initiation and linkage as a black box is tion, Basin Res., 9, 27 – 52, doi:10.1046/j.1365-2117.1997.00030.x.
not detrimental to the value of the model as an experimental Bryant, B. (1988), Geology of the Farmington Canyon complex, Wasatch
tool in tectonic geomorphology. Mountains, Utah, geological map, scale , 1:50,000, U.S. Geol. Surv. Prof.
Pap., 1476, 54 pp.
Codilean, A. T., P. Bishop, and T. B. Hoey (2006), Surface process models
6. Conclusion and the links between tectonics and topography, Prog. Phys. Geogr., 30,
307 – 333, doi:10.1191/0309133306pp480ra.
[31] We have presented a numerical surface process Cotton, C. A. (1950), Tectonic scarps and fault valleys, Geol. Soc. Am.
model and shown how it can be used as a tool for Bull., 61, 717 – 758, doi:10.1130/0016-7606(1950)61[717:TSAFV]2.0.
CO;2.
constraining the climatic and tectonic parameters that con- Coulthard, T. (2001), Landscape evolution models: A software review,
trol the development of faceted spurs at normal fault scarps. Hydrol. Process., 15, 165 – 173, doi:10.1002/hyp.426.
Sensitivity tests allowed us to define a dimensionless ratio Cowie, P. A., M. Attal, G. E. Tucker, A. C. Whittaker, M. Naylor, A. Ganas,
and G. P. Roberts (2006), Investigating the surface process response to
of erosion, f, for which triangular faceted spurs, as opposed fault interaction and linkage using a numerical modelling approach, Basin
to any other alternative range front morphology, can develop. Res., 18, 231 – 266.
The study evidences a strong dependence of facet slope Davis, F. D. (1983), Geologic map of the central Wasatch Front, Utah, Map
44-A, Utah Geol. and Miner. Surv., Salt Lake City.
angle on throw rate for throw rates between 0.4 and 0.7 mm/a. Densmore, A. L., M. A. Ellis, and R. S. Anderson (1998), Landsliding and
Facet height also appears to be linearly dependent upon the the evolution of normal-fault-bounded mountains, J. Geophys. Res., 103,
fault throw rate. Model performance was tested on the 15,203 – 15,219, doi:10.1029/98JB00510.
Wasatch Fault, using topographic, geologic and seismologic Densmore, A. L., N. H. Dawers, S. Gupta, R. Guidon, and T. Goldin
(2004), Footwall topographic development during continental extension,
data for calibration purposes. Overall, results demonstrate the J. Geophys. Res., 109, F03001, doi:10.1029/2003JF000115.
ability of our model to estimate normal fault throw rates from Densmore, A. L., P. A. Allen, and G. Simpson (2007), Development and
the height and slope of triangular facets, and to retrieve the response of a coupled catchment fan system under changing tectonic and
climatic forcing, J. Geophys. Res., 112, F01002, doi:10.1029/
average long-term diffusion and incision parameters that 2006JF000474.
prevailed during scarp evolution. Despite the limitations De Polo, C. M., and J. G. Anderson (2000), Estimating the slip rates of
examined in the Discussion, our model suggests that active normal faults in the Great Basin, USA, Basin Res., 12, 227 – 240,
doi:10.1046/j.1365-2117.2000.00131.x.
geomorphic markers such as triangular faceted spurs can help Dietrich, W. E., D. G. Bellugi, L. S. Sklar, J. D. Stock, A. M. Heimsath, and
to determine the long-term throw rate of active faults at J. J. Roering (2003), Geomorphic transport laws for predicting landscape
mountain fronts. More detailed information on the fault slip form and dynamics, in Prediction in Geomorphology, Geophys. Monogr.
rate and slip direction could be obtained using a model Ser., vol. 135, edited by P. R. Wilcock and R. I. Iverson, pp. 103 – 113,
AGU, Washington, D. C.
involving mixed normal and strike-slip motions. Ellis, M. A., A. L. Densmore, and R. S. Anderson (1999), Development of
mountainous topography in the Basin and Range, USA, Basin Res., 11,
[32] Acknowledgments. The authors are grateful to Richard Arculus 21 – 41, doi:10.1046/j.1365-2117.1999.00087.x.
(Editor), Paul Bishop, Alex Whittaker, and one anonymous reviewer for Ganas, A., S. Pavlides, and V. Karastathis (2005), DEM-based morphome-
their constructive remarks which helped us to improve the final version of try of range-front escarpments in Attica, central Greece, and its relation to
this manuscript. fault slip rates, Geomorphology, 65, 301 – 319, doi:10.1016/j.
geomorph.2004.09.006.
Gilchrist, A. R., H. Kooi, and C. Beaumont (1994), The post-Gondwana
References geomorphic evolution of southwestern Africa: Implications for the
Allen, P. A., and A. L. Densmore (2000), Sediment flux from an uplifting controls on landscape development from observations and numerical
fault block, Basin Res., 12, 367 – 380, doi:10.1046/j.1365-2117. experiments, J. Geophys. Res., 99, 12,211 – 12,228, doi:10.1029/
2000.00135.x. 94JB00046.
Anderson, R. S. (1994), Evolution of the Santa Cruz Mountains, California, Goldsworthy, M., and J. Jackson (2000), Active normal fault evolution in
through tectonic growth and geomorphic decay, J. Geophys. Res., 99, Greece revealed by geomorphology and drainage patterns, J. Geol. Soc.,
20,161 – 20,174, doi:10.1029/94JB00713. 157, 967 – 981.
Armijo, R., H. Lyon-Caen, and D. Papanastassiou (1991), A possible nor- Hamblin, W. K. (1976), Patterns of displacement along the Wasatch
mal-fault rupture of the 464 BC Sparta earthquake, Nature, 351, 137 – Fault, Geology, 4, 619 – 622, doi:10.1130/0091-7613(1976)42.0.CO;2.
Armstrong, P. A., A. R. Taylor, and T. A. Ehlers (2004), Is the Wasatch fault Hintze, L. F. (1974), Geologic map of Utah, scale , 1:2,500,000, Utah Geol.
footwall (Utah, United States) segmented over million-year time scales?, Surv., Salt Lake City.
Geology, 32, 385 – 388, doi:10.1130/G20421.1. Hostetler, S. W., F. Giorgi, G. T. Bates, and P. J. Bartlein (1994), Lake –
Attal, M., G. E. Tucker, A. C. Whittaker, P. A. Cowie, and G. P. Roberts atmosphere feedbacks associated with paleolakes Bonneville and Lahon-
(2008), Modeling fluvial incision and transient landscape evolution: In- tan, Science, 263, 665 – 668, doi:10.1126/science.263.5147.665.
fluence of dynamic channel adjustment, J. Geophys. Res., 113, F03013, Houdry, F. (1994), Mécanismes de l’extension continentale dans le rift
doi:10.1029/2007JF000893. Nord-Baı̈kal, Sibérie: Contraintes des données d’imagerie SPOT, de ter-
Beaumont, C., P. Fullsack, and J. Hamilton (1992), Erosional controls of rain, de sismologie et de gravimétrie, Ph.D. thesis, 345 pp., Univ. Pierre
active compressional orogens, in Thrust Tectonics, edited by K. R. et Marie Curie, Paris.
McClay, pp. 1 – 18, Chapman and Hall, New York. Kaufman, D. S. (2003), Amino acid paleothermometry of Quaternary os-
Benedetti, L., P. Tapponnier, G. C. P. King, and L. Piccardi (1998), Surface tracodes from the Bonneville Basin, Utah, Quat. Sci. Rev., 22, 899 – 914,
rupture of the 1857 southern Italian earthquake?, Terra Nova, 10, 206 – doi:10.1016/S0277-3791(03)00006-4.
210, doi:10.1046/j.1365-3121.1998.00189.x. Kooi, H., and C. Beaumont (1994), Escarpment evolution on high-elevation
Benson, L., and R. S. Thompson (1987), The physical record of lakes in the rifted margins: Insights derived from a surface processes model that
Great Basin, in The Geology of North America, vol. K3, North American combines diffusion, advection and reaction, J. Geophys. Res., 99,
and Adjacent Oceans During the Last Deglaciation, edited by W. F. 12,191 – 12,210, doi:10.1029/94JB00047.
Ruddiman and H. E. Wright Jr., pp. 241 – 260, Geol. Soc. of Am., Kooi, H., and C. Beaumont (1996), Large-scale geomorphology: Classical
Boulder, Colo. concepts reconciled and integrated with contemporary ideas via surface
Birot, P. (1958), Morphologie structurale, vol. 1, 177 pp., Presses Univ. de processes model, J. Geophys. Res., 101, 3361 – 3386, doi:10.1029/
Fr., Paris. 95JB01861.
Braun, J. (2006), Recent advances and current problems in modelling sur- Lague, D., A. Crave, and P. Davy (2003), Laboratory experiments simulat-
face processes and their interaction with crustal deformation, in Analogue ing the geomorphic response to tectonic uplift, J. Geophys. Res.,
and Numerical Modelling of Crustal-Scale Processes, edited by S. J. H. 108(B1), 2008, doi:10.1029/2002JB001785.
Buiter and G. Schreurs, Geol. Soc. Spec. Publ., vol. 253, pp. 307 – 325.
12 of 13B05403 PETIT ET AL.: NUMERICAL MODELING OF FACETED SPURS B05403
Machette, M. N., S. F. Personius, A. R. Nelson, D. P. Schwartz, and W. R. San’kov, V., J. Déverchère, Y. Gaudemer, F. Houdry, and A. Filippov
Lund (1991), The Wasatch fault zone, Utah – segmentation and history of (2000), Geometry and rate of faulting in the North Baikal rift, Siberia,
Holocene earthquakes, J. Struct. Geol., 13, 137 – 139, doi:10.1016/0191- Tectonics, 19, 707 – 722, doi:10.1029/2000TC900012.
8141(91)90062-N. Stock, J., and W. E. Dietrich (2003), Valley incision by debris flows:
Malservisi, R., T. H. Dixon, P. C. La Femina, and K. P. Furlong (2003), Evidence of a topographic signature, Water Resour. Res., 39(4), 1089,
Holocene slip rate of the Wasatch fault zone, Utah, from geodetic data: doi:10.1029/2001WR001057.
Earthquake cycle effects, Geophys. Res. Lett., 30(13), 1673, doi:10.1029/ Wallace, R. E. (1978), Geometry and rates of change of fault-related fronts,
2003GL017408. north-central Nevada, J. Res. U. S. Geol. Surv., 6, 637 – 650.
Mattson, A., and R. L. Bruhn (2001), Fault slip rates and initiation age Whittaker, A. C., P. A. Cowie, M. Attal, G. E. Tucker, and G. P. Roberts
based on diffusion equation modelling: Wasatch fault zone and eastern (2007), Bedrock channel adjustment to tectonic forcing: Implications for
Great basin, J. Geophys. Res., 106, 13,739 – 13,750, doi:10.1029/ predicting river incision rates, Geol. Soc. Am. Bull., 35, 103 – 106.
2001JB900003. Whittaker, A. C., M. Attal, P. A. Cowie, G. E. Tucker, and G. P. Roberts
McCalpin, J. P., and S. P. Nishenko (1996), Holocene paleoseismicity, (2008), Decoding temporal and spatial patterns of fault uplift using tran-
temporal clustering, and probabilities of future large (M > 7) earthquakes sient river long profiles, Geomorphology, 100, 506 – 526, doi:10.1016/
on the Wasatch fault zone, Utah, J. Geophys. Res., 101, 6233 – 6253, j.geomorph.2008.01.018.
doi:10.1029/95JB02851. Wobus, C., K. X. Whipple, E. Kirby, N. Snyder, J. Johnson, K. Spyropolou,
Merritts, D., and M. Ellis (1994), Introduction to special section on tec- B. Crosby, and D. Sheehan (2006), Tectonics from topography: Proce-
tonics and topography, J. Geophys. Res., 99, 12,135 – 12,141, dures, promises and pitfalls, in Tectonics, Climate and Landscape Evolu-
doi:10.1029/94JB00810. tion, edited by S. D. Willett et al., Spec. Pap. Geol. Soc. Am., vol. 398,
Meyer, B., R. Armijo, and D. Dimitrov (2002), Active faulting in SW pp. 55 – 74.
Bulgaria: Possible surface rupture of the 1904 Struma earthquake, Geo- Yonkee, A., and M. Lowe (2004), Geologic map of the Ogden 7.5-minute
phys. J. Int., 148, 246 – 255, doi:10.1046/j.0956-540x.2001.01589.x. quadrangle, Weber and Davis counties, Utah, report, 46 pp., Utah Geol.
Nelson, A. R., and S. F. Personius (1993), Surficial geologic map of the Surv., Salt Lake City.
Weber segment, Wasatch Fault zone, Weber and Davis counties, Utah, Zuchiewicz, W. A., and J. P. McCalpin (2000), Geometry of faceted spurs
U.S. Geol. Surv. Misc. Invest. Ser., Map I-2199, 22 pp. on an active normal fault: Case study of the central Wasatch fault, Utah,
O’Callaghan, J. F., and D. M. Mark (1984), The extraction of drainage U.S.A., Ann. Soc. Geol. Poloniae, 70, 231 – 249.
networks from digital elevation data, Comput. Visual Graph. Image Pro-
cess., 28, 328 – 344.
Okada, Y. (1985), Surface deformation to shear and tensile faults in a half- N. Gonga-Saholiariliva and Y. Gunnell, Laboratoire de Géographie
space, Bull. Seismol. Soc. Am., 75, 1135 – 1154. Physique, UMR 8591, Université Paris VII, CNRS, Boı̂te 7001, 2 Place
Oviatt, C. G. (1997), Lake Bonneville fluctuations and global climate Jussieu, F-75251 Paris CEDEX 05, France.
change, Geology, 25, 155 – 158, doi:10.1130/0091-7613(1997)025< B. Meyer and C. Petit, ISTeP, UMR 7193, UPMC, CNRS, Tour 46-00
0155:LBFAGC>2.3.CO;2. E2, Boı̂te 129, 4 Place Jussieu, F-75252 Paris CEDEX, France.
(carole.mariani@upmc.fr)
J. Séguinot, LGIT, Université Joseph Fourier, BP 53, F-38041 Grenoble
CEDEX 9, France.
13 of 13You can also read