Runs of homozygosity and analysis of inbreeding depression
←
→
Page content transcription
If your browser does not render page correctly, please read the page content below
Journal of Animal Science, 2020, Vol. 98, No. 12, 1–11

                                                                        doi:10.1093/jas/skaa361
                                                                        Advance Access publication November 12, 2020
                                                                        Received: 12 June 2020 and Accepted: 7 November 2020
                                                                        Animal Genetics and Genomics

Animal Genetics and Genomics

                                                                                                                                     Downloaded from https://academic.oup.com/jas/article/98/12/skaa361/5979489 by U S Dept of Agriculture user on 03 August 2021
Runs of homozygosity and analysis of inbreeding
depression
Pattarapol Sumreddee,† Sajjad Toghiani,‡ El Hamidi Hay,|| Andrew Roberts,||
Samuel E. Aggrey,$,¶ and Romdhane Rekaya†,¶,**,1
†
 Department of Animal and Dairy Science, University of Georgia, Athens, GA 30602, ‡Beltsville Agricultural Research Center,
USDA Agricultural Research Service, Beltsville, MD 20705, ||Fort Keogh Livestock and Range Research Laboratory, USDA
Agricultural Research Service, Miles City, MT 59301, $Department of Poultry Science, University of Georgia, Athens, GA
30602, ¶Institute of Bioinformatics, University of Georgia, Athens, GA 30602, **Department of Statistics, University of Georgia,
Athens, GA 30602

Corresponding author: rrekaya@uga.edu
1

ORCiD numbers: 0000-0002-5090-728X (S. Toghiani); 0000-0002-4802-3792 (E. H. Hay); 0000-0001-8720-322X (A. Roberts).

Abstract
Pedigree information was traditionally used to assess inbreeding. The availability of high-density marker panels provides
an alternative to assess inbreeding, particularly in the presence of incomplete and error-prone pedigrees. Assessment of
autozygosity across chromosomal segments using runs of homozygosity (ROH) has emerged as a valuable tool to estimate
inbreeding due to its general flexibility and ability to quantify the chromosomal contribution to genome-wide inbreeding.
Unfortunately, the identification of ROH segments is sensitive to the parameters used during the search process. These
parameters are heuristically set, leading to significant variation in the results. The minimum length required to identify
an ROH segment has major effects on the estimation of inbreeding and inbreeding depression, yet it is arbitrarily set.
To overcome this limitation, a search algorithm to approximate mutation enrichment was developed to determine the
minimum length of ROH segments. It consists of finding genome segments with significant effect differences in trait means
between animals with high and low burdens of autozygous intervals with a specific length. The minimum length could
be determined heuristically as the smallest interval at which a significant signal is detected. The proposed method was
tested in an inbred Hereford cattle population genotyped for 30,220 SNPs. Phenotypes recorded for six traits were used
for the approximation of mutation loads. The estimated minimum length was around 1 Mb for yearling weight (YW) and
average daily gain (ADG) and 4 Mb for birth weight and weaning weight. These trait-specific thresholds estimated using the
proposed method could be attributed to a trait-dependent effect of homozygosity. The detection of significant inbreeding
effects was well aligned with the estimated thresholds, especially for YW and ADG. Although highly deleterious alleles are
expected to be more frequent in recent inbreeding (long ROH), short ROH segments (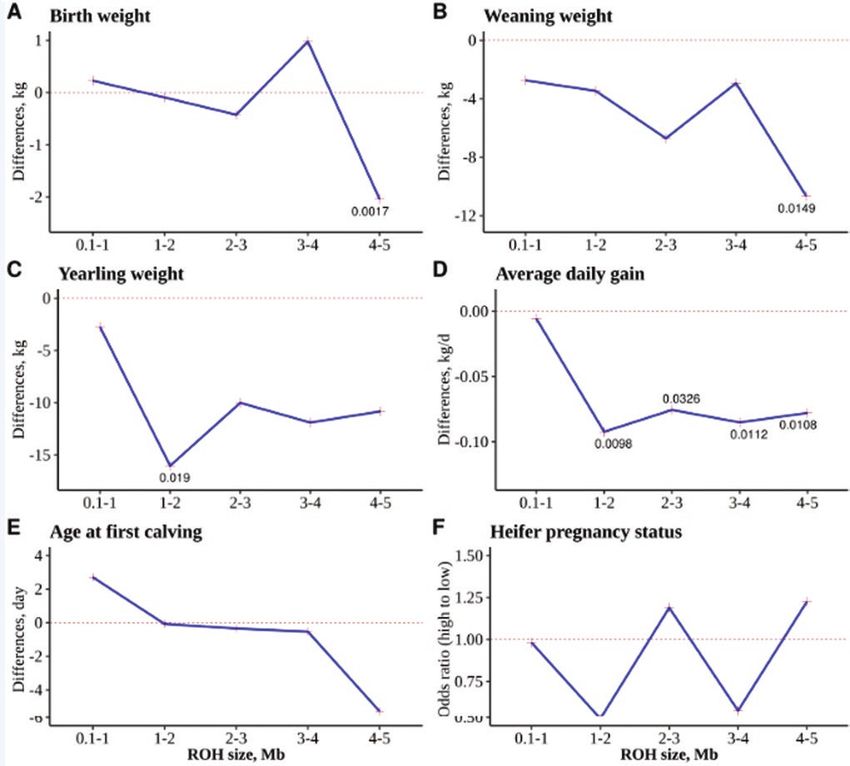
2   |   Journal of Animal Science, 2020, Vol. 98, No. 12

Abbreviations                                                            associated with rare diseases in dogs, Sams and Boyko (2019)
ADG                         average daily gain between weaning           were able to assess the minimum length of an ROH segment
                            and yearling                                 based on identifying enriched mutations for varying size
AFC                         age at first calving                         ROH tracts.
BW                          birth weight                                     Unfortunately, the actual mutation loads contributing to
FROH                        ROH-based inbreeding coefficient             inbreeding depression are seldom known in practice, especially
HMM                         hidden Markov model                          for complex traits. Thus, inferring mutational load from available
IBD                         identical by descent                         phenotypic information could be useful in assessing the
ROH                         runs of homozygosity                         minimum length threshold to declare an autozygous segment
SNP                         single-nucleotide polymorphism               as an ROH. Furthermore, understanding the genesis of ROH

                                                                                                                                                   Downloaded from https://academic.oup.com/jas/article/98/12/skaa361/5979489 by U S Dept of Agriculture user on 03 August 2021
WW                          weaning weight                               segments, the purging of deleterious mutations, and the effects
YW                          yearling weight                              of the latter would require the ability to discriminate between
                                                                         ancient and more recent inbreeding. However, thresholds to
                                                                         discriminate between short and long ROH segments are largely
Introduction                                                             unknown. Thus, the objectives of this study are to: 1) develop an
                                                                         approach to determine the minimum length of an autozygous
Inbreeding leads to an increase in autozygosity throughout               segment to be declared as an ROH and 2) assess the implications
the genome largely in the form of runs of homozygosity (ROH)             of the minimum length threshold on measuring inbreeding
resulting in an increased risk of homozygosity for deleterious           depression in a purebred Hereford beef cattle population.
alleles (Ku et al., 2011). These ROH would contribute to inbreeding
depression if they contain recessive deleterious alleles. Due to
their general flexibility and ability to quantify chromosomal and
segments contribution to genome-wide inbreeding, analysis of
                                                                         Materials and Methods
ROH has become a tool to estimate inbreeding and its impact              As this study was carried out using previously compiled data
on traits and a valuable alternative to the traditional pedigree-        and no live animal experiments were performed, therefore,
based approach, particularly in the presence of incomplete and           Animal Care and Use Committee approval was not required.
error-prone pedigrees (Cassell et al., 2003; Zhang et al., 2015a;
Curik et al., 2017; Sumreddee et al., 2019). Additionally, the length    Animals, phenotypes, and genotypes
of an ROH can be used to track the ontogeny of an autozygous             Data used in this study were collected on line 1 Hereford cattle
segment. Short ROH segments are likely to have risen from                herd maintained in isolation, at USDA-ARS, Fort Keogh Livestock
remote ancestors compared with long ROH segments. Thus, the              and Range Research Laboratory, Miles City, MT (Knapp et al.,
former will reflect the older origin of inbreeding as opposed to         1951; MacNeil, 2009; Leesburg et al., 2014). Briefly, the line 1
the latter that will reflect the recent origin of inbreeding (Keller     Hereford herd was founded in 1934 based on two paternal half-
et al., 2011).                                                           sib males and 50 unrelated females and was maintained under
    Several methods to identify ROH segments from stretches              a careful mating scheme to minimize inbreeding (MacNeil et al.,
of homozygous markers have been proposed. Rule-based                     1992; MacNeil, 2009). Management specific to this herd has been
approaches, such as those implemented in the popular software            previously described (MacNeil, 2009; MacNeil and Vermeire, 2012;
PLINK (Purcell et al., 2007), are commonly used for ROH analysis         MacNeil et al., 2017). Historically, the objective of selection in line
in humans and animal applications due to their simplicity                1 was focused on increasing growth rate from weaning to 1 yr of
(Ceballos et al., 2018; Meyermans et al., 2020). Despite their           age (MacNeil et al., 1992). Since 2011, the selection was primarily
popularity, the identification of ROH segments is often based            focused on improving calving ease (direct and maternal) while
on a set of heuristically predefined parameters leading to               maintaining weaning weight (WW) and yearling weight (YW) at
significant variations in the estimation of genomic inbreeding           least to herd averages.
(Howrigan et al., 2011; Ku et al., 2011; Yengo et al., 2017). In fact,       Pedigree, genotypes, and phenotypes used in this study
the minimum length to declare a segment as an ROH has major              were previously described by Sumreddee et al. (2019). The
effects on the estimation of inbreeding and its effects (Pryce et al.,   pedigree consisted of 10,186 animals (639 sires and 3,315
2014; Bérénos et al., 2016; Ferenčaković et al., 2017), yet different    dams). The average pedigree-based inbreeding coefficient (Fped)
parameters settings were used within and across species (Keller          of genotyped animals (n = 785) was 29.2% (SD = 5.3%) with an
et al., 2012; Kim et al., 2015; Martikainen et al., 2018; Addo et al.,   average of 17.15 equivalent complete generations (Sumreddee
2019; Szmatoła et al., 2019). The complexity resides in trying to        et al., 2019). Further characterization of the genetic architecture
balance the ability to identify short ROH segments representing          of the population can be found in Huang et al. (2012).
ancient inbreeding and lowering the probability of false detection           Genomic information consisted of single-nucleotide
of nonidentical by descent (IBD) regions (Purfield et al., 2012).        polymorphism (SNP) genotypes. Data quality control and
This complex problem could be reasonably addressed if actual             marker genotype imputation from low (3k, 9k, 20k, and 27k) to
or functionally predicted deleterious variants are available. In         medium-density SNP panels (50k) can be found in Sumreddee
fact, Keller et al. (2011) showed that inbreeding estimated from         et al. (2019). After imputation and quality control, the marker
ROH is highly correlated with homozygous mutation loads                  data consisted of 785 animals genotyped for 30,810 SNPs. For
using simulated data. Furthermore, several studies have shown            ROH identification, only autosomal SNPs (30,220) were used with
a significant enrichment of deleterious alleles (known and               an average distance between consecutive markers of 83.51 kb
functionally predicted mutations) in ROH regions (Szpiech et al.,        (SD = 5.83 kb). Only animals born between 1990 and 2016, with
2013; Zhang et al., 2015b; Pemberton and Szpiech, 2018; Sams             complete marker, phenotypic, and parental information, were
and Boyko, 2019). Thus, knowledge of deleterious mutation                used in ROH-based analyses. Phenotypic data consisted of birth
enrichment has been used to determine the minimum length                 weight (BW), WW, YW, average daily gain (ADG) between weaning
threshold for identifying ROH regions. Using known mutations             and yearling, age at first calving (AFC), and heifer pregnancy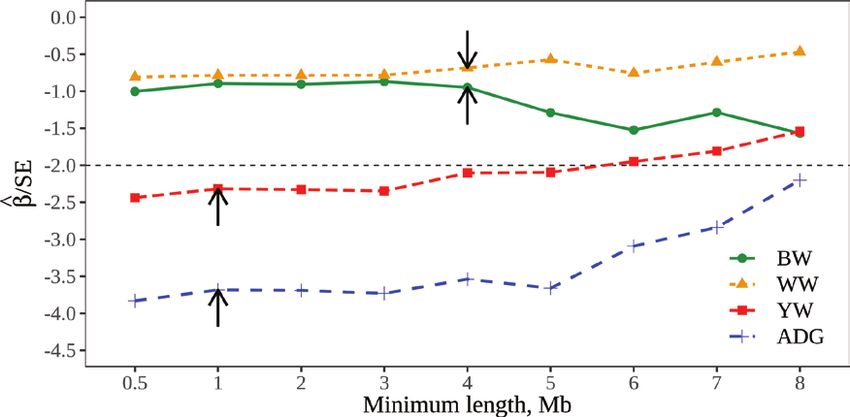
Sumreddee et al. |     3

status (HPS) recorded as a binary trait (0 = nonpregnant, 8.7%         Step 2
or 1 = pregnant, 91.3%). A full description of the data could be       Animals in the selected set identified in step 1 were sorted based
found in Supplementary Table S1.                                       on the total length of their target segments (Figure 1). Animals
                                                                       in the top and bottom quartiles of the distribution of total
Algorithm for estimating the minimum length of an                      target segment length were clustered into “HIGH” and “LOW”
ROH segment                                                            groups, respectively, and they formed the final set of animals
Accumulation of the effects of deleterious mutations across            that were used in the search of the minimum length threshold.
the genome is the predominant cause of inbreeding depression           Note that for female fertility traits, all selected animals from
(Charlesworth and Willis, 2009). There is ample evidence of            step 1 were retained, and the assignment of animals into HIGH
significant enrichment of deleterious alleles in ROH segments          or LOW groups was based on the median value of the total

                                                                                                                                            Downloaded from https://academic.oup.com/jas/article/98/12/skaa361/5979489 by U S Dept of Agriculture user on 03 August 2021
(Szpiech et al., 2013; Zhang et al., 2015b; Pemberton and              length of target tracts due to a limited number of animals with
Szpiech, 2018; Sams and Boyko, 2019). Thus, this enrichment            phenotypes. The number of animals in each group can be found
could be exploited in the identification of ROH segments.              in Supplementary Table S2.
Unfortunately, only a limited number of mutations are known
for complex traits. To remedy this situation, a search algorithm       Step 3
to approximate mutation enrichment across the genome was               Using the final set of animals identified in step 2, the contrast
proposed and used to estimate the minimum length of an                 between the effects of the HIGH and LOW groups was
ROH segment. The proposed method’s main hypothesis is that             estimated for each predefined target tract (Figure 1). For each
autozygous segments carrying unknown (hidden) mutations                trait, a linear model was specified, which included the group
will have a significant effect on traits.                              effects (HIGH and LOW) and the systematic effects of sex and
    ROH segments were identified using a sliding window                age (for WW and YW) and months of birth (for AFC and HPS).
approach as implemented in PLINK version 1.9 (Purcell et al.,          In addition, a regression on the total length of nontarget tracts
2007; Chang et al., 2015). Parameter settings for the detection        was included to correct for variation between animals. The
of ROH for this population were previously described by                estimated effects of HIGH and LOW groups were contrasted
Sumreddee et al. (2019). The --homozyg function was used to            and tested for significance (odds ratio between HIGH and LOW
perform ROH analysis. A maximum of two heterozygous SNPs               groups for HPS).
were allowed within the sliding window to minimize the impact              The minimum length threshold was determined as the
of potential genotyping errors. The maximum gap between two            lower bound of the shortest target tract with a significant
SNPs in a homozygous segment was set to 500 kb. A minimum              contrast between the two group means (HIGH to LOW). All
SNP density of 1 SNP per 500 kb inside an ROH was used to              statistical analyses regarding the estimation of minimum length
improve the ROH genome coverage for the current density SNP            thresholds were performed in R (R Core Team, 2018).
panel. Additionally, due to a limited density of marker panel
used in the current study, very few ROH segments smaller than          Inbreeding depression analyses
0.1 Mb were detected (results not shown). Thus, only autozygous        To evaluate the impact of the minimum length threshold used to
segments larger than 0.1 Mb were used in the search for the            identify ROH segment in the estimates of inbreeding depression,
minimum threshold for ROH identification. In order to capture          the proportion of the autosomal genome that is covered by ROH
short segments (≥0.1 Mb), the minimum number of markers was            segments for an individual i (FROHi ) was calculated following the
set to 5 consecutive homozygous SNPs per ROH.                          method proposed by McQuillan et al. (2008) as:
    Briefly, the three-step algorithm consists of finding the

shortest autozygous segment with a significant effect on the                     LROH
                                                                       (1)
                                                                       FROHi =        ,
trait. The minimum length threshold was set equal to the lower                 LAUTO
bound of such interval. The proposed algorithm was implemented
separately for each trait. Therefore, the minimum length threshold     where LROH and LAUTO are the total length of all ROH segments and
could be different across traits. A graphical representation of the    the autosomal genome (2,512,189 kb), respectively.
proposed three-step algorithm is shown in Figure 1.                       Inbreeding depression was assessed by regressing the trait
                                                                       phenotypes (BW, WW, YW, and ADG) on inbreeding coefficients
Step 1                                                                 using a mixed model:
All autozygous segments were identified for each genotyped
animal. A target tract (i.e., 0.1 to 1 Mb) is specified by the user.   (2)
                                                                       y = Xβ + Zu + Wm + Sp + e,
Autozygous segments shorter than the lower bound of the target
tract were removed, and the remaining segments were clustered          where y is a vector of phenotypes for the trait of interest; β is
into “target” group (segments with length that falls within the        the vector of fixed effects of sex, birth year, age (as covariate
length of the target tract) and “nontarget” group (segments            for WW and YW), and the regression coefficient on genomic
with length that falls outside the length of the target track).        inbreeding; and u is a vector of random additive effects. m and
For each animal, the total length of the nontarget segments            p are the vectors of random maternal and maternal permanent
(segments that fall within the nontarget group) was calculated.        environmental effects (only for BW and WW), and e is the
Animals with a total length of nontarget segments outside the          vector of random residuals. X, Z, W, and S are known incidence
interquartile range of the distribution (difference between the        matrices with the appropriate dimensions.
third and first quartiles) were removed. The remaining animals              Single-trait analyses were carried out using the BLUPF90
constituted the “selected set” with size n1. Only these animals        family programs (Misztal et al., 2002). The effect of inbreeding
were used in the following two steps of the proposed algorithm.        on a given trait was assessed based on the significance of its
This was done to remove, or at least attenuate, the potential          associated regression coefficient (β̂) using the t-statistic unit
effect of nontarget autozygous segments.                               (|β̂/SE| > 2).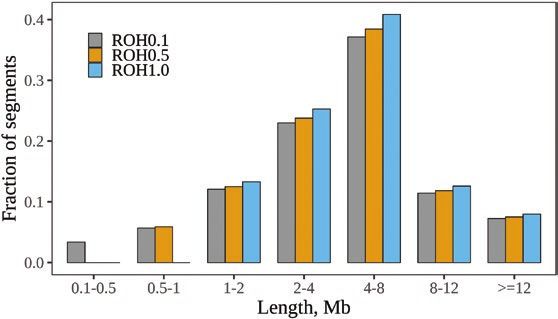
4   |   Journal of Animal Science, 2020, Vol. 98, No. 12

                                                                                                                                                                              Downloaded from https://academic.oup.com/jas/article/98/12/skaa361/5979489 by U S Dept of Agriculture user on 03 August 2021
Figure 1. A flow chart of the three-step search algorithm to approximate mutation loads within an autozygous segment to estimate the minimum length of an
ROH. Step 1: Identification of ROH segments based on the predefined target tract (e.g., 1 to 2 Mb) and selection of animals with similar nontarget tract length. Step 2:
Clustering the selected animals into HIGH and LOW groups based on the total length of their target tracts. Step 3: Estimation of the difference in the effect of two groups
on the trait of interest and its associated significance level.

Results and Discussion                                                                  and female fertility (AFC and HPS) traits (results not shown). For
                                                                                        growth traits, there was no significant difference (P > 0.05) in
Approximation of minimum length thresholds                                              the total length of nontarget tracts for most of the tract sizes
for ROH                                                                                 as indicated in Supplementary Figure S1C (only results for ADG
                                                                                        are shown). The only significant difference was observed for
The ability of the proposed algorithm to cluster animals into
                                                                                        the 0.1 to 1.0 Mb interval (P = 0.026). However, the differences
HIGH and LOW groups was assessed by testing the differences
                                                                                        in the total length of nontarget tracts between the HIGH and
in key parameters between the two groups as illustrated in                              LOW groups were significant across all intervals for the fertility
Supplementary Figure S1. For ADG and across predefined target                           traits (result not shown). Similar results were observed in
tract sizes, the two groups of animals in final data sets differed                      terms of the coefficients of variation between the two groups
significantly (P < 0.00001) in their number and the total length                        (Supplementary Table S2). Admittedly, for fertility traits (AFC
of target segments (Supplementary Figure S1A and B). Similar                            and HPS), variations in their total length of nontarget segments
results were observed for the other growth (BW, WW, and YW)                             were different between the two groups. This is due to the fact
Sumreddee et al. | 5
that all animals were kept before the selection step regardless of compared with long (>3 Mb) ROH regions, which could be in part
their variation in nontarget tracts in order to ensure a sufficient due to hitchhiking effects. Significant inbreeding effects were
number of animals for estimating the effects. However, found to vary across the different ROH length segments (1 to
such observed heterogeneity was accounted for by adding a 2, 2 to 4, 4 to 8, 8 to 16, and >16 Mb) and traits (yield, fertility,
regression on the total lengths of nontarget tracts in the statistic and udder health) in dairy cattle, indicating that both short
model for all traits. and long ROH contributing to inbreeding depression (Doekes
The difference between the HIGH and LOW group effects at et al., 2019). These results seem to indirectly imply that the
varying thresholds for the minimum length of ROH segments is specific minimum length thresholds of ROH could be important
shown in Figure 2. As defined earlier, the HIGH group included in assessing inbreeding depression. Although the sensitivity
animals with a significantly higher fraction of their genome and specificity tend to be lower for the detection of short ROH
Downloaded from https://academic.oup.com/jas/article/98/12/skaa361/5979489 by U S Dept of Agriculture user on 03 August 2021
covered with autozygous segments within the specified target segments (e.g., 0.05; Figure 2F and Supplementary frequent when the marker density is similar to currently used
Table S4). For these two fertility traits, extended intervals (up SNP panels (Zhang et al., 2015a).
to 10 Mb) were further investigated. However, none of these Additionally, incorporating the approximated mutation
analyses showed significant differences between groups (results load using the proposed method into the genotype-counting
not shown). approaches could be an alternative to the more computationally
The significant differences between the HIGH and LOW expensive model-based methods, such as the hidden Markov
groups for short homozygous target segments (i.e., 1 to 2, 2 to 3, model (HMM) framework (Browning and Browning, 2010) and
3 to 4, and 4 to 5 Mb long) indicate that these short autozygous likelihood-based approach (Broman and Weber, 1999; Pemberton
tracts are likely to harbor more unfavorable than favorable alleles et al., 2012; Kardos et al., 2017). The latter requires the knowledge
for the traits analyzed. This result is in agreement with previous of the population-allele frequencies, which might not be
findings showing that short ROH regions, of comparable sizes accurately obtained, especially when the sample size is small.
to the current study, are enriched with deleterious variants in Although model-based approaches (e.g., HMM) do not rely on
several species, including humans (Szpiech et al., 2013), domestic the prior definition of arbitrary thresholds for indentifying ROH
dogs (Sams and Boyko, 2019), and cattle (Zhang et al., 2015b). segments (Druet and Gautier, 2017), the identified autozygous
Furthermore, it highlights their importance in the calculation segments may not have effects on phenotypes. Calculation
of inbreeding and the estimation of inbreeding depression. of genomic inbreeding that incorporates ROH segments with
Using cattle data, Zhang et al. (2015b) revealed a significantly potentially no effects (particularly short segments) has shown
higher enrichment of deleterious variants in short and medium to reduce power to detect inbreeding depression (Pryce et al.,6 | Journal of Animal Science, 2020, Vol. 98, No. 12
Downloaded from https://academic.oup.com/jas/article/98/12/skaa361/5979489 by U S Dept of Agriculture user on 03 August 2021
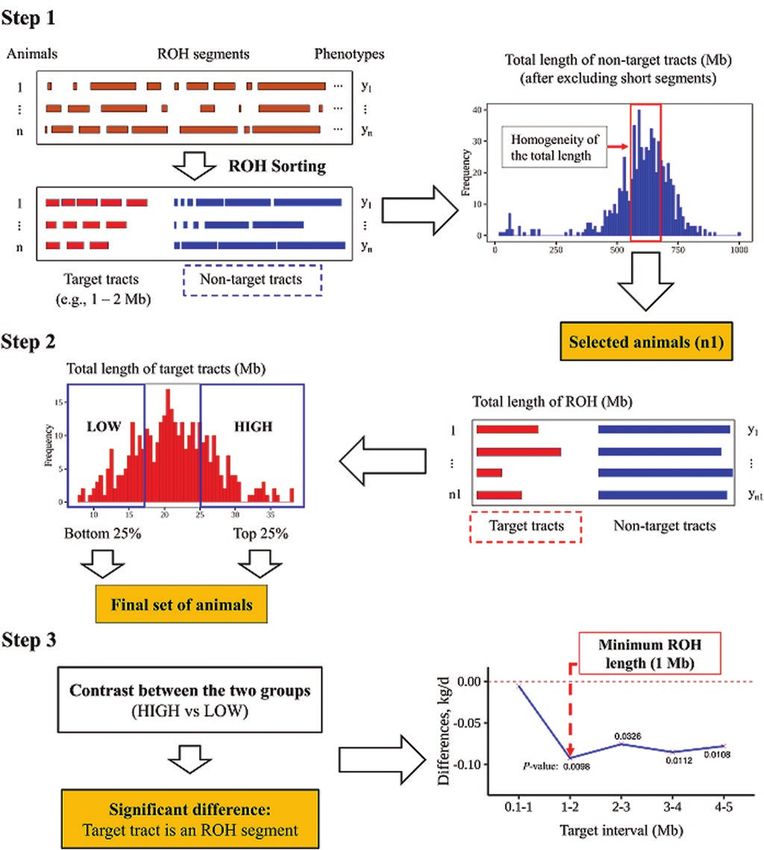
Figure 2. Differences in LS means (A to E) or the odds ratio for pregnancy (F) between HIGH and LOW groups for different sizes of target tracts and associated significant
P values (96%)
method, we are not redefining inbreeding depression, although had at least five ROH segments for each length class between 1
the estimated inbreeding will not necessarily reflect the overall and 12 Mb. However, only 36% of animals had more than 5 ROH
level of autozygosity in the genome. segments for 0.1 to 0.5 Mb segment (Supplementary Table S5).
The majority of identical homozygous segments of 4 to 12 Mb
Patterns of ROH long are likely inherited from common ancestors around 6 to 12
The patterns and distribution of ROH segments in the autosomes generations ago (assuming 1 Morgan equals 100 Mb), while long
of line 1 Hereford animals were investigated using the minimum ROH tracts (>12 Mb) are potentially arisen from closely related
length threshold of 1 Mb (ROH1.0) as approximated using the parents with common ancestors originated around at most 4
proposed algorithm (obtained from YW and ADG) and two generations ago (Ceballos et al., 2018). Moreover, the sizeable
shorter length thresholds (ROH0.1 and ROH0.5). The latter were portion of short homozygous segments (Sumreddee et al. | 7
Table 1. Summary description of ROH segments identified using minimum length thresholds of 0.1 (ROH0.1), 0.5 (ROH0.5), and 1.0 Mb (ROH1.0)
ROH detection Parameter1 Mean SD Min. Max.
ROH0.1 ROH_n 115.7 24.1 9 176
ROH_L 5.39 4.52 0.11 64.86
ROH_TL 623.19 138.06 27.02 1,045.75
ROH_nsnp 70.4 62.4 5 929
ROH0.5 ROH_n 111.8 23.3 9 164
ROH_L 5.56 4.50 0.50 64.86
ROH_TL 621.79 137.81 27.02 1,042.63
Downloaded from https://academic.oup.com/jas/article/98/12/skaa361/5979489 by U S Dept of Agriculture user on 03 August 2021
ROH_nsnp 72.6 62.3 5 929
ROH1.0 ROH_n 105.2 21.9 7 152
ROH_L 5.86 4.47 1.00 64.86
ROH_TL 616.74 136.83 25.91 1,034.06
ROH_nsnp 76.7 62.1 5 929
ROH_n, number of ROH per animal; ROH_L, individual ROH segment length, Mb; ROH_TL, total ROH length per animal, Mb; ROH_nsnp,
1
number of SNPs per ROH.
pedigree records began. Therefore, the inference about short
ROH segments and their effects cannot be made unless higher
SNP density or sequence data are available.
Compared with other cattle populations (Ferenčaković et al.,
2013a; Gurgul et al., 2016; Szmatoła et al., 2016; Peripolli et al.,
2018), a larger extent of long ROH segments (>8 Mb) observed in
the line 1 population are not surprising given that the population
was maintained as a closed population since its formation, in
which inbreeding is likely unavoidable (MacNeil et al., 1992;
MacNeil, 2009). These observed recent haplotypes resulting from
recent parental relatedness could have a crucial contribution to
the overall level of autozygosity in the population.
Estimation of inbreeding depression
Figure 3. Distribution of ROH segments using different minimum length
Table 2 presents the estimates of inbreeding and inbreeding thresholds of 0.1 (ROH0.1), 0.5 (ROH0.5), and 1.0 Mb (ROH1.0).
depression for growth traits using different minimum length
thresholds (from 0.5 to 8 Mb) to identify ROH segments. As
expected, genome-wide inbreeding decreases with the increase Thus, in spite of accounting for highly deleterious recent
in the minimum threshold with an average rate of 0.0176 per a mutations, a considerable number of mutations with potentially
1-Mb increase in minimum threshold. For example, the means substantial collective effect on traits (e.g., YW) will not be
(SD) of ROH-based inbreeding coefficient (FROH) were 0.243 (0.054), considered as they fall in shorter segments (8 | Journal of Animal Science, 2020, Vol. 98, No. 12
Table 2. Estimates of inbreeding depression for growth traits when FROH was calculated using different minimum length thresholds
Regression coefficient (SE)3
Minimum
Length1 n2 FROH (SD) BW WW YW ADG
0.5 785 0.243 (0.054) −0.043 (0.043) −0.184 (0.227) −0.888 (0.364) −4.97 (1.30)
1.0 785 0.229 (0.051) −0.041 (0.045) −0.187 (0.239) −0.887 (0.383) −5.03 (1.37)
2.0 785 0.228 (0.051) −0.041 (0.046) −0.187 (0.239) −0.891 (0.383) −5.05 (1.37)
3.0 785 0.223 (0.050) −0.040 (0.046) −0.189 (0.242) −0.912 (0.388) −5.18 (1.39)
4.0 785 0.205 (0.048) −0.045 (0.048) −0.170 (0.250) −0.847 (0.403) −5.11 (1.44)
Downloaded from https://academic.oup.com/jas/article/98/12/skaa361/5979489 by U S Dept of Agriculture user on 03 August 2021
5.0 783 0.179 (0.044) −0.066 (0.051) −0.153 (0.267) −0.906 (0.432) −5.70 (1.56)
6.0 780 0.152 (0.039) −0.083 (0.054) −0.216 (0.285) −0.908 (0.466) −5.31 (1.72)
7.0 776 0.129 (0.035) −0.074 (0.058) −0.186 (0.306) −0.903 (0.499) −5.36 (1.89)
8.0 770 0.111 (0.031) −0.097 (0.062) −0.154 (0.328) −0.833 (0.541) −4.62 (2.10)
1
The minimum length threshold (in Mb) used to identify ROH segments.
2
Number of genotyped animals.
3
Significant effects (|β̂/SE| > 2) are in bold font. Values set in italics were the estimates associated with the approximate minimum length of
ROH obtained using the search algorithm proposed in the present study.
when ROH segments were identified using either a 5 or 10 Mb explain the inconsistency of the findings from different studies
minimum length threshold (Bérénos et al., 2016). Although the regarding the effects of the minimum length threshold for ROH
estimates of inbreeding depression slightly differed for the on inbreeding depression.
two thresholds, Bérénos et al. (2016) reported that inbreeding High thresholds (>4 Mb) were recommended for the
depression was less pronounced (larger SEs) when a longer identification of ROH segments in the presence of medium-
minimum length threshold (10 Mb) was used. Ferenčaković density SNP panels due to the difficulties in precisely identifying
et al. (2017) also reported a lower ability to detect significant shorter segments (Ferenčaković et al., 2013b). Similarly, the 50k
inbreeding effects on semen quality traits in cattle when ROH SNP panel is found to be suitable for detecting ROH segments
segments of 4 Mb or longer were used compared with shorter longer than 5 Mb as concluded by Purfield et al. (2012). This
ROH segments (>2 Mb). Inconsistent results were observed when general recommendation seems to be partially supported by
higher thresholds (>60 SNPs or the equivalence of >3.5 Mb) our results for BW and WW (the estimated minimum length
for the identification of ROH segments were used leading to a threshold > 4 Mb). Substantially lower thresholds (>1 Mb) were
greater reduction in milk yield in dairy cattle breeds even after accurately estimated for YW and ADG despite the limited
correction for the general homozygosity (Pryce et al., 2014). size of the marker panel and phenotypic data. Discarding
Collectively, these results support the hypothesis that the effect these short autozygous segments that are likely to contain
of homozygosity regions could be trait and population specific. deleterious alleles not only results in an underestimation
Shorter ROH regions arising from more ancient common of the autozygosity originated from more distant ancestors
ancestors are expected to have less or no detrimental impacts but could also lead to substantial bias in the estimation of
on traits compared with longer segments (arising from more inbreeding depression. The proposed method provides a
recent common ancestors) as selection eliminates deleterious simple but useful approach to approximate the minimum
alleles following inbreeding over time. Pryce et al. (2014) and length threshold to identify ROH segments for complex traits
Saura et al. (2015) concluded that purging is a likely cause to in the absence of detailed genetic/genomic information. The
explain the higher inbreeding depression effects of long ROH data used in this study were generated in a small and well-
segments (more recent inbreeding) compared with their short controlled population that is not representative of common
counterparts in farm animals. Although in general there is a commercial livestock populations. Our primary goal was
well-supported relationship between purging and the age of to test the ability of the proposed method to estimate the
inbreeding, the efficiency of purging of deleterious mutations minimum threshold to identify ROH segments and the data
from shorter ROH segments (reflecting older inbreeding) is likely set was largely adequate for that purpose. Thresholds are trait
to be influenced by factors such as selection pressure (Hedrick, specific and likely to be data set specific. Further evaluation
1994; Mc Parland et al., 2009) and rate of inbreeding (Holt et al., with other datasets is needed and it is currently in progress.
2005) within the population, leading to variability in the effects
of segments. Furthermore, purging does not affect all short
ROH segments equally. Short autozygous regions may still have Conclusions
significant deleterious effects despite their distant origin due to In this study, a search algorithm was developed to identify the
some specific management and mating practices (e.g., allowing minimum length of autozygous segments to be declared as
inbreeding only from distant common ancestors after several ROH. The algorithm approximates the mutation enrichment
generations of inbreeding avoidance). Although imperfect, there at the individual level using available phenotypic information.
is a well-supported relationship between purging and the age of This is of valuable practical importance as the direct assessment
inbreeding that we tried to exploit in this study. In addition, the of mutation enrichment using genetic/genomic information is
accumulation of a large number of short homozygous segments seldom available for the majority of livestock populations and
(reflecting ancient inbreeding) with potentially small effects complex traits. The proposed approach is heuristic in nature and
could substantially contribute to the expression of inbreeding the estimated thresholds are trait specific. Although ROH are
depression as observed in the current study. This could partially signatures of the genome evolution and are not specific to eachSumreddee et al. | 9
Downloaded from https://academic.oup.com/jas/article/98/12/skaa361/5979489 by U S Dept of Agriculture user on 03 August 2021
Figure 4. Estimates of inbreeding depression across different minimum length thresholds used to identify ROH for growth traits. Arrows indicate the approximate
location of the minimum length thresholds obtained using the proposed search algorithm. The horizontal dashed line indicates the threshold (β̂/SE < −2) to declare
significance.
trait, their impact on traits could be different. Including short Conflict of interest statement
ROH segments that carry no mutations relevant to a specific
The authors declare no conflict of interest.
trait will likely “bias” the estimation of inbreeding depression.
The assessment of our proposed method showed its potential
benefits in terms of the estimates of the genome-wide level of Literature Cited
autozygosity as well as the calculation of inbreeding depression.
Addo, S., S. Klingel, D. Hinrichs, and G. Thaller. 2019. Runs of
The history of line 1 Hereford cattle population was reasonably Homozygosity and NetView analyses provide new insight
revealed by the patterns of ROH length distribution, where the into the genome-wide diversity and admixture of three
intermediate-size ROH segments were predominant followed by German cattle breeds. PLoS One. 14:e0225847. doi:10.1371/
a significant portion of short autozygous segments, reflecting journal.pone.0225847
immediate population bottleneck and breeding management Bérénos, C., P. A. Ellis, J. G. Pilkington, and J. M. Pemberton. 2016.
of the herd. In addition, the burden of relatively long ROH Genomic analysis reveals depression due to both individual
segments (≥8 Mb) reflects recent inbreeding that could occur and maternal inbreeding in a free-living mammal population.
Mol. Ecol. 25:3152–3168. doi:10.1111/mec.13681
due to the mating of closely related individuals. This pattern is
Broman, K. W., and J. L. Weber. 1999. Long homozygous
different from what has been observed in humans or even other
chromosomal segments in reference families from the
cattle populations where short autozygous segments are often centre d’Etude du polymorphisme humain. Am. J. Hum. Genet.
more abundant. 65:1493–1500. doi:10.1086/302661
Browning, S. R., and B. L. Browning. 2010. High-resolution
Supplementary Data detection of identity by descent in unrelated individuals. Am.
J. Hum. Genet. 86:526–539. doi:10.1016/j.ajhg.2010.02.021
Supplementary data are available at Journal of Animal Science Cassell, B. G., V. Adamec, and R. E. Pearson. 2003. Effect of
online. incomplete pedigrees on estimates of inbreeding and
inbreeding depression for days to first service and summit
milk yield in Holsteins and Jerseys. J. Dairy Sci. 86:2967–2976.
doi:10.3168/jds.S0022-0302(03)73894-6
Acknowledgments Ceballos, F. C., P. K. Joshi, D. W. Clark, M. Ramsay, and J. F. Wilson.
The U.S. Department of Agriculture (USDA) prohibits 2018. Runs of homozygosity: windows into population history
and trait architecture. Nat. Rev. Genet. 19:220–234. doi:10.1038/
discrimination in all its programs and activities on the basis
nrg.2017.109
of race, color, national origin, age, disability, and where
Chang, C. C., C. C. Chow, L. C. Tellier, S. Vattikuti, S. M. Purcell,
applicable, sex, marital status, familial status, parental and J. J. Lee. 2015. Second-generation PLINK: rising to the
status, religion, sexual orientation, genetic information, challenge of larger and richer datasets. Gigascience 4:7.
political beliefs, reprisal, or because all or part of an doi:10.1186/s13742-015-0047-8
individual’s income is derived from any public assistance Charlesworth, D., and J. H. Willis. 2009. The genetics of inbreeding
program. (Not all prohibited bases apply to all programs.) depression. Nat. Rev. Genet. 10:783–796. doi:10.1038/nrg2664
Persons with disabilities who require alternative means Curik, I., M. Ferenčaković, and J. Sölkner. 2017. Genomic dissection
for communication of program information (Braille, large of inbreeding depression: a gate to new opportunities. R. Bras.
Zootec. 46:773–782. doi:10.1590/s1806-92902017000900010
print, audiotape, etc.) should contact USDA’s TARGET Center
Doekes, H. P., R. F. Veerkamp, P. Bijma, G. de Jong, S. J. Hiemstra,
at +1 (202) 720-2600 (voice and TDD). To file a complaint of
and J. J. Windig. 2019. Inbreeding depression due to recent
discrimination, write to USDA, Director, Office of Civil Rights, and ancient inbreeding in Dutch Holstein–Friesian dairy
1400 Independence Avenue, S.W., Washington, D.C. 20250- cattle. Genet. Sel. Evol. 51:54. doi:10.1186/s12711-019-0497-z
9410, or call +1 (800) 795-3272 (voice) or +1 (202) 720-6382 Druet, T., and M. Gautier. 2017. A model-based approach to
(TDD). USDA is an equal opportunity provider and employer. characterize individual inbreeding at both global and10 | Journal of Animal Science, 2020, Vol. 98, No. 12
local genomic scales. Mol. Ecol. 26:5820–5841. doi:10.1111/ preweaning gain for line 1 Hereford cattle from Miles City,
mec.14324 Montana. J. Anim. Sci. 95:3833–3838. doi:10.2527/jas2017.1829
Ferenčaković, M., E. Hamzić, B. Gredler, T. R. Solberg, MacNeil, M. D., J. J. Urick, S. Newman, and B. W. Knapp. 1992.
G. Klemetsdal, I. Curik, and J. Sölkner. 2013a. Estimates of Selection for postweaning growth in inbred Hereford cattle:
autozygosity derived from runs of homozygosity: empirical the Fort Keogh, Montana line 1 example. J. Anim. Sci. 70:723–
evidence from selected cattle populations. J. Anim. Breed. 733. doi:10.2527/1992.703723x
Genet. 130: 286–293. doi:10.1111/jbg.12012 MacNeil, M., and L. Vermeire. 2012. Effect of weather patterns
Ferenčaković, M., J. Sölkner, and I. Curik. 2013b. Estimating on preweaning growth of beef calves in the Northern Great
autozygosity from high-throughput information: effects of Plains. Agric. Sci. 3:929. doi:10.4236/as.2012.37113
SNP density and genotyping errors. Genet. Sel. Evol. 45:42. Martikainen, K., A. Sironen, and P. Uimari. 2018. Estimation of
doi:10.1186/1297-9686-45-42 intrachromosomal inbreeding depression on female fertility
Downloaded from https://academic.oup.com/jas/article/98/12/skaa361/5979489 by U S Dept of Agriculture user on 03 August 2021
Ferenčaković, M., J. Sölkner, M. Kapš, and I. Curik. 2017. Genome- using runs of homozygosity in Finnish Ayrshire cattle. J. Dairy
wide mapping and estimation of inbreeding depression Sci. 101:11097–11107. doi:10.3168/jds.2018-14805
of semen quality traits in a cattle population. J. Dairy Sci. Mc Parland, S., F. Kearney, and D. P. Berry. 2009. Purging of
100:4721–4730. doi:10.3168/jds.2016-12164 inbreeding depression within the Irish Holstein-Friesian
Gurgul, A., T. Szmatoła, P. Topolski, I. Jasielczuk, K. Żukowski, and population. Genet. Sel. Evol. 41:16. doi:10.1186/1297-9686-41-16
M. Bugno-Poniewierska. 2016. The use of runs of homozygosity McQuillan, R., A. L. Leutenegger, R. Abdel-Rahman, C. S. Franklin,
for estimation of recent inbreeding in Holstein cattle. J. Appl. M. Pericic, L. Barac-Lauc, N. Smolej-Narancic, B. Janicijevic,
Genet. 57:527–530. doi:10.1007/s13353-016-0337-6 O. Polasek, A. Tenesa, et al. 2008. Runs of homozygosity
Hedrick, P. W. 1994. Purging inbreeding depression and the in European populations. Am. J. Hum. Genet. 83:359–372.
probability of extinction: full-sib mating. Heredity (Edinb). doi:10.1016/j.ajhg.2008.08.007
73(Pt 4):363–372. doi:10.1038/hdy.1994.183 Meyermans, R., W. Gorssen, N. Buys, and S. Janssens. 2020. How
Holt, M., T. Meuwissen, and O. Vangen. 2005. The effect of fast to study runs of homozygosity using PLINK? A guide for
created inbreeding on litter size and body weights in mice. analyzing medium density SNP data in livestock and pet
Genet. Sel. Evol. 37:523–537. doi:10.1186/1297-9686-37-6-523 species. BMC Genomics 21:94. doi:10.1186/s12864-020-6463-x
Howrigan, D. P., M. A. Simonson, and M. C. Keller. 2011. Detecting Misztal, I., S. Tsuruta, T. Strabel, B. Auvray, T. Druet, and D. H. Lee.
autozygosity through runs of homozygosity: a comparison 2002. BLUPF90 and related programs (BGF90). In: Proceedings
of three autozygosity detection algorithms. BMC Genomics of the 7th World Congress on Genetics Applied to Livestock
12:460. doi:10.1186/1471-2164-12-460 Production; August 19–23, 2002. Montpellier (France);
Huang, Y., C. Maltecca, M. D. Macneil, L. J. Alexander, Organising Committee; p. 28.
W. M. Snelling, and J. P. Cassady. 2012. Using 50 k single Nani, J. P., and F. Peñagaricano. 2020. Whole-genome
nucleotide polymorphisms to elucidate genomic architecture homozygosity mapping reveals candidate regions affecting
of line 1 Hereford cattle. Front. Genet. 3:285. doi:10.3389/ bull fertility in US Holstein cattle. BMC Genomics 21:338.
fgene.2012.00285 doi:10.1186/s12864-020-6758-y
Kardos, M., A. Qvarnström, and H. Ellegren. 2017. Inferring Pemberton, T. J., D. Absher, M. W. Feldman, R. M. Myers,
individual inbreeding and demographic history from N. A. Rosenberg, and J. Z. Li. 2012. Genomic patterns of
segments of identity by descent in Ficedula flycatcher homozygosity in worldwide human populations. Am. J. Hum.
genome sequences. Genetics 205:1319–1334. doi:10.1534/ Genet. 91:275–292. doi:10.1016/j.ajhg.2012.06.014
genetics.116.198861 Pemberton, T. J., and Z. A. Szpiech. 2018. Relationship between
Keller, M. C., M. A. Simonson, S. Ripke, B. M. Neale, deleterious variation, genomic autozygosity, and disease risk:
P. V. Gejman, D. P. Howrigan, S. H. Lee, T. Lencz, insights from the 1000 genomes project. Am. J. Hum. Genet.
D. F. Levinson, and P. F. Sullivan; Schizophrenia 102:658–675. doi:10.1016/j.ajhg.2018.02.013
Psychiatric Genome-Wide Association Study Consortium. Peripolli, E., N. B. Stafuzza, D. P. Munari, A. L. F. Lima, R. Irgang,
2012. Runs of homozygosity implicate autozygosity M. A. Machado, J. C. D. C. Panetto, R. V. Ventura, F. Baldi, and
as a schizophrenia risk factor. PLoS Genet. 8:e1002656. M. V. G. B. da Silva. 2018. Assessment of runs of homozygosity
doi:10.1371/journal.pgen.1002656 islands and estimates of genomic inbreeding in Gyr (Bos
Keller, M. C., P. M. Visscher, and M. E. Goddard. 2011. indicus) dairy cattle. BMC Genomics 19:34. doi:10.1186/
Quantification of inbreeding due to distant ancestors and its s12864-017-4365-3
detection using dense single nucleotide polymorphism data. Pryce, J. E., M. Haile-Mariam, M. E. Goddard, and B. J. Hayes. 2014.
Genetics 189:237–249. doi:10.1534/genetics.111.130922 Identification of genomic regions associated with inbreeding
Kim, E. S., T. S. Sonstegard, C. P. Van Tassell, G. Wiggans, and depression in Holstein and Jersey dairy cattle. Genet. Sel. Evol.
M. F. Rothschild. 2015. The relationship between runs of 46:71. doi:10.1186/s12711-014-0071-7
homozygosity and inbreeding in Jersey cattle under selection. Purcell, S., B. Neale, K. Todd-Brown, L. Thomas, M. A. Ferreira,
PLoS One. 10:e0129967. doi:10.1371/journal.pone.0129967 D. Bender, J. Maller, P. Sklar, P. I. de Bakker, M. J. Daly, et al.
Knapp, B., R. C. Church, and A. E. Flower. 1951. Genetic history of 2007. PLINK: a tool set for whole-genome association and
the line 1 Hereford cattle at the United States range livestock population-based linkage analyses. Am. J. Hum. Genet. 81:559–
experiment station. Montana Agri. Exp. Sta. Bull. 479:3–27. 575. doi:10.1086/519795
Ku, C. S., N. Naidoo, S. M. Teo, and Y. Pawitan. 2011. Regions of Purfield, D. C., D. P. Berry, S. McParland, and D. G. Bradley. 2012.
homozygosity and their impact on complex diseases and Runs of homozygosity and population history in cattle. BMC
traits. Hum. Genet. 129:1–15. doi:10.1007/s00439-010-0920-6 Genet. 13:70. doi:10.1186/1471-2156-13-70
Leesburg, V. L. R., M. D. MacNeil, and F. W. C. Neser. 2014. R Core Team. 2018. R: a language and environment for statistical
Influence of miles city line 1 on the United States Hereford computing. Vienna (Austria): R Foundation for Statistical
population1,2,3. J. Anim. Sci. 92: 2387–2394. doi:10.2527/ Computing. Available from https://www.R-project.org/.
jas.2013-6890 Sams, A. J., and A. R. Boyko. 2019. Fine-scale resolution of runs of
MacNeil, M. D. 2009. Invited Review: Research contributions homozygosity reveal patterns of inbreeding and substantial
from seventy-five years of breeding line 1 Hereford cattle at overlap with recessive disease genotypes in domestic dogs.
miles city, Montana1,2. J. Anim. Sci. 87:2489–2501. doi:10.2527/ G3 (Bethesda). 9:117–123. doi:10.1534/g3.118.200836
jas.2009-1909 Saura, M., A. Fernández, L. Varona, A. I. Fernández, M. Á. de Cara,
MacNeil, M. D., F. F. Cardoso, and E. Hay. 2017. Genotype by C. Barragán, and B. Villanueva. 2015. Detecting inbreeding
environment interaction effects in genetic evaluation of depression for reproductive traits in Iberian pigs usingSumreddee et al. | 11
genome-wide data. Genet. Sel. Evol. 47:1. doi:10.1186/ Szpiech, Z. A., J. Xu, T. J. Pemberton, W. Peng, S. Zöllner,
s12711-014-0081-5 N. A. Rosenberg, and J. Z. Li. 2013. Long runs of homozygosity
Sumreddee, P., S. Toghiani, E. H. Hay, A. Roberts, S. E. Agrrey, are enriched for deleterious variation. Am. J. Hum. Genet.
and R. Rekaya. 2019. Inbreeding depression in line 1 Hereford 93:90–102. doi:10.1016/j.ajhg.2013.05.003
cattle population using pedigree and genomic information. J. Yengo, L., Z. Zhu, N. R. Wray, B. S. Weir, J. Yang, M. R. Robinson, and
Anim. Sci. 97:1–18. doi:10.1093/jas/sky385 P. M. Visscher. 2017. Detection and quantification of inbreeding
Szmatoła, T., A. Gurgul, I. Jasielczuk, T. Ząbek, K. Ropka- depression for complex traits from SNP data. Proc. Natl. Acad.
Molik, Z. Litwińczuk, and M. Bugno-Poniewierska. 2019. A Sci. U. S. A. 114:8602–8607. doi:10.1073/pnas.1621096114
comprehensive analysis of runs of homozygosity of eleven Zhang, Q., M. P. Calus, B. Guldbrandtsen, M. S. Lund, and
cattle breeds representing different production types. Animals G. Sahana. 2015a. Estimation of inbreeding using pedigree,
(Basel) 9:1024. doi:10.3390/ani9121024 50k SNP chip genotypes and full sequence data in three cattle
Downloaded from https://academic.oup.com/jas/article/98/12/skaa361/5979489 by U S Dept of Agriculture user on 03 August 2021
Szmatoła, T., A. Gurgul, K. Ropka-Molik, I. Jasielczuk, T. Ząbek, breeds. BMC Genet. 16:88. doi:10.1186/s12863-015-0227-7
and M. Bugno-Poniewierska. 2016. Characteristics Zhang, Q., B. Guldbrandtsen, M. Bosse, M. S. Lund, and
of runs of homozygosity in selected cattle breeds G. Sahana. 2015b. Runs of homozygosity and distribution
maintained in Poland. Livest. Sci. 188:72–80. doi:10.1016/j. of functional variants in the cattle genome. BMC Genomics
livsci.2016.04.006 16:542. doi:10.1186/s12864-015-1715-xYou can also read