Obesity and overall mortality: findings from the Jackson Heart Study
←
→
Page content transcription
If your browser does not render page correctly, please read the page content below
Min et al. BMC Public Health     (2021) 21:50
https://doi.org/10.1186/s12889-020-10040-9

 RESEARCH ARTICLE                                                                                                                                    Open Access

Obesity and overall mortality: findings from
the Jackson Heart Study
Yuan-I Min* , Yan Gao, Pramod Anugu, Anshul Anugu and Adolfo Correa

  Abstract
  Background: Overall mortality has been reported to be lower among individuals classified as overweight/obese
  when compared with their normal weight counterparts (“obesity paradox”) when obesity classification is based on
  the body mass index (BMI). One possible reason for this apparent paradox is that BMI is not a reliable measure of
  obesity-related risk as it does not differentiate fat mass from lean muscle mass or fat mass phenotypes. Waist
  circumference (WC), as a measure of central adiposity, may be a better indicator of obesity-related risk. We
  examined the association of overall mortality with BMI and with WC measures, including WC, waist-to-height ratio
  (WHtR) and waist-to-hip ratio (WHR).
  Methods: Data from 3976 African American participants (551 deaths) in the Jackson Heart Study (JHS) were
  analyzed. Cox regression models were used to perform survival analysis. Obesity measures were analyzed as
  dichotomous (obese/non-obese) and continuous variables. Baseline covariates included age, sex and smoking
  status.
  Results: Comparing obese to non-obese participants, adjusted hazard ratios (95% CI) for overall mortality were 1.14
  (0.96, 1.35), 1.30 (1.07, 1.59), 1.02 (0.73, 1.41) and 1.45 (1.18, 1.79) when using BMI, WC, WHtR and WHR, respectively.
  For BMI, WC and WHtR, a J-shaped relationship was observed with overall mortality. For WHR, a monotonic
  increasing relationship was observed with overall mortality.
  Conclusions: In the JHS, we found that obesity as defined by WC and WHR was associated with an increased risk
  of overall and CVD mortality, while obesity defined by BMI was associated only with an increased risk of CVD
  mortality. WHR was the only obesity measure that showed a monotonic increasing relationship with overall and
  CVD mortality.
  Keywords: Obesity, Body mass index, Waist circumference, Waist-to-height ratio, Waist-to-hip ratio, Mortality, Overall
  mortality, Cardiovascular mortality, Cancer mortality

Background                                                                              mortality among general populations of adults using
Overall mortality has been reported to be lower among                                   normal weight (BMI 18.5 to < 25) as a reference group,
individuals classified as overweight/obese based on body                                overweight (BMI 25 to < 30) was associated with a signifi-
mass index (BMI, kg/m2) when compared with their nor-                                   cantly lower overall mortality, grade 1 obesity (BMI 30 to <
mal weight counterparts (“obesity paradox”) both in the                                 35) was not associated with a higher overall mortality, and
general population and in population subgroups [1–5]. In a                              grades 2 and 3 obesity (BMI ≥ 35) were associated with a
systematic review of prospective studies of obesity and                                 significantly higher overall mortality [1]. Similar findings
                                                                                        have been reported in the elderly population and among
                                                                                        patients with chronic kidney disease, coronary heart
* Correspondence: ymin@umc.edu
The Jackson Heart Study, University of Mississippi Medical Center, 350 W.               disease, heart failure and chronic obstructive pulmonary
Woodrow Wilson Avenue, Ste. 701, Jackson, MS 39213, USA                                 disease [2–5].
                                         © The Author(s). 2021 Open Access This article is licensed under a Creative Commons Attribution 4.0 International License,
                                         which permits use, sharing, adaptation, distribution and reproduction in any medium or format, as long as you give
                                         appropriate credit to the original author(s) and the source, provide a link to the Creative Commons licence, and indicate if
                                         changes were made. The images or other third party material in this article are included in the article's Creative Commons
                                         licence, unless indicated otherwise in a credit line to the material. If material is not included in the article's Creative Commons
                                         licence and your intended use is not permitted by statutory regulation or exceeds the permitted use, you will need to obtain
                                         permission directly from the copyright holder. To view a copy of this licence, visit http://creativecommons.org/licenses/by/4.0/.
                                         The Creative Commons Public Domain Dedication waiver (http://creativecommons.org/publicdomain/zero/1.0/) applies to the
                                         data made available in this article, unless otherwise stated in a credit line to the data.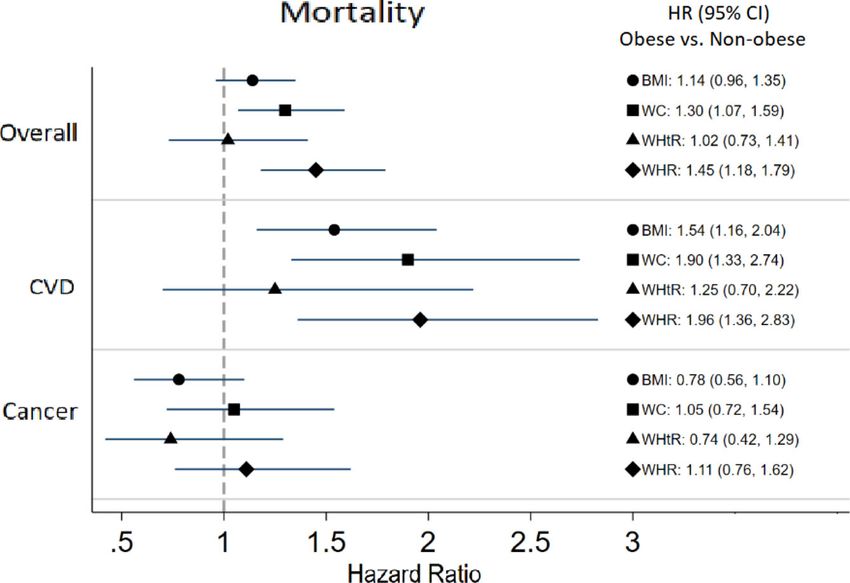
Min et al. BMC Public Health   (2021) 21:50                                                                  Page 2 of 10

  The J-shaped relationship between BMI and overall           2013). Surveillance of CVD events and deaths is still
mortality is perplexing and cannot be completely ex-          ongoing.
plained by potential selection biases, such as survival         BMI, WHtR and WHR were calculated from weight,
bias and healthy participant effect [6]. One plausible rea-   height, waist circumference and hip circumference mea-
son is that BMI does not differentiate the weight of fat      surements collected during clinical exams. Weight was
mass from the weight of lean body mass or fat mass dis-       measured to the nearest 0.1 kg and height to the nearest
tribution phenotypes across the BMI continuum and as          centimeter in light clothing and in stocking feet; waist
such is not a reliable measure of the risk of obesity-        circumference was measured to the nearest centimeter
related disease. In a prospective cohort study of US male     at the umbilicus; hip circumference (HC) was measured
health professionals, a strong positive monotonic associ-     to the nearest centimeter at the maximal protrusion.
ation was observed between predicted fat mass and over-       BMI was calculated as weight in kilograms divided by
all mortality and a U-shaped association between              height in meters squared (kg/m2) [15]. WHtR was calcu-
predicted lean body mass and overall mortality, suggest-      lated as waist circumference divided by height. WHR
ing the “obesity paradox” may be largely attributable to      was calculated as waist circumference divided by hip
low lean body mass, rather than low fat mass, in the          circumference.
lower BMI range [7]. Similarly, in a population-based co-       Vital status of participants was ascertained through an-
hort study of older men in UK [8], both sarcopenia and        nual follow-up interviews, death records from the Mis-
central adiposity were found to be associated with            sissippi State Health Department, obituaries and the
greater overall mortality, with the highest risk found in     National Death Index. Cause of death was assigned by
sarcopenic obese men.                                         applying algorithms developed by the National Center
  Waist circumference (WC) is the most common                 for Health Statistics (NCHS) using death certificates in
and simplest way to measure central adiposity, which          accordance with the International Statistical Classifica-
is a major contributor to disease and death. Among            tion of Diseases and Related Health Problems, Tenth Re-
African Americans who are known to have relatively            vision (ICD-10) [16] and was provided by the Mississippi
less of their body mass in their trunks and relatively        State Health Department. For out-of-state deaths, causes
more in their extremities compared to non-Hispanic            of death were based on ICD codes for the underlying
white, WC measures of obesity may offer a more reli-          cause of death recorded on death certificates or entered
able assessment of obesity and mortality relationships        in the National Death Index. Causes of death were
[9]. In this study, we compared the associations of           grouped according to the list of “rankable” causes of
overall mortality with BMI and with other obesity             death used by the NCHS for reporting leading causes of
measures, including WC, waist-to-height ratio                 death in the US [17].
(WHtR) and waist-to-hip ratio (WHR) in the Jackson
Heart Study (JHS), a population-based African Ameri-          Analytic sample
can cohort in the US. We hypothesized that obesity            Because hip circumference measurements were collected
measures that incorporate waist circumference, a bet-         at Exam 2 but not at Exam 1, anthropometric data
ter measure of central adiposity and risk of obesity-         collected at Exam 2 were used for the purpose of this
related disease than BMI, will show a more consistent         analysis so that the performance of all obesity measures
pattern of increasing risk of overall mortality with in-      could be compared on the same set of participants.
creasing level of obesity. In addition, we also evalu-        Participants who did not return for Exam 2 (n = 1101),
ated the associations of these obesity measures with          with BMI < 18.5 kg/m2 (n = 24), with missing data on
two leading causes of mortality, CVD and cancer,              any of the obesity measures (n = 142) or smoking sta-
given the strong correlations between measures of             tus (n = 63) were excluded. There were 3976 partici-
obesity and cardiometabolic risk factors as well as           pants in the analytic sample. All deaths occurring
risks of some cancers [10–12].                                through December 31, 2016 (administrative censoring
                                                              date) were included in the analysis.
Methods
Data source                                                   Statistical analysis
The design and data collection of the JHS has been pre-       Survival functions by obesity status (obese/non-obese)
viously described [13, 14]. Between September 2000 and        were estimated using the Kaplan-Meier estimator and
March 2004, 5306 African Americans, ages 20 to 95             compared using the log-rank test. “Time 0” for the sur-
years, living in the Jackson, Mississippi metropolitan area   vival analyses was the date of Exam 2 and the adminis-
were enrolled. Three clinical examinations were con-          trative censoring date was December 31, 2016. The
ducted between 2000 and 2013 (Exam 1 (baseline):              median length of follow-up was 9.2 (range: 0.01–11.2)
2000–2004; Exam 2: 2005–2008; and Exam 3: 2009–               years. Deaths due to CVD included cause of death with
Min et al. BMC Public Health (2021) 21:50 Page 3 of 10
ICD-10 codes I00-I78 and deaths due to cancer included Results
cause of death with ICD-10 codes C00-C97. Obesity sta- Description of analytic sample
tus (obese/non-obese) was classified based on cut-points The mean age of the analytic sample (n = 3976) was
recommended by guidelines or reported in the literature 59.8 years, 64.5% were women and 12.4% were current
for each obesity measure as follows: BMI ≥ 30 kg/m2; smokers. The prevalence of obesity was high but varied
WC > 88 cm for women or > 102 cm for men; WHtR widely depending on which measure was used to classify
≥0.5; WHR ≥ 0.85 for women or ≥ 0.9 for men [18–20]. obesity, ranging from 55.5% (n = 2205) per BMI, 65.0%
Obesity measures were analyzed as dichotomous vari- (n = 2585) per WHR, 68.4% (n = 2719) per WC, to 91.1%
ables (obese/non-obese) as well as continuous variables (n = 3622) per WHtR. The descriptive statistics of
using restricted cubic spline with 4 knots to evaluate the anthropometric measures of the analytic sample, overall
non-linear relationship with mortality. The knots were and by subgroups, are shown in Table 1.
placed at 5th, 35th, 65th and 95th percentiles as sug-
gested by Harrell [21]. A model with waist and hip cir- Demographic characteristics by obesity status
cumferences as separate variables was also evaluated. For obesity per BMI, compared to non-obese partici-
Statistical significance of non-linearity was evaluated pants, obese participants were younger (< 60 years: 53.8%
using log likelihood ratio test (LRT) comparing restrict- vs. 45.7%), more likely to be women (70.8% vs. 56.6%)
ive cubic spline and linear models. and less likely to be current smokers (10.5% vs. 14.8%)
Cox regression models were performed for both un- (Table 2). In contrast, for obesity per WC, WHtR and
adjusted analyses and analyses adjusted for age, sex and WHR, obese participants were older than non-obese
smoking status (baseline covariates). For analyses of CVD participants. In addition, for obesity per WHR, obese
and cancer mortalities, deaths due to other causes were participants were more likely to be men and current
treated as a competing risk and were analyzed using smokers than non-obese participants.
methods proposed by Fine and Gray [22]. Age was ana-
lyzed as a continuous variable. Smoking status was classi- Overall mortality
fied as current/non-current smokers. Possible effect Obesity measures as dichotomous variables (obese/non-
modifications by age, sex and smoking status were tested obese)
by adding three second-order interaction terms in the There were a total of 551 deaths in the analytic sample.
models. A two-sided p-value < 0.05 was considered statis- The overall mortality rate was 15.4 per 1000 person-
tically significant for all analyses. Sensitivity analysis ex- years. The Kaplan-Meier plots of overall mortality by
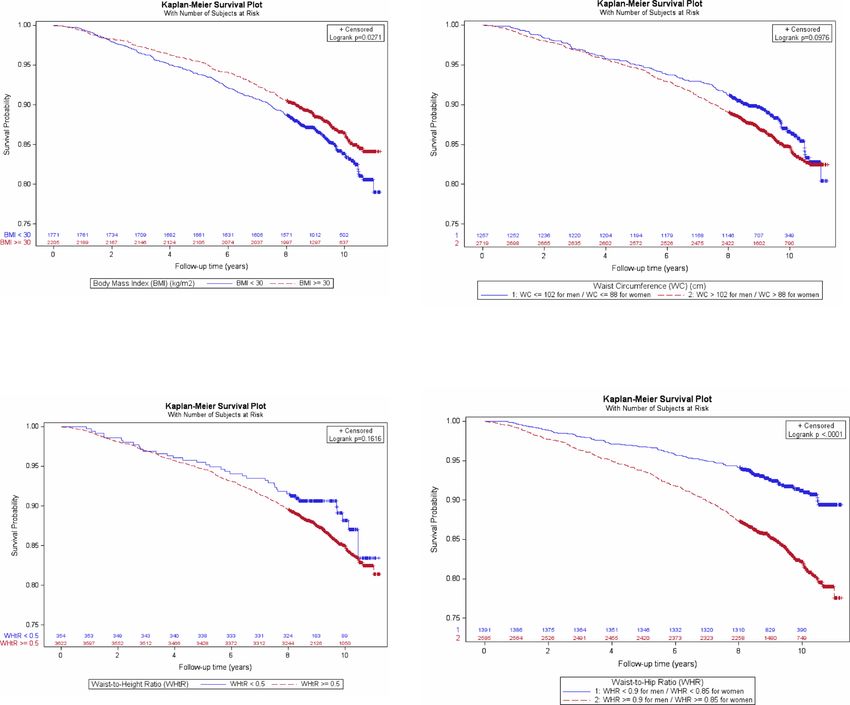
cluding “early deaths,” defined as participants who died obesity status (obese/non-obese) are shown in Fig. 1(a)
within one year of enrollment, was performed to exclude to (d). In the unadjusted analysis, obese participants had
participants who may have had a low BMI due to wasting. significantly lower overall mortality compared to non-
Table 1 Descriptive statistics of anthropometric measures of the analytic sample, Exam 2 (2005–2008)
N (%) Weight (kg) Height (cm) WC (cm) HC (cm) BMI (kg/m2) WHtR WHR
Mean (SD) Mean (SD) Mean (SD) Mean (SD) Mean (SD) Mean (SD) Mean (SD)
Overall 3976 (100) 91.2 (21.1) 168.6 (9.5) 102.2 (15.7) 114.3 (14.5) 32.1 (7.1) 0.61 (0.10) 0.89 (0.08)
Age, years
20–39 183 (4.6) 99.9 (29.4) 171.0 (10.0) 102.5 (20.6) 117.5 (17.6) 34.2 (9.8) 0.60 (0.12) 0.87 (0.08)
40–59 1814 (45.6) 94.4 (22.0) 169.7 (9.4) 102.1 (16.2) 115.5 (15.0) 32.8 (7.4) 0.60 (0.10) 0.88 (0.08)
≥ 60 1979 (49.8) 87.3 (18.3) 167.3 (9.3) 102.4 (14.7) 112.9 (13.5) 31.2 (6.3) 0.61 (0.09) 0.91 (0.07)
Sex
Women 2564 (64.5) 88.5 (20.7) 163.6 (6.6) 101.5 (16.1) 116.6 (15.2) 33.0 (7.4) 0.62 (0.10) 0.87 (0.07)
Men 1412 (35.5) 95.9 (20.8) 177.6 (6.9) 103.6 (14.7) 110.1 (12.0) 30.3 (6.0) 0.58 (0.08) 0.94 (0.06)
Smoking Status
Current smoker 493 (12.4) 88.5 (20.4) 170.6 (9.4) 100.7 (14.3) 110.4 (13.2) 30.4 (6.6) 0.59 (0.09) 0.91 (0.07)
Non-current smoker 2483 (87.6) 91.5 (21.1) 168.3 (9.5) 102.5 (15.9) 114.9 (14.6) 32.3 (7.1) 0.61 (0.10) 0.89 (0.08)
BMI (kg/m2)
< 30 1771 (44.5) 76.1 (11.1) 169.7 (9.5) 91.1 (9.0) 103.5 (6.7) 26.3 (2.5) 0.54 (0.05) 0.88 (0.07)
≥ 30 2205 (55.5) 103.2 (19.3) 167.7 (9.3) 111.2 (14.1) 123.0 (13.2) 36.7 (6.1) 0.66 (0.08) 0.91 (0.08)
SD standard deviation, BMI body mass index, WC waist circumference, HC hip circumference, WHtR waist-to-height ratio, WHR waist-to-hip ratioMin et al. BMC Public Health (2021) 21:50 Page 4 of 10
Table 2 Demographic characteristics of Jackson Heart Study Participants by obesity status, Exam 2 (2005–2008)
BMI WC WHtR WHR
Non-obese Obese Non-obese Obese Non-obese Obese Non-obese Obese
N = 1771 N = 2205 N = 1257 N = 2719 N = 354 N = 3622 N = 1391 N = 2585
% % % % % % % %
Age, years
Mean (SD) 61.2 (12.6) 58.6 (11.8) 58.7 (12.8) 60.3 (11.9) 55.3 (12.8) 60.2 (12.1) 56.4 (12.2) 61.6 (11.8)
20–39 4.0 5.1 5.7 4.1 9.0 4.2 6.8 3.4
40–59 41.7 48.8 47.8 44.6 55.4 44.7 55.5 40.3
≥ 60 54.3 46.2 46.5 51.3 35.6 51.2 37.7 56.3
Sex
Women 56.6 70.8 40.6 75.5 55.1 65.4 75.3 58.7
Men 43.4 29.2 59.4 24.5 44.9 34.6 24.7 41.3
Smoking Status
Current smoker 14.8 10.5 14.2 11.6 17.5 11.9 9.8 13.8
Non-current smoker 85.2 89.5 85.8 88.4 82.5 88.1 90.2 86.2
BMI body mass index, WC waist circumference, WHtR waist-to-height ratio, WHR waist-to-hip ratio
obese participants per the definition by BMI (hazard The effect of having multiple determinants of obesity
ratio (HR) 0.83 (95% CI 0.70, 0.98)) (Table 3). After We performed additional analysis to explore the effect
adjusting for age, sex and smoking status, the adjusted of having multiple determinants of obesity on overall
HRs for overall mortality were 1.14 (95% CI 0.96, 1.35), mortality. Only BMI, WC and WHR were included in
1.30 (95% CI 1.07, 1.59), 1.02 (95% CI 0.73, 1.41) and this analysis because WHtR classified over 90% of partic-
1.45 (95% CI 1.18, 1.79) comparing obese to non-obese ipants as obese in our sample and was not associated
participants per definitions by BMI, WC, WHtR and with overall mortality. As shown in Table 4, the larger
WHR, respectively (Table 3, Fig. 3). the number of determinants present, the greater the
mortality risk. The adjusted HRs for overall mortality
were 1.19 (95% CI 0.86, 1.65), 1.22 (95% CI 0.90, 1.67)
Obesity measures as continuous variables
and 1.54 (95% CI 1.16, 2.06) for having 1, 2 and 3 deter-
When obesity measures were analyzed as continuous
minants, respectively. To address whether the combin-
variables using restrictive cubic spline, we observed, for
ation of determinants matters, we further evaluated all
overall mortality, a J-shaped relationship with BMI, WC
combinations of 2 determinants of obesity and the rela-
and WHtR (Fig. 2(a) to (c)) and a monotonic increasing
tive mortality risks. As shown in Table 5, only the com-
relationship with WHR (Fig. 2(d)) after adjusting for age,
binations that included WHR showed overall significant
sex and smoking status. The improvement in model fit
associations with mortality (Type 3 Test p-value < 0.05)
comparing the restricted cubic spline and linear models
(scenarios b and c). The adjusted HRs were 1.50 (95% CI
for WHR was not statistically significant (LRT, p = 0.90).
1.15, 1.97) and 1.54 (95% CI 1.17, 2.04) for combinations
In the model with waist and hip circumferences as sep-
of BMI obese + WHR obese and WC obese + WHR
arate variables, we observed a monotonic increase in
obese, respectively.
overall mortality with increasing WC after adjusting for
hip circumference and a clear decreasing trend in overall
CVD and cancer mortalities
mortality with increasing hip circumference up to 120
There were 210 CVD deaths and 143 cancer deaths in
cm after adjusting for WC. The model fit with WC (lin-
the analytic sample. The CVD and cancer mortality rates
ear) and hip circumference (cubic splines) as separate
were 5.9 and 4.0 per 1000 person-years, respectively.
variables was better than with waist-hip-ratio (linear) as
Obesity had a greater effect on CVD mortality than
a single variable (LRT, p < 0.001).
on overall mortality. The adjusted HRs for CVD mor-
tality were 1.54 (95% CI 1.16, 2.04), 1.90 (95% CI
Effect modifications by age, sex and smoking status 1.33, 2.74), 1.25 (95% CI 0.70, 2.22) and 1.96 (95% CI
No statistically significant interactions were found 1.36, 2.83) comparing obese to non-obese participants
between age, sex or smoking status and obesity on mor- per definitions by BMI, WC, WHtR and WHR,
tality risk whether obesity measures were analyzed as respectively (Fig. 3). No associations were found
dichotomous or continuous variables (LRT, p > 0.05). between obesity and cancer mortality (Fig. 3).Min et al. BMC Public Health (2021) 21:50 Page 5 of 10 Fig. 1 Kaplan-Meier survival plot for overall mortality by obesity status (obese/non-obese) Discussion “early deaths,” defined as participants who died within one Our results show that obesity classified per WC and year of enrollment and thus may have low BMI due to WHR, but not per BMI or WHtR, was associated with a wasting. significantly higher overall mortality after adjusting for We found that both WHR and WC adjusted for HC, age, sex and smoking status. We found a J-shaped rela- but not WC alone, were linearly associated with overall tionship between BMI, WC, WHtR and overall mortality mortality. This finding suggests that not only body fat and a linear relationship between WHR and overall mor- but also the distribution of body fat is important in dis- tality. We found similar results for obesity classified per criminating overall mortality risk. In a recent study, BMI, WC, WHR, and WHtR and CVD mortality. How- using computed tomography (CT)-measured body fat, ever, we found no associations between any of the obes- including both visceral and subcutaneous fat area, Lee ity classifications and cancer mortality. et al. [23] showed that only the visceral-to-subcutaneous Our findings on BMI and overall mortality were con- fat area ratio (VSR) was independently associated with sistent with findings reported in the literature. Over- overall mortality in the fully adjusted model with age, weight and mild obesity were associated with a lower sex, comorbidities and total fat mass. In another study overall mortality compared with normal BMI (BMI < 25). using data from NHANES, Dong et al. [24] demon- This “J-shaped” association persisted even after excluding strated that both amount of body fat and body fat
Min et al. BMC Public Health          (2021) 21:50                                                                                                    Page 6 of 10

Table 3 Overall mortality: obese vs. non-obese
                             #event/#obs                   Mortality (95% CI)                     HR (95% CI)                     HR (95% CI)
                                                           (/1000 Person-Years)                   Unadjusted                      Age-sex-smoking Adjusted
Total                        551/3976                      15.4 (14.3, 16.5)                      …                               …
           2
BMI, kg/m
  Non-obese                  269/1771                      17.0 (15.4, 18.8)                      1.00                            1.00
  Obese                      282/2205                      14.1 (12.8, 15.6)                      0.83 (0.70, 0.98)               1.14 (0.96, 1.35)
WC, cm
  Non-obese                  156/1257                      13.8 (12.0, 15.8)                      1.00                            1.00
  Obese                      395/2719                      16.2 (14.9, 17.6)                      1.17 (0.97, 1.41)               1.30 (1.07, 1.59)
WHtR
  Non-obese                  39/354                        12.3 (9.4, 16.1)                       1.00                            1.00
  Obese                      512/3622                      15.7 (14.6, 16.9)                      1.26 (0.91, 1.75)               1.02 (0.73, 1.41)
WHR
  Non-obese                  114/1391                      9.0 (7.7, 10.4)                        1.00                            1.00
  Obese                      437/2585                      19.0 (17.5, 20.6)                      2.13 (1.73, 2.61)               1.45 (1.18, 1.79)
HR hazard ratio, CI confidence interval, BMI body mass index, WC waist circumference, HC hip circumference, WHtR waist-to-height ratio, WHR waist-to-hip ratio

distribution (measured via WHR) were independently                                 would be expected, obesity had a greater effect on CVD
associated with overall mortality and the effect was sex-                          mortality than on overall mortality. Of note, although
dependent.                                                                         BMI ≥ 30 kg/m2 (obese) was not associated with overall
   Some investigators have advocated that waist and hip                            mortality after adjusting for age, sex and smoking com-
circumferences be considered as separate variables and                             pared to BMI < 30 kg/m2, BMI-defined obesity was asso-
not as a ratio, considering two persons with the same                              ciated with a higher CVD mortality. This reaffirms the
WHR may have markedly different levels of waist cir-                               usefulness of this commonly used obesity indicator for
cumferences [25]. We evaluated this approach in our                                monitoring trends of obesity and cardiovascular health.
study and found that the model with waist and hip cir-                               We did not find an association between obesity and can-
cumferences as separate variables outperformed the                                 cer mortality. It is possible that obesity-related metabolic
model with WHR in predicting overall mortality. These                              dysregulations rather than merely obesity are required to
results provide further support on the interplay of the                            show an association with cancer mortality [27, 28]. For
visceral and gluteofemoral fat depots and body shape on                            example, in an analysis using data collected in the REasons
overall mortality. Possible mechanisms of the protective                           for Geographic and Racial Differences in Stroke (REGA
effect of gluteofemoral fat include long-term fatty acid                           RDS) study, obesity was shown to be associated with a re-
storage in this location thus reducing adverse effects as-                         duced risk for cancer mortality whereas glucose dysregula-
sociated with ectopic fat deposition [26]. Gluteofemoral                           tion and metabolic syndrome were associated with an
fat has also been found to be associated with a beneficial                         increased risk for cancer mortality [28].
adipokine profile, positively associated with leptin and                             A limitation of the study is that because JHS is a sam-
adiponectin levels and negatively associated with inflam-                          ple of African Americans, we are unable to address dir-
matory cytokines [26].                                                             ectly whether or not race matters in body composition
   Our analyses exploring the effect of having multiple                            or outcome in this study. It has been observed that body
determinants of obesity on overall mortality showed that                           compositions differ across race/ethnic groups. For a
adding BMI or WC to WHR as determinants of obesity                                 given BMI, non-Hispanic (NH) blacks typically have the
did not substantially improve the prediction of mortality                          lowest percent fat mass (%fat) followed by NH whites
risks. Participants deemed obese by WHR were 45%                                   and Mexican Americans have the greatest %fat [9]. NH
more likely to die compared to those deemed not obese.                             blacks also have smaller waist circumferences than NH
Whereas participants deemed obese by both BMI and                                  whites and Mexican Americans with similar BMI. There-
WHR were 50% more likely to die compared to those                                  fore, the findings of this study may not be generalizable
deemed obese by neither; participants deemed obese by                              to other race or ethnic groups.
both WC and WHR were 54% more likely to die com-
pared to those deemed obese by neither.                                            Conclusions
   Our findings of the effects of obesity on CVD mortal-                           In conclusion, we found that obesity classified by WC
ity were similar to those on overall mortality and, as                             and WHR was significantly associated with an increased
Min et al. BMC Public Health (2021) 21:50 Page 7 of 10
Fig. 2 Adjusted hazard ratios* for overall mortality: analysis using restricted cubic splines
risk of overall and CVD mortality in this large cohort of warranted to determine the extent to which: (1) WC
African Americans. Additionally, obesity classified by and/or WHR strata can be used as mortality risk indica-
BMI was significantly associated with an increased risk tors in research and population health policy for African
of CVD mortality. WHR was the only obesity measure Americans as is currently being done for BMI; and (2)
that showed a monotonic increasing relationship with individuals with normal BMI but in high risk WC and/
overall and CVD mortality. Further studies are or WHR strata might represent an appreciable target
Table 4 Overall mortality: hazard ratios by number of determinants of obesity
# Determinants Present N (%) HR (95% CI) Type 3 Test P-value Based on Wald statistics
Age-sex-smoking Adjusted
0 658 (16.6) 1.00 (Ref) 0.0075
1 673 (16.9) 1.19 (0.86, 1.65)
2 1099 (27.6) 1.22 (0.90, 1.67)
3 1546 (38.9) 1.54 (1.16, 2.06)
HR hazard ratio, CI confidence intervalMin et al. BMC Public Health (2021) 21:50 Page 8 of 10
Table 5 Overall mortality: hazard ratios with different combinations of determinants of obesity
Scenario # Determinants N (%) HR (95% CI) Type 3 Test P-value Based on Wald
Present Age-sex-smoking statistics
Adjusted
(a) BMI + WC
Non-obese 0 1140 (28.7) 1.00 (Ref) 0.0758
BMI obese or WC obese 1 748 (18.8) 1.12 (0.87, 1.43)
BMI obese and WC obese 2 2088 (52.5) 1.27 (1.03, 1.57)
(b) BMI + WHR
Non-obese 0 785 (19.7) 1.00 (Ref) 0.0062
BMI obese or WHR obese 1 1592 (40.0) 1.24 (0.95, 1.62)
BMI obese and WHR obese 2 1599 (40.2) 1.50 (1.15, 1.97)
(c) WC + WHR
Non-obese 0 722 (18.2) 1.00 (Ref) 0.0008
WC obese or WHR obese 1 1204 (30.3) 1.16 (0.86, 1.57)
WC obese and WHR obese 2 2050 (51.6) 1.54 (1.17, 2.04)
HR hazard ratio, CI confidence interval, BMI body mass index, WC waist circumference, HC hip circumference, WHtR waist-to-height ratio, WHR waist-to-hip ratio
Fig. 3 Adjusted hazard ratios* for overall, CVD and cancer mortalityMin et al. BMC Public Health (2021) 21:50 Page 9 of 10
population subgroup for potential lifestyle modification. Ethics approval and consent to participate
Our findings suggest that WHR, a measure that captures The study was approved by the Institutional Review Boards of the four
participating institutions (Jackson State University, Tougaloo College, the
both central adiposity and body composition, may be an Mississippi State Department of Health and the University of Mississippi
important anthropometric measure to collect to monitor Medical Center) and participants provided written informed consent.
obesity and obesity-related risks among African
Consent for publication
Americans. These findings should be verified in other
Not applicable.
ethnically diverse populations.
Competing interests
Abbreviations None.
BioLINCC: Biologic Specimen and Data Repository Information Coordinating
Center; BMI: Body mass index; cm: Centimeters; CI: Confidence interval; Received: 27 February 2020 Accepted: 9 December 2020
CT: Computed tomography; CVD: Cardiovascular disease; HC: Hip
circumference; HR: Hazard ratio; ICD: International classification of diseases;
ICD-10: International Statistical Classification of Diseases and Related Health References
Problems, Tenth Revision; JHS: Jackson Heart Study; kg: Kilograms; kg/ 1. Flegal KM, Kit BK, Orpana H, Graubard BI. Association of all-cause mortality
m2: Kilograms divided by meters squared; LRT: Likelihood ratio test; with overweight and obesity using standard body mass index categories: a
NCHS: National Center for Health Statistics; NH: Non-Hispanic; NHAN systematic review and meta-analysis. JAMA. 2013;309:71–82.
ES: National Health and Nutrition Examination Survey; NHLBI: National Heart, 2. Donini LM, Savina C, Gennaro E, De Felice MR, Rosano A, Pandolfo MM, Del
Lung, and Blood Institute; NIMHD: National Institute for Minority Health and Balzo V, Cannella C, Ritz P, Chumlea WMC. A systematic review of the
Health Disparities; REGARDS: REasons for Geographic and Racial Differences literature concerning the relationship between obesity and mortality in the
in Stroke study; SD: Standard deviation; UK: United Kingdom; US: United elderly. J Nutr Health Aging. 2012;16:89–98.
States; VSR: Visceral-to-subcutaneous fat area ratio; WC: Waist circumference; 3. Oga EA, Eseyin OR. The obesity paradox and heart failure: a systematic
WHR: Waist-to-hip ratio; WHtR: Waist-to-height ratio review of a decade of evidence. J Obesity. 2016. Artical ID 904024.
4. Schmidt DS, Salahudeen AK. Cardiovascular and survival paradoxes in
dialysis patients: obesity-survival paradox-still a controversy? Semin Dial.
Acknowledgements
2007;20:486–92.
The authors thank the participants and data collection staff of the Jackson
5. Cao C, Wang R, Wang J, Bunjhoo H, Xu Y, Xiong W, Simpson C. Body mass
Heart Study.
index and mortality in chronic obstructive pulmonary disease: a meta-
analysis. PLoS One. 2012;7:e43892.
Disclaimer 6. Zheng H, Dirlam J. The body mass index-mortality link across the life course:
The findings and conclusions in this report are those of the authors and do two selection biases and their effects. PLOS ONE. 2016. https://doi.org/10.
not necessarily represent the views of the National Heart, Lung, and Blood 1371/journal.pone.0148178.
Institute; the National Institute for Minority Health and Health Disparities; the 7. Lee DH, Keum N, Hu FB, Orav EJ, Rimm EB, Willet WC. Giovannucci.
National Institutes of Health; or the U.S. Department of Health and Human Predicted lean body mass, fat mass, and all cause and cause specific
Services. mortality in men: prospective US cohort study. BMJ. 2018;362:k2575.
8. Atkins JL, Whincup PH, Morris RW, Lennon LT, Papacosta O, Wannamethee
SG. Sarcopenic obsesity and risk of cardiovascular disease and mortality: a
Authors’ contributions population-based cohort study of older men. J Am Geriatr Soc. 2014;62:
YM–analysis and interpretation of data, drafting and final approval of the 253–60.
manuscript; YG–statistical expertise, critical review and final approval of the 9. Heymsfield SB, Peterson CM, Thomas DM, Heo M, Schuna JM Jr. Why are
manuscript; PA–acquisition of data; critical review and final approval of the there race/ethnic differences in adult body mass index-adiposity
manuscript; AA–helped conduct the literature review, critical review and final relationships? A quantitative critical review. Obes Rev. 2016;17:262–75.
approval of the manuscript; AC–conception and design of study, critical 10. Lee CMY, Huxley RR, Wildman RP, Woodward M. Indices of abdominal
review and final approval of manuscript. All authors have read and approved obesity are better discriminators of cardiovascular risk factors than BMI: a
the manuscript. meta-analysis. J Clin Epidemiol. 2008;61:646–53.
11. Bell RA, Chen H, Saldana S, Bertoni AG, Effoe VS, Hairston KG, Kalyani RR,
Funding Norwood AF. Comparison of measures of adiposity and cardiovascular
The Jackson Heart Study is supported by contracts from the National Heart, disease risk factors among African American adults: the Jackson Heart Stuty.
Lung, and Blood Institute (NHLBI) and the National Institute for Minority J Racial Ethn Health Disparities. 2018;5:1230-7.
Health and Health Disparities (NIMHD) and is conducted in collaboration 12. Lauby-Sevretan B, Scoccianti C, Loomis D, Grosse Y, Bianchini F, Straif K, for
with Jackson State University (HHSN268201800013I), Tougaloo College the International Agency for Research on Cancer Handbook Working Group.
(HHSN268201800014I), the Mississippi State Department of Health Body fatness and Cancer – viewpoint of the IARC working group. NEJM.
(HHSN268201800015I) and the University of Mississippi Medical Center 2016;375:794–8.
(HHSN268201800010I, HHSN268201800011I and HHSN268201800012I). The 13. Taylor HA. The Jackson heart study: an overview. Ethnicity Dis. 2005;15(4
funding agency did not play a role in the design of the study and collection, Suppl 6):1–3.
analysis, and interpretation of data and in writing the manuscript. 14. Carpenter MA, Crow R, Steffes M, Rock W, Heilbraun J, Evans G, Skelton T,
Jensen R, Sarpong D. Laboratory, reading center, and coordinating center
data management methods in the Jackson heart study. Am J Med Sci. 2004;
Availability of data and materials 328:131–44.
As a National Heart, Lung, and Blood Institute (NHLBI)-funded study, the JHS 15. Keys A, Karvonen N, Kimura N, Taylor HL. Indices of relative weight and
follows the NHLBI’s Policy for Data Sharing, which includes depositing the obesity. J Chronic Dis. 1972;25:329–43.
data into the NHLBI’s Biologic Specimen and Data Repository Information 16. World Health Organization. International statistical classification of diseases
Coordinating Center (BioLINCC) to make it publically available to other and related health problems, tenth revision (ICD–10). 2008 ed. Geneva:
investigators. The link to the JHS dataset: https://biolincc.nhlbi.nih.gov/ World Health Organization; 2009.
studies/jhs/. Further download directions are provided on the website. NHLBI 17. Heron M. Deaths: Leading causes for 2012. National vital statistics reports;
further requires the JHS to maintain the accuracy of this dataset, so the JHS vol 64 no 10. Hyattsville, MD: National Center for Health Statistics; 2015.
Coordinating Center sends modifications to BioLINCC for incorporation as 18. National Institutes of Health. Clinical guidelines on identification, evaluation
appropriate. Privacy and access settings are controlled by BioLINCC, and the and treatment of overweight and obesity in adults. Obes Res. 1998;6(Suppl
investigators have no influence on these settings. 2):51S–209S Erratum in Obes Res. 1998;6:464.Min et al. BMC Public Health (2021) 21:50 Page 10 of 10
19. World Health Organization. Waist circumference and waist–hip ratio: report
of a WHO expert consultation, Geneva, 8–11 December 2008. World Health
Organization; 2011.
20. Ashwell M, Gunn P, Gibson S. Waist-to-height ratio is a better screening tool
than waist circumference and BMI for adult cardiometabolic risk factors:
systematic review and meta-analysis. Obes Rev. 2012;13:275–86.
21. Harrell FE. Regression modeling strategies with applications to linear
models, logistic and ordinal regression and survival analysis, 2nd ed. Cham:
Springer-Verlag; 2015. ISBN 978-3-319-19424-0.
22. Fine JP, Gray RJ. A proportional hazards model for the subdistribution of a
competing risk. J Am Stat Assoc. 1999;94:496–509.
23. Lee SW, Son JY, Kim JM, Hwang S, Han JS, Heo NJ. Body fat distribution is
more predictive of all-cause mortality than overall adiposity. Diabetes Obes
Metab. 2018;20:141–7.
24. Dong B, Peng Y, Wang Z, Adegbija O, Hu J, Ma J, Ma YH. Joint association
between body fat and its distribtuion with all-cause mortality: a data
linkage cohort study based on NHANES (1988-2011). PLoS One. 2018;13(2):
e0193368.
25. Cameron AJ, Magliano DJ, Soderberg S. A systematic review of the impact
of including both waist and hip waist circumference in risk models for
cardiovascular diseases, diabetes and mortality. Obes Rev. 2013;14:86–94.
26. Manolopoulos KN, Karpe F, Frayn KN. Gluteofemoral body fat as a
determinant of metabolic health. Int J Obes. 2010;34:949–59.
27. Gallagher EJ, LeRoith D. Obesity and diabetes: the increased risk of cancer
and cancer-related mortality. Physiol Rev. 2015;95:727–48.
28. Akinyemiju T, Moore JX, Judd S, Lakoski S, Goodman M, Safford MM, Pisu M.
Metabolic dysregulation and cancer mortality in a national cohort of blacks
and whites. BMC Cancer. 2017;17:856.
Publisher’s Note
Springer Nature remains neutral with regard to jurisdictional claims in
published maps and institutional affiliations.You can also read