Forecasting Impact of Demand Side Management on Malaysia's Power Generation using System Dynamic Approach
←
→
Page content transcription
If your browser does not render page correctly, please read the page content below
International Journal of Energy Economics and
                                                       Policy
                                                               ISSN: 2146-4553

                                               available at http: www.econjournals.com
                                  International Journal of Energy Economics and Policy, 2021, 11(4), 412-418.

Forecasting Impact of Demand Side Management on Malaysia’s
Power Generation using System Dynamic Approach

Muhammad Mutasim Billah Tufail1, Mohd Nasrun Mohd Nawi2*, Akhtiar Ali3, Faizal Baharum4,
Mohamad Zamhari Tahir5, Anas Abdelsatar Mohammad Salameh6
1
 Department of Management Sciences, Bahria University, Karachi Campus, Pakistan, 2Disaster Management Institute, School of
Technology Management and Logistics, Universiti Utara Malaysia, Malaysia, 3Wuhan University of Technology, China, 4School of
Housing, Building and Planning, Universiti Sains Malaysia, 11800, Penang, Malaysia, 5Faculty of Business and Management, DRB-
HICOM University of Automotive Malaysia, 26607, Pekan, Pahang, Malaysia, 6Department of Management Information Systems
College of Business Administration, Prince Sattam bin Abdulaziz University, 165 Al-Kharj 11942, Saudi Arabia.
*Email: mohdnasrun@gmail.com

Received: 07 April 2020                                      Accepted: 08 February 2021                     DOI: https://doi.org/10.32479/ijeep.9716

ABSTRACT
Rapid economic growth, increasing population, industrialization and high living standards have increased the electricity demand more than ever before.
Efficient energy planning and management is always considered as the greatest challenge in all over the world. Among the other factors availability
of electricity is the main bottleneck to the economic growth and industrial revolution. Considering this fact, it becomes necessary for academicians,
government agencies and electricity companies to construct more efficient methodologies and procedures to predict long-term electricity demand. The
objective of this article represents the initiative towards understanding and analyzing the importance of demand-side management (DSM) in forecasting
electricity demand by using a system dynamics approach. This study examines the long term impact of demand-side management variables including
HER (Home energy report), MEPS (Minimum Energy Performance Standards) and NEEAP (National Energy Efficiency Action Plan). The future
installation capacity of Malaysia’s power generation is evaluated considering the factors of population, per capita electricity consumption, efficiency,
capacity margin and DSM. The forecasting horizon of the simulation model is 15 years from 2016 to 2030.
Keywords: Energy Forecasting, System Dynamics, Energy Efficiency, Energy Demand Side Management
JEL Classifications: O18; Q21

                    1. INTRODUCTION                                           diversification policies for optimum generation portfolio.
                                                                              Electricity demand forecasting can be classified into two
An uninterrupted supply of electricity is considered as an                    categories, (1) Short-term forecasting usually utilizes for routine
essential component for human development in the 21st century.                load balancing activities and (2) long-term forecasting adopted
The fundamental requirement for effective government policies                 for the formulation of government policies. Energy planning has
is to ensure affordable, acceptable and consistent supplies of                been recognized as a complex problem because of its critical role
electricity to all sectors (Tufail et al., 2018a; Dooyum et al,               in the other sectors of society (Hook and Tang, 2013; Nelwan
2020; Geng, 2021). In this regard appropriate electricity demand              et al., 2021). Several studies have been conducted addressing
forecasting is essential. The electricity demand forecasting can be           different issues in the energy sector. Jebraj and Iniyan (2006)
implemented in generation capacity enhancement, uninterrupted                 reviewed numerous models and categorized the energy sector as
availability of supplies, managing fuel prices and formulating                planning, forecasting, optimization, energy supply and demand,

                              This Journal is licensed under a Creative Commons Attribution 4.0 International License

    412                                                 International Journal of Energy Economics and Policy | Vol 11 • Issue 4 • 2021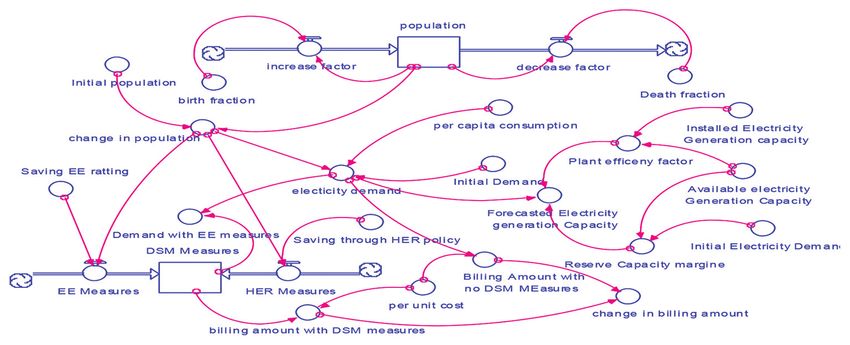
Tufail, et al.: Forecasting Impact of Demand Side Management on Malaysia’s Power Generation using System Dynamic Approach

neural networks and fuzzy logic. Specifically, energy demand                  represented by a water tank which level is actually controlled by
models can be classified in different ways including univariate               the inflow and out flow of water.
versus multivariate, static versus dynamic, and from time series
forecasting to hybrid modeling. The Malaysian energy sector                   The functionality of stock in a SD simulation model is expressed
has been reviewed by several researchers in the past (Ong et al.,             by an equation. Mathematically, a stock (S) can be represented as
2011; Ohetal, 2010; Jafareta, 2008). Studied carried out by Sukki             an integration of the difference between inflow and outflow over
et al. (2012) was focused on particular availability of resources;            a specific period of time.
however, Ahmed and Tahir (2014) assessed the prioritization
of renewable resources. Socovol and Drupady (2011) discuss                                       t =n

the issues of power generation projects. Although these studies
adopted both qualitative and quantitative methodologies still
                                                                                                  ∫
                                                                                           St = [ Inflow ( t ) − Outflow ( t )]dt + S (t0 )
                                                                                                 t =0                                         (1)
ignored some of the critical variables because of rigidness of
tool and complexity of the model. The accurate forecasting is                 Similarly, the rate of change in stock can be represented as
important for a sustainable future power generation mix. Several              a derivative at a specific interval of time. The mathematical
internal and external factors impact on the electricity demand                representation of flow (F) is shown in equation 2.
such as population growth, consumption pattern and equipment
efficiency, etc. Considering this fact, it is essential to adopt an
efficient and reliable tool which has provision to integrate several                             F = (Inflow - Outflow); F = ds (2)
                                                                                                                             dt
variables impacting on the system. System dynamic (SD) is
considered as the most appropriate tool which can be used to
                                                                              2.1. Overview of Malaysian Electricity Sector
measure the impact of numerous variables on a particular system
                                                                              Malaysia has experienced rapid economic growth along with
at a specific interval of time.
                                                                              social and environmental transformation since its inception (Hezri
                                                                              and Hasan, 2006;Tufail et al., 2018b; Jamaludin et al., 2019).
This study set to explores the intrinsic relationship among
                                                                              To accomplish the target of being a developed nation by 2020;
increasing population, per capita energy consumption and
                                                                              Malaysia is focusing more on sustainable growth and development
government initiatives in terms of Demand-side management.
                                                                              (Tahir et al., 2015). In this regard, Malaysia has targeted to achieve
Considering Malaysia as a case study an integrated system
                                                                              6% annual growth in its gross domestic product (GDP) compliance
dynamics model was developed coupled with a modeling structure
                                                                              with the requirement of 11th national action plan (EPU, 2015). To
based on the framework of IThink 9.0 software, which offered a
                                                                              attain the desired level of growth rate it is imperative for Malaysia to
realistic platform for predicting the trends of Malaysia’s electricity
                                                                              deeply visualize its future electricity demand considering the factors
demand by 2030 compliance with the Malaysian policies.
                                                                              of installed capacity as it is an integral component to support the
                                                                              nation’s capacity succession planning over an intermediate to long
                2. SYSTEM DYNAMICS                                            term period in order to sustain the economy. An adequate supply
                                                                              of electricity is one of the fundamental components of production,
The efficient policy formulation is highly dependent upon                     along with labor, capital and material.
the in-depth knowledge of decision-makers to understand the
relationship of variables within a system. Considering the cause-             The power generation sector of Malaysia is highly dominated by
and-effect of dynamic variables on a broad spectrum is a complex              fossil fuels which immensely contribute to exaggerated carbon in
process. To analyze the domain of interconnecting complex                     the environment causes serious health issues. Sustainable supplies
variables, J. Forrester has introduced the methodology of system              of electricity are one of the key contemporary issues of global
dynamics (SD) in 1960. SD is a firm approach that reveals the                 policymakers. According to 2016 Installed capacity data indicated
dynamic changes in a system considering the system holistically               that more than 70% capacity is based on fossil fuels followed by
to understanding, visualize and analyzing feedback in a system                hydropower with 18.6% of the total share. However, with respect to
(Forrester, 1969; Zhao et al., 2011; Lefaan et al., 2019).                    available capacity 87.7% share is occupied by fossil fuel resources.
                                                                              To be distinct, the 87.7% accounts for 42.6% natural gas, 28.9%
The four fundamental components of System dynamic modeling                    coal and 6.3% diesel/MFO (NEB, 2016). The transformation of the
are stock, flow, converters and connectors. The stock acts as                 Malaysian economy from agriculture to industrial has raised the
an accumulator and shoes the increasing and decreasing trend                  Malaysian living standards (Ahmed Majid and Zaidi, 2001). This
of tangible and non-tangible variables of the system such as                  trend will continue to grow and directly impacts on total power
electricity demand or behavior. The value of a stock is depended              consumption. From 1995 to 2016 the demand for electricity has
upon the flows. The increase and decrease of stock can be                     been increased from 38,820 GWh to 144,024 GWh (NEB, 2016)
controlled by in or out flows to and from the stock. Convertor                and is expected to increase 30% more by 2020 (MES, 2017; Tufail
contains information of variables, mathematic relationship and                et al., 2018). As shown in Figure 2, the major transition can be
impact; however, connectors are used to formulate a relationship              observed in domestic and commercial sectors from 2004 to 2016
between convertors flow and stock (Mirchi et al., 2012; Rehan                 because of the rapid population growth. The share in electricity
et al., 2011; Mayasari et al., 2019). Figure 1a shows the symbol              consumption is highest for the industrial sector at 47%, followed
of basic model building blocks. The concept of stock and flow                 by the commercial sector at 30.8%, the domestic sector at 21.6%,
can be easily understood from Figure 1b in which the stock is                 agriculture 0.4% and 0.2% for transport and other sectors.

                International Journal of Energy Economics and Policy | Vol 11 • Issue 4 • 2021                                                  413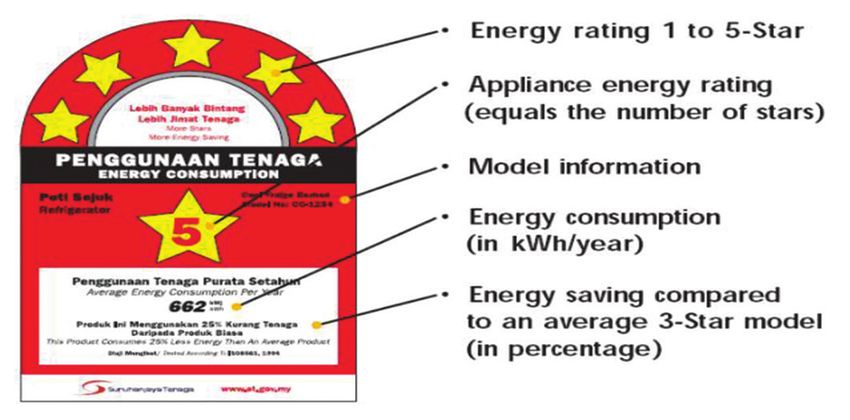
Tufail, et al.: Forecasting Impact of Demand Side Management on Malaysia’s Power Generation using System Dynamic Approach

                          Figure 1: (a) Functional blocks of SD model. (b): Conceptual diagram of SD working principles

                      a                                                       b

                                      Figure 2: Malaysia Electricity installed capacity and final consumption

Source: National Energy Balance, (2016)

The electricity consumption of domestic sector can be evaluated               2.2. Demand Side Management Measures
by several factors including the number of households, household              DSM refers to a technique to manage the demand for electricity
income, and average consumption level of per household (Othman                by introducing efficient measures i.e. (reducing use of electricity,
and Ong, 1996; Kamarudin and Ponniran, 2008). However, in                     changing the timing of usage during peak hour demand). The
commercial sector, Numbers of new buildings, office operational               adoption of DSM will reduce the demand for electricity generation
hours, number of employees can be used as an indicator for                    and also reduce loads on transmission and distribution systems.
measuring electricity consumption (Aun, 2004; Cheng, 2005;                    Some of the effective DSM measures are discussed below.
Masjuki et al., 2006). The consumption pattern of electricity
is directly proportional to economic growth and the increasing                2.2.1. Informative policy for efficient utilization of electricity
population. To cater the increasing demand government of                      One class of options is to provide information to electricity
Malaysia has shifted focus from increasing supply to meet demand              consumers on how to use energy wisely and efficiently and to
for reducing consumption by introducing Energy efficiency (EE)                provide pricing structures that help spur customers to change the
and Demand Side management (DSM) measures. This makes                         amount and timing of energy use, so consumers have informed
provision for DSM to serve as a countervailing force to the                   choices and control utility bills (TNB, 2017). In 2015 TNB
traditional supply-side framework or supply centric. DSM will                 initiated a program Home Energy Report (HER) to examine the
be a very useful mechanism to trim away the demand spikes,                    consumption behavior of electricity among its consumers. A pilot
which eventually helps in the reduction of CO2 and deferment of               study is conducted on 200,000 consumers in Klang Valley, state
generation planting up. The target has been set to achieve at least           of Melacca and Putrajaya which aims to provide the monthly
a 10% reduction in electricity consumption by the end of 2025                 consumption pattern of electricity to its consumer thought
and 15% by the end of 2030 respectively (Green Energy Report,                 advanced automated digital system. The aim is to provide detailed
2017). In order to accomplish the desired objects, Government                 information, including analysis of their energy consumption
of Malaysia has introduced several energy efficiency measures                 patterns with comparisons to similar houses in the neighborhood;
including Green Energy Master Plan (2017).                                    Year-on-year tracking of energy consumption patterns, with
1. Home Energy Report (HER)                                                   monthly household efficiency rankings; and Energy saving tips and
2. Minimum Energy Performance Standards (MEPS)                                EE measures. The pilot study has managed to save 13,979 MWh
3. National Energy Efficiency Action Plan (NEEAP)                             of electricity from July 2015 to June 2016 which is accountable

 414                                                   International Journal of Energy Economics and Policy | Vol 11 • Issue 4 • 2021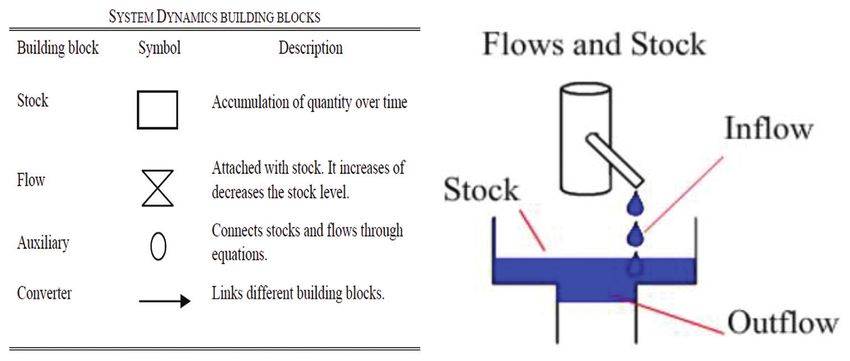
Tufail, et al.: Forecasting Impact of Demand Side Management on Malaysia’s Power Generation using System Dynamic Approach
to save 5,386,000 RM of billing amount. TNB is planning to
implement this program to the whole nation through web portals
in the near term. With the current standards, HER can manage
to save 70 kWh of per capita electricity consumption which is
approximately 1.5% of total electricity demand (TNB, 2017).
2.2.2. Higher-efficiency technologies and energy labeling
Energy-efficiency measures reduce energy consumption (and peak
loads) by substituting more efficient appliances and equipment
for less efficient units or systems. As shows in the Figure 3,
GOM introduces the 5-star efficiency program in 2013 with the The above model is designed to evaluate the relationship
collaboration of Suruhanjaya Tenaga (ST) under the name of between rising population and electricity demand. The per capita
Minimum Energy Performance Standard (MEPS). Initially, the consumption is used as an intermediately variable to forecast the
program is limited to a few high domestic energy consumption total electricity demand by the year 2030. The installation capacity
appliances such as refrigerators, air-conditioners, televisions, fans will be evaluated by considering the factors of plant efficiency and
as well as lighting. ST issued a certificate rated from 1 to 5 stars as reserve capacity margin. Finally, as per Malaysia’s green energy
per their Energy efficiency features. MEPS strictly monitors the said master plan 2017 the impact of DSM is evaluated on electricity
electric appliances in the Malaysian market to meet the maximum demand and total installed capacity with the ongoing policies of the
efficiency standard as per regulation. Table 1 discusses the amount National energy efficiency action plan of Malaysia. Table 3 shows
of electricity saved under the NEEAP policy in the last 10 years, the variables and equations of the designed dynamic model of
which is approximately 50,600 GWh. In terms of energy-saving forecasting population, electricity demand and installed capacity.
up till now NEEAP contributes 3.50 present of electricity per year.
4. RESULTS
2.2.3. Electricity Tariff
The cost of electricity from generation to distribution before
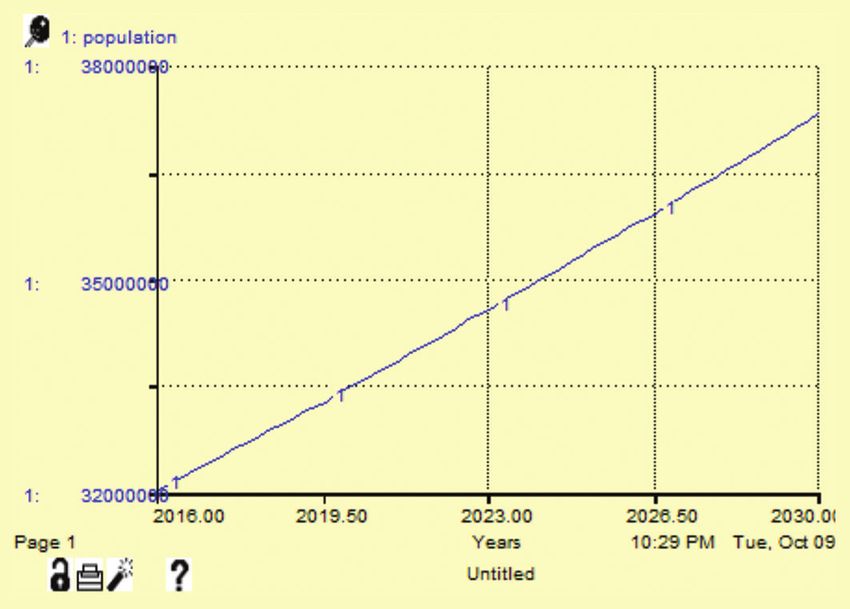
It has been acknowledged that the rising population is the main
reaching the end-user will be translated into a tariff. The current
driving factor of increasing electricity demand. Figure 4 depicts
tariff for domestic consumers is shown in Table 2. The monthly
the expected rising trend of the population from 2016 to 2030.
electricity usage was based on actual meter readings performed at
It is estimated that by the end of the year 2030 the Malaysian
the households. The average consumption was then multiplied by
population will reach around 36,508,851 people.
the billing period and the applicable tariff rates to determine the total
bill amount. Multiply the rate depends on the unit of energy use.
Concerning the base scenario, it is estimated that by the years 2030
the total electricity demand expected to reach at 156,507 GWh
3. THE MODEL on the other hand the increased in generation capacity should be
planned for 246,489 GWh considering 40% demand to reserve
System Dynamic Modeling (SDM) technique is a mechanism of margin (refer Figure 5). However, in the recent official report of a
studying relations between complex feedback systems, usually used green energy master plan (2017), GOM has proposed a reduction
in the absence of formal analytical models, however, the simulation in total demand by introducing the demand-side management
model can be developed by formulating linkage between several strategy discussed in Figure 6. In this regards the government
feedback components. To demonstrate the importance of feedback has adopted several measures including HER and MEPS under
relationships in determining the behavior of complex electricity the National energy efficiency action plan. Figure 6 illustrates the
demand forecasting system, our model considers population rising
trend, per capita electricity consumption and also evaluate the
Figure 4: Expected increase in population by 2030
impact of demand-side management on installation capacity of
Malaysia’s power generation.
Figure 3: 5-Star energy efficiency performance rating
Source: Oh et al. (2014)
International Journal of Energy Economics and Policy | Vol 11 • Issue 4 • 2021 415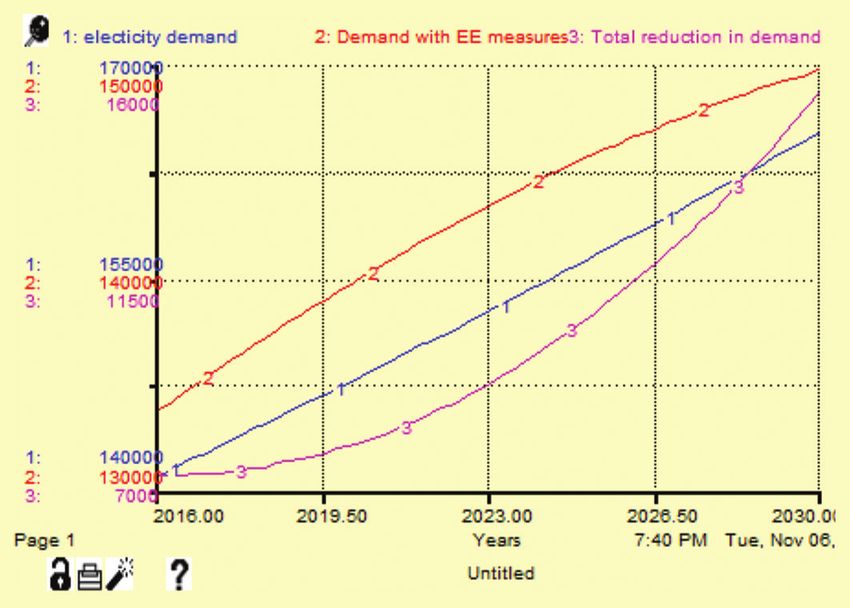
Tufail, et al.: Forecasting Impact of Demand Side Management on Malaysia’s Power Generation using System Dynamic Approach
impact of these initiatives in the long-term i.e. 2030. It has been However, with modification in these values will help to achieve
predicted that with the current measures government of Malaysia more positive results.
will be managed to save 20000 GWh of energy in 15 years.
Table 2: TNB’s electricity tariff for domestic households
Tariff category Unit Current rate
Table 1: Summary of key initiatives under NEEAP over (1 January 2018)
10 years Tariff A - Domestic Tariff
Key Initiative Description Program Savings in For the first 200 kWh Cent/kWh 21.8
10 years (1-200 kWh) per month
For the next 100 kWh Cent/kWh 33.4
(GWh)
(201-300 kWh) per month
Rating and Labeling of Refrigeration 2079 For the next 300 kWh Cent/kWh 51.6
labeling of Energy appliances in the (301-600 kWh) per month
form of star rating For the next 300 kWh Cent/kWh 54.6
as per performance (601-900 kWh) per month
Announces special Air- 5983 For the next kWh (901 Cent/kWh 57.1
promotion on conditioning kWh onwards) per month
5-Star rating
The minimum monthly charge is RM3.00
equipment
Introduces rebate Ceiling fans 645 (Tenaga National Berhad, 2018)
on 5-star rating
equipment Table 3: Data and boundaries of model
MEPF (Minimum Endorsement of Compact 3056
energy MEPF standards fluorescent Variables Value Equation
performance lamps Population 32 Million STOCK:
Standard) Efficient 934 Population(t)=population
motors (t - dt)+(increase factor -
Energy audit of Maintain Large 1565 decrease factor) * dt
the commercial energy audits commercial Birth rate 19.1 INFLOW: Increase
sector and on government, services factor=birth
industries. commercial and Large 8384 fraction*population/1000
industrial sectors industrial Death rate 5.1 OUTFLOW: Decrease
services factor=Death
Endorsement Large 927 fraction*population/1000
of adopting government Per Capita 4553 KWh STOCK: Change in
optimization and services consumption electricity demand=(change
low-cost measures intermediate 306 in population*per capita
commercial consumption)*(Energy
services efficiency and Demand side
intermediate 539 management)
industrial Electricity 289281 GWh Forecasted
services Generation Electricity generation
Management of Obligatory Large 1363 Capacity Capacity=Electricity
energy utilization management of commercial Electricity 249870 GWh demand + Reserve Capacity
in buildings and energy system services Available margin*Plant efficiency factor
industries. and audit on Large 15,937 Capacity
government, industrial DSM WRT 0.35% STOCK: DSM
commercial and services EE measure Measures(t)=DSM Measures
industrial sectors Large 1112 (t - dt) + (HER Measures + EE
government Measures) * dt
services INIT DSM Measures=7300
Endorsement intermediate 681
DSM 0.15% INFLOWS:
of adopting commercial
WRT HER
optimization and services EE Measures=Saving EE
measures
low-cost measures intermediate 1201 ratting*change in population
industrial HER Measures=Saving
services through HER policy*change
Reimbursement Reimbursement Chillers, 4950 in population
scheme on on the adoption HVAC, Plant Available capacity/ Plant efficiency
efficient standard of standardized pumps, Efficiency Generation factor=Available Electricity
measures technology and lighting, etc. capacity×100 Generation Capacity/Installed
quality Electricity Generation capacity
Implementation Propose a plan for New 932 Capacity Available Capacity Reserve Capacity
of energy-efficient the implementation Commercial Reserve - Electricity margin=Available electricity
construction of energy-efficient buildings Margin Demand/Available Generation Capacity-Initial
design buildings capacity×100 Electricity Demand
Source: KeTTHA, (2014) Source: (DOSM, 2017; NEB, 2017; Kettha, 2017)
416 International Journal of Energy Economics and Policy | Vol 11 • Issue 4 • 2021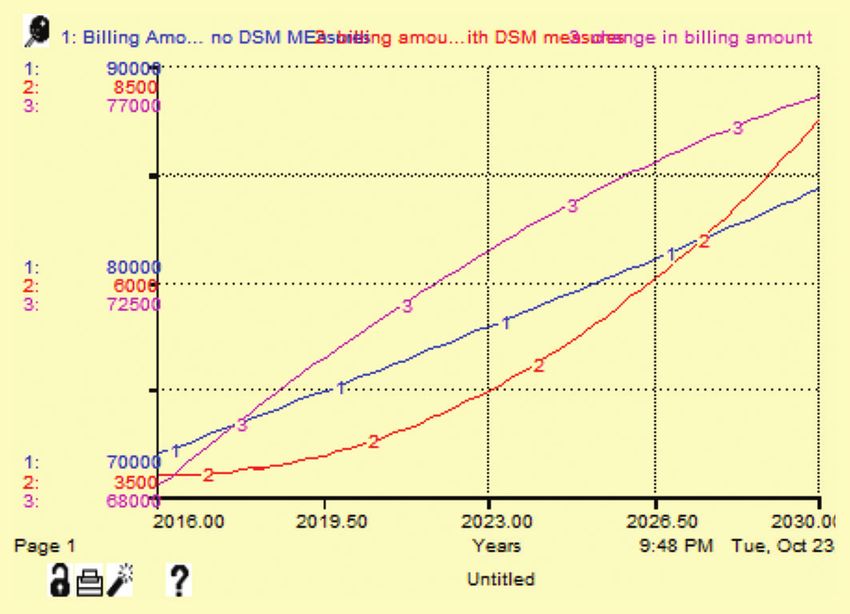
Tufail, et al.: Forecasting Impact of Demand Side Management on Malaysia’s Power Generation using System Dynamic Approach
Figure 5: The expected increase in electricity demand and required Figure 8: Amount of electricity saved with the adoption of DSM
generation capacity By 2030
Figure 9: Impact of DSM on forecasted long term electricity
Figure 6: Change in electricity demand W.R.T. DSM
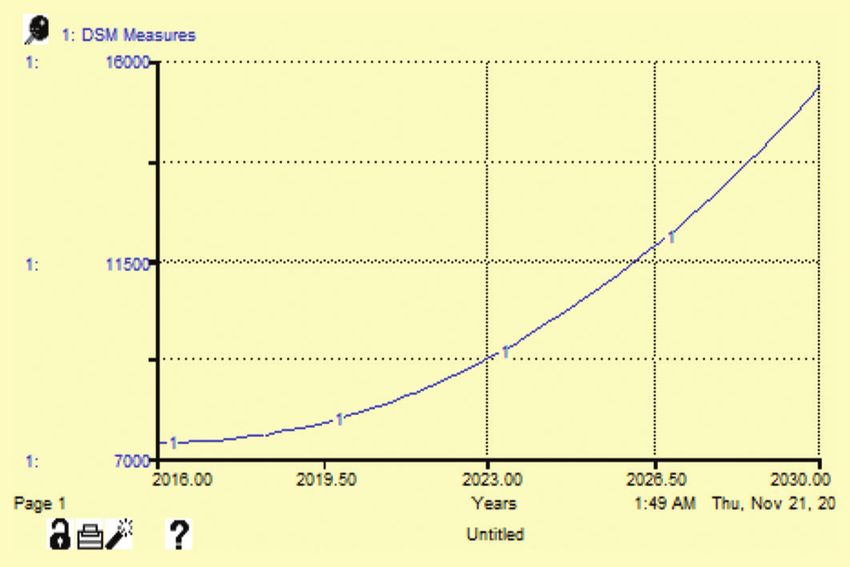
Figure 8 is a graphical illustration of the DSM measure’s impact
Figure 7: Change in billing cost on overall electricity demand. The model suggests that in long
run DSM measures may save around 16000Gwh of electricity.
Figure 9 depicts the reduction in overall capacity requirements
due to DSM measures by the end of 2030.
5. CONCLUSION
This study attempts to analyses the energy-growth nexus in
Malaysia using a system dynamic modeling approach. System
dynamics is a valuable approach used for the estimation of
long- term electricity demand. SD provides in-depth vision to
analyze the various variables’ effects on final energy demand and
consumption. The study set to explore the dynamic relationship
among population, electricity demand and per capita consumption
and also measures the impact of demand-side management on total
electricity expansion capacity. The simulation model estimates that
at the current rate of consumption and population growth there will
Figure 7 illustrates the comparison of electricity billing amount at be a need of 156 terawatt-hours of electric energy in the year 2030.
the rate of 0.51 cent/kWh. It shows the comparison of electricity However, the install capacity should stand 246 terawatt-hours. It
billing with and without adopting DSM measures. The third line is found that by using simulation, a fairly accurate forecast can
on the graph represents the total amount of saving in billing per be obtained. It also discusses that demand-side management can
year; however, the policy boundaries have been set to the current be used as an efficient technique to reduce the total electricity
implemented factors i.e. 5% approximately. demand with significant value.
International Journal of Energy Economics and Policy | Vol 11 • Issue 4 • 2021 417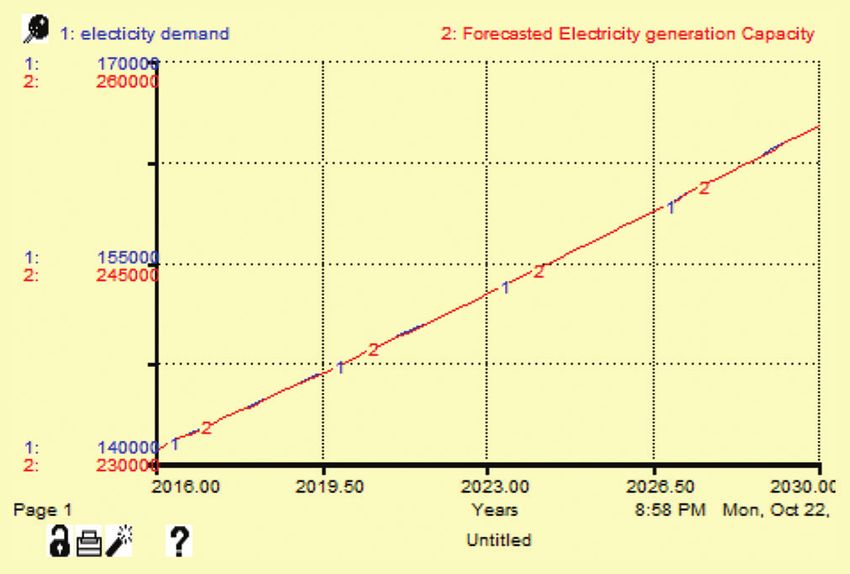
Tufail, et al.: Forecasting Impact of Demand Side Management on Malaysia’s Power Generation using System Dynamic Approach

               6. ACKNOWLEDGEMENT                                                  simulation using system dynamics model for Papua Province,
                                                                                   Indonesia. International Journal of Energy Economics and Policy,
This research was funded by a grant from Universiti Utara                          9(6), 199-209.
                                                                               Mayasari, F., Dalimi, R., Purwanto, W.W. (2019), Projection of biodiesel
Malaysia (Case Study Grant; SO Code: 14900). Our gratitude
                                                                                   production in Indonesia to achieve national mandatory blending in
also goes to Research and Innovation Centre for giving us an
                                                                                   2025 using system dynamics modeling. International Journal of
opportunity to conduct this project.                                               Energy Economics and Policy, 9(6), 421-429.
                                                                               MES. (2017), Energy Statistics Handbook. Malaysia Energy Statistics.
                         REFERENCES                                                Available from: http://meih.st.gov.my.
                                                                               Mirchi, A., Madani, K., Watkins, D., Ahmad, S. (2012), Synthesis of system
Ahmad, N.Z., Majid, M.A., Zaidi, M.A.S. (2001), Agricultural and                   dynamics tools for holistic conceptualization of water resources
     industrial development in Malaysia: Policy bias? Humanomics,                  problems. Water Resources Management, 26(9), 2421-2442.
     17(1-2), 61-76.                                                           Muhammad-Sukki, F., Munir, A.B., Ramirez-Iniguez, R., Abu-
Ahmad, S., Tahar, R.M. (2014), Selection of renewable energy sources               Bakar, S.H., Yasin, S.H.M., McMeekin, S.G., Stewart, B.G. (2012),
     for sustainable development of electricity generation system using            Solar photovoltaic in Malaysia: The way forward. Renewable and
     analytic hierarchy process: A case of Malaysia. Renewable Energy,             Sustainable Energy Reviews, 16(7), 5232-5244.
     63(1), 458-466.                                                           National Energy Balance. (2016), Energy Commission of Malaysia.
Aun, C.S. (2004), Energy Efficiency: Designing Low Energy Buildings                Available from: http://www.meih.st.gov.my. [Last accessed on 2017
     Using Energy 10. Vol. 7. CPD Seminar. p1-18.                                  Dec 26].
Cheng, C.C. (2005), Electricity Demand-side Management for an Energy-          Nelwan, A.F., Dalimi, R., Hudaya, C. (2021), A new formula to quantify
     efficient Future in China: Technology Options and Policy Priorities           the national energy security of the world’s top ten most populous
     (Doctoral Dissertation, Massachusetts Institute of Technology).               nations. International Journal of Energy Economics and Policy,
Dooyum, U.D., Mikhaylov, A., Varyash, I. (2020), Energy security                   11(1), 394.
     concept in Russia and South Korea. International Journal of Energy        Oh, T.H., Lalchand, G., Chua, S.C. (2014), Juggling act of electricity
     Economics and Policy, 10(4), 102-107.                                         demand and supply in Peninsular Malaysia: Energy efficiency,
DOSM. (2017), Department of Statistics Malaysia: Available from: https://          renewable energy or nuclear? Renewable and Sustainable Energy
     www.dosm.gov.my/v1/index.php?r=column/ctwoByCat&parent_                       Reviews, 37(9), 809-821.
     id=115&menu_id=L0pheU43NWJwRWVSZklWdzQ4TlhUUT09.                          Oh, T.H., Pang, S.Y., Chua, S.C. (2010), Energy policy and alternative
     [Last accessed on 2018 Jul 28].                                               energy in Malaysia: Issues and challenges for sustainable growth.
Economic Planning Unit. (2015) Malaysia, the 11th Malaysia Plan 2016-              Renewable and Sustainable Energy Reviews, 14(4), 1241-1252.
     2020, Percetakan Nasional Malaysia Berhad, Kuala Lumpur; 2015.            Ong, H.C., Mahlia, T.M.I., Masjuki, H.H. (2011), A review on energy
     Available from: http://www.epu.gov.my. [Last accessed on 2018 Jul 25].        scenario and sustainable energy in Malaysia. Renewable and
Forrester, J.W. (1969), Urban Dynamics. Cambridge: The MIT Press.                  Sustainable Energy Reviews, 15(1), 639-647.
Forrester, J.W., Forrester, J.W. (1971), World Dynamics. Cambridge,            Rehan, R., Knight, M.A., Haas, C.T., Unger, A.J. (2011), Application
     MA: Wright-Allen Press.                                                       of system dynamics for developing financially self-sustaining
Geng, Z. (2021), Russian energy strategies in the natural gas market for           management policies for water and wastewater systems. Water
     energy security. International Journal of Energy Economics and                Research, 45(16), 4737-4750.
     Policy, 11(2), 62-66.                                                     Saidur, R., Husnawan, M., Masjuki, H.H., Jahirul, M.I., Mahlia, T.M.I.,
Hezri, A.A., Hasan, M.N. (2006), Towards sustainable development? The              Nasruddin, A.R., Zamaluddin, M.F. (2009), Energy and Electricity
     evolution of environmental policy in Malaysia. Natural Resources              Consumption Analysis of Malaysian Industrial Sector. Proceedings
     Forum, 30(1), 37-50.                                                          of 4th International Conference on Thermal Engineering: Theory
Höök, M., Tang, X. (2013), Depletion of fossil fuels and anthropogenic             and Applications.
     climate change a review. Energy Policy, 52, 797-809.                      Sovacool, B.K., Drupady, I.M. (2011), Examining the small renewable
Jafar, A.H., Al-Amin, A.Q., Siwar, C. (2008), Environmental impact of              energy power (SREP) program in Malaysia. Energy Policy, 39(11),
     alternative fuel mix in electricity generation in Malaysia. Renewable         7244-7256.
     Energy, 33(10), 2229-2235.                                                Tahir, M.Z., Nawi, M.N.M., Rajemi, M.F. (2015), Building energy index:
Jamaludin, R., Nawi, M.N.M., Bahaudin, A.Y., Mohtar, S., Tahir, M.Z.               A case study of three government office buildings in Malaysia.
     (2019), Energy efficiency of chancellery building at Universiti Utara         Advanced Science Letters, 21(6), 1798-1801.
     Malaysia. Journal of Advanced Research in Fluid Mechanics and             TNB. (2017) Electricity Tariff. Tenaga Nasional Berhad. Available from:
     Thermal Sciences, 58(2), 144-152.                                             https://www.tnb.com.my/residential/pricing-tariffs. [Last accessed
Jebaraj, S., Iniyan, S. (2006), A review of energy models. Renewable and           on 2018 Oct 22].
     Sustainable Energy Reviews, 10(4), 281-311.                               Tufail, M.M.B., Ibrahim, J.A., Melan, M. (2018a), The financial impact
Kamarudin, Y. (2008), Feasibility Study of Implementing Demand-side                of adopting carbon-tax as policy on electricity generation system: A
     Management (DSM) for Domestic Sector in Batu Pahat. (Doctoral                 case study of Malaysia’s power generation mix. International Journal
     Dissertation, Universiti Tun Hussein Onn Malaysia).                           of Development and Sustainability, 7(4), 1428-1440.
KeTTHA. (2014), National Energy Efficiency Action Plan. Draft Final            Tufail, M.M.B., Ibrahim, J.A., Melan, M. (2018b) Conceptualizing energy
     Report. Available from: http://www.kettha.gov.my/kettha/portal/               security and the role of diversification as the key indicator against
     document/files/NEEAP%20For %20Comments%20Final%20                             energy supply disruption. Journal of Advanced Research in Business
     January%202014.pdf.                                                           and Management Studies, 11(1), 1-9.
KeTTHA. (2017), Green Technology Master Plan Malaysia 2017-2030                Zhao, W., Ren, H., Rotter, V.S. (2011), A system dynamics model for
     (GTMP). Putrajaya, Malaysia: Ministry of Energy, Green Technology             evaluating the alternative of type in construction and demolition
     and Water (KeTTHA).                                                           waste recycling center the case of Chongqing, China. Resources,
Lefaan, Y. (2019), Human development concept and electrical system                 Conservation and Recycling, 55(11), 933-944.

  418                                                    International Journal of Energy Economics and Policy | Vol 11 • Issue 4 • 2021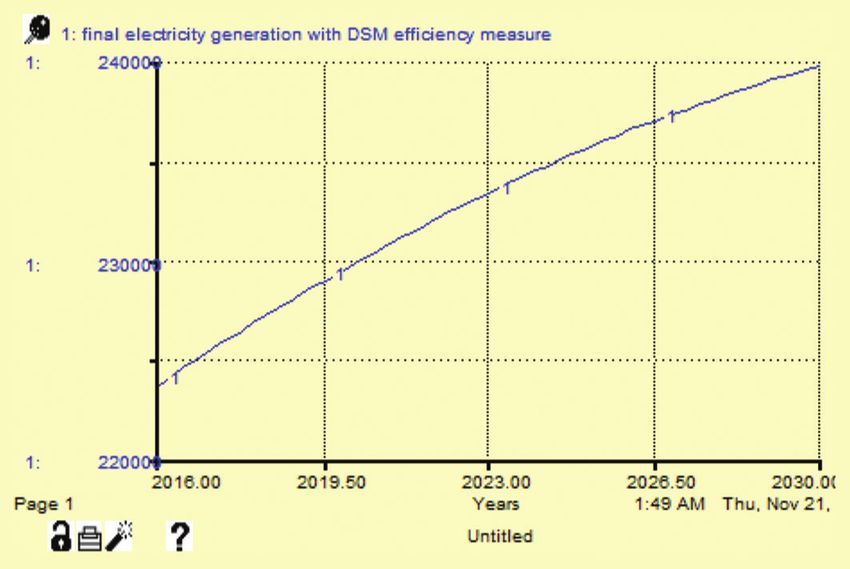
You can also read