Analysis and Modeling of HPP Tala/Bhutan for Network Restoration Studies
←
→
Page content transcription
If your browser does not render page correctly, please read the page content below
Analysis and Modeling of HPP Tala/Bhutan for
                 Network Restoration Studies
                      A. Holst, University of Rostock, Germany, Karchung, CST Phuentsholing, Bhutan,
                        D. Sharma, DGPC Thimphu, Bhutan, R. Chhetri, CST Phuentsholing, Bhutan

                                                                                plants and the power system. The reliability aspects with
    Abstract – This paper describes the modeling and simulation              regard to the operation & control of the generating units and
method and corresponding results of the Hydropower Plant                     associated power system networks immensely depend on the
(HPP) Tala, which is the largest existing plant in Bhutan with 6             competencies to study, understand and analyze the overall
units of 170 MW high pressure Pelton turbines and a complex
control structure. The goal of the associated overall project is to
                                                                             system. Therefore, a research team, consisting of experts from
create a complete dynamic model of the Bhutan power system for               the College of Science and Technology (CST) of the Royal
investigations concerning stability, island operation, network               University of Bhutan, the University of Rostock (UR), DGPC
restoration and system optimization. To test the dynamic                     and BPC was constituted, supported by the German Academic
behavior, measurements of transient processes in different                   Exchange Service (DAAD) within the University-Business-
operation modes of the HPP Tala for one exemplary unit have                  Partnership Programme.
been conducted. Based on the analysis of the measurements and
the plant documentation, a detailed practice-oriented high
quality nonlinear model was developed and validated step by
step, using the Matlab/Simulink software. Relying on the model,
some initial investigations of the dynamic behavior of the plant
with the focus on islanded operation were conducted.

   Index Terms - Hydroelectric power, Islanding, Power control,
Power system dynamics, Power system measurements, Power
system restoration, Power system simulation, Power system
stability, Renewable Energy, Voltage control

                          I. INTRODUCTION

B    hutan, a small Himalayan country, located in south-east
     Asia, is endowed with huge hydropower potential. Of the
total 24 GW technical potential, only about 1.5 GW stands
harnessed till date. However, rapid developments of numerous
new hydropower projects are currently in progress. 10 GW                     Fig. 1. Plant scheme of HPP Tala
additional generations is slated to be added by the year 2020.
   The existing hydropower plants (HPP) are being managed                       Tala Hydropower plant (THP) is Bhutan’s biggest
by Druk Green Power Corporation Limited (DGPC); while the                    generating station located on the Wangchu river basin in
Bhutan Power Corporation Limited (BPC) is the power system                   Western Bhutan with a catchment area of 4028 km². It has an
operator of the Bhutan power network, which works in                         installed capacity of 1020 MW, consisting of 6 units with
interconnection with the Indian grid. So far Bhutan doesn’t                  170 MW each (see Fig. 1). The high pressure plant with a net
participate in frequency or inter-area control of the much                   head of 820 m is equipped with two penstocks having five jets
larger Indian grid. Pushed by the rapid growth of the power                  impinging the bucket of a vertical Pelton turbine. Unit
network and the associated increase in interconnection with                  transformers finally steps up the voltage to 400 kV before the
the Indian grid, Druk Green feels the urgent need to ensure                  majority of power is evacuated to Indian grid through four
that its generating facilities are prepared to operate in the fast           overhead feeder lines. With an average mean annual energy
changing network scenario. Therefore, Druk Green must                        generation of about 4.9 TWh, THP is the main source of
evaluate the static and dynamic performance of its generating                Bhutan’s country economy (almost 13 %). The plant was
units to ensure a safe and stable performance in interconnected              constructed between 1997 and 2007, built by an Indian
as well as islanded operation in case of faults.                             contractor under the finance of Indian Government.
   Basis of the investigations are realistic models of power                    The paper covers the modeling aspects and the
                                                                             methodology relevant to hydropower plant set up considering
                                                                             THP as a case. A detailed non-linear high-quality simulation
    This work is part of the project ‘Analysis and Modelling of Bhutan’s     model was developed and validated through various
Hydropower Plants for Investigations by Dynamic Simulation ‘, supported by   simulation results compared with the real time measurements.
the German Academic Exchange Service (DAAD) with financial resources
from the German ‘Federal Ministry for Economic Cooperation and
Development’ (BMZ).
                                                 978-1-4673-7172-8/15/$31.00 ©2015 IEEE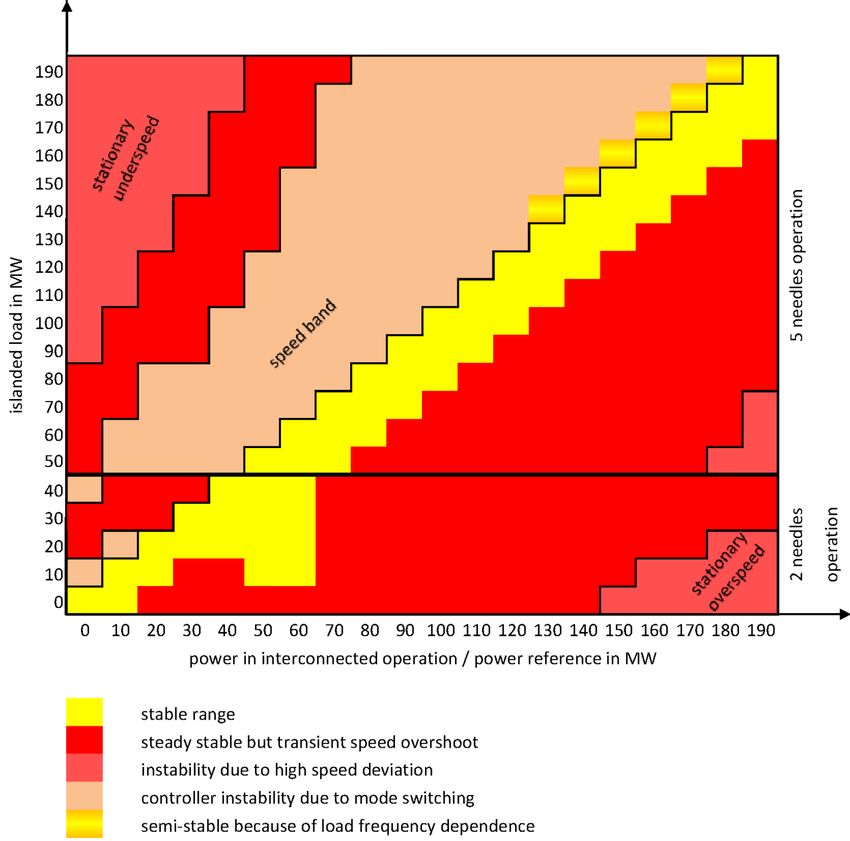
2

          II. MEASUREMENTS AND DATA HANDLING                                             III. MODEL OF HPP TALA
   The basis for a successful modeling of a plant are well             Studying the plant structure gives an idea of the signal flow
prepared measurements and reliable recordings. As many             in the plant. Every power plant is unique, but the main parts
signals as possible should be measured, particularly at the        are essentially the same.
interconnections of the subparts (refer Fig. 2). To be able to         Fig. 2 shows the structural overview, which is typical for
identify the dynamic behavior, beside of all usual electrical      hydroelectric plants with Pelton runners. Special for HPP Tala
and mechanical values and positions the set-points for             is the number of 5 nozzles and the very long head race tunnel
voltage/reactive power, active power, speed and limiter            (water channel).
settings should be known.                                              The idea of this kind of high quality modeling is to identify
   As island operation physically tests are hardly to conduct,     the subparts, subsequently, step by step, supported through the
usually the plant must be subjected to several suitable dynamic    comparison of interface signals and simulation results. The
movements to get an idea of the maximal traversing speed of        quality of modeling can be improved by increasing the number
the governor elements. Furthermore, the identification of          of measured signals.
various non-linear characteristics requires measuring of a lot
of operational points that should be tracked during the
measurements. For this reason, tests in different operational
scenarios can be logged as follows:

• Change of opening positions in dry operation
  (measurement signal calibration),
• Change of set-points in interconnected mode (power,
  voltage, speed, limiters, reactive power) to evaluate
  performance of all existing controller paths,
• Special sequences (startup, run out, synchronization, load
  shedding),
• Excitation of oscillation modes (sinusoidal frequency
  input),
• Transition from interconnection to islanded operation with
  different load steps (if possible) or
• Tests in virtual islanded mode (test equipment temporarily
  in preparation).                                                 Fig. 2. Structural overview of HPP Tala with representation of sub-models

                                                                   A. Sequences and procedures
   For HPP Tala, tests in the aforementioned first 3
operational scenarios were possible. The measurements were            The basic modeling work has been done in
taken from 25th till 26th of March 2014, at Unit 2 by engineers    Matlab/Simulink. This software package is simple to handle
from CST und UR, under assistance of DGPC’s engineers and          and flexible in programming.
                                                                      The first steps are to justify the stationary behavior and to
staff. During the tests, Unit 1 was running with constant power
and all the other units were under temporary shut-down.            define the practical nonlinear characteristics. It is an iterative
   The test sequences were recorded by measurement                 process, as not all stationary parameters are known from the
equipment from UR, consisting of a Laptop with DAQ card            beginning. For the work, the per-unit-system is constantly
(12 bit resolution) and signal conditioning hardware (isolation    used; it simplifies the handling and signal linking enormously.
amplifier, current shunts), controlled by LabVIEWTM                   The modeling work was executed in the following order:
programmable software. 28 channels were measured
simultaneously with a sampling rate of 50 ms, which is             • Creating the turbine power characteristic (Fig. 4),
sufficient to record the fastest signal changes of the voltage     • Calculation of stationary turbine flow and friction factors
controller with a good resolution.                                   (iterative process 4 because reliable flow measurement
   Additionally, a large compilation of power plant                  were not available),
documentation was provided by DGPC, where of particular            • Approximation of the turbine cross-section vs. nozzles
importance were the plant’s digital controller design and the        opening function, conjugation function,
controller parameter settings.                                     • Identification of water hydraulic part,
   To be able to use the measured sequences for simulations,       • Identification of oil-hydraulic part of governor and digital
the signals had to be rescaled from voltages into their actual       nozzles controller,
values, partly corrected and transferred into per unit             • Analysis and modeling of digital power controller,
dimensions. For this, a consistent set of nominal values is        • Unification of ‘Power Generation System’ (PGS) and
necessary, which has to be defined firstly, derived from the         adjustment in closed-loop-simulation,
documentation. A table of stationary states was extracted as a     • Identification of voltage controller.
basis for investigations of internal stationary characteristics.
3

   Because the THP model is going to be implemented in the
network simulation software DIgSILENT PowerFactory as a                             The deflector of HPP Tala is of the diverting type in
subpart of the complete Bhutan system, the generator model                       contrast to the divider type (cut-in-deflector). The effect of
was not added and unified to the ‘Voltage Regulation system’.                    this type of deflector is highly nonlinear. It is represented by
For the PGS, a simplified mechanical model was used (see                         an interference factor which expresses the loss of torque
section III.E).                                                                  dependent from the penetration depth of the jet radius. The
   Whenever automatic parameter identification for one or                        factor inside of the ‘deflector effect block’ was identified from
more parameter simultaneously was necessary, the Matlab                          measurements of load shedding tests.
application of the Nelder Mead Simplex Algorithm with the
mean square method as quality criterion was used.                                                                      TABLE I
                                                                                                       IDENTIFIED PARAMETERS OF HYDRAULIC PART
B. Hydraulic part and turbine model                                              Parameter            TW_wc          Tsc         TW_ps1/2   TL_ps1/2     kf_wc           kf_ps
   The model of the water hydraulic system represents the                        Identified                                      1.13 s /   0.3 s /
                                                                                                      11.0 s     1040 s                                 3.8 %            4.5 %
fluid mechanical system comparable to an equivalent Pi-model                       Value                                          1.07 s     0.3 s
of a power line. The traveling waves are slurred this way to
their fundamental wave. Scientific investigations verify that                       The turbine model is derived from the manufacturer’s hill
this level of detail measures up the requirements of power                       chart for the model (prototype) turbine, where power and
system simulations [1]. Fig. 3 shows an overview of the main                     efficiency are visualized as a function of flow and net head.
parts of the hydraulic system for simulations focused on THP                     The grid points were taken from the hill chart, inter- and extra-
unit 2, reduced to a nonlinear water channel – surge chamber –                   polated and transformed into a 3-dimensional lookup table.
single penstock simplification with water elasticity. The time                   Fig. 4 shows the graph of the 3-dimensional function.
constants were calculated considering the physical
                                                                                                                turbine power characteristic
construction dimensions and later on refined by identification
(Table I).
   The discharge qT for each unit is assigned by the Torricelli
                                                                                                250
equation:
                                                                                                200

                    ·                [p.u.],                           (1)
                                                                                   power [MW]

                                                                                                150

                                                                                                100
where aT is the opening cross section of the nozzle assembly
                                                                                                 50
which in transient processes can be modified to a deflector
                                                                                                                                                       surface
effected aD. hN represents the net head, while the gross head                                    0
                                                                                                                                                       net points
hB in stationary state is reduced by the pipe friction pursuant                                 -50                                                    from hill chart
                                                                                                900
to:                                                                                                                                                                       30
                                                                                                      850
                                                                                                                                                          20
                        ∆                      ·   · | |         [p.u.].                                       800
                                                                                                                                             10
   (2)                                                                             pressure head [m]
                                                                                                                           750    0
                                                                                                                                                  discharge [m³/s]
                                                                                 Fig. 4. Turbine power characteristic (subpart of Fig. 5)

                                                                                    As the mechanical torque output of the turbine is also
                                                                                 dependent on the turbine speed, the speed dependency under
                                                                                 compliance with the run-away speed and the standstill torque
                                                                                 as well as the mechanical losses were added to the model as
                                                                                 shown in Fig. 5 [2]. Recapitulating the power output of the
                                                                                 turbine model is now 4-dimensional with pT = ƒ(qT, hN, nT).
                                                                                 The starting time constant of the rotational unit, consisting of
                                                                                 the Pelton runner, the shaft and the generator rotor amounts to
                                                                                 about 10 s.

Fig. 3. Simplified sub-model of water hydraulic part of HPP Tala, particularly
for unit 2                                                                       Fig. 5. Sub-model of turbine and generator mechanical model
4
C. Governing system values, which are not generally known and can only be found
The governing system consists of a digital controller unit by tests. The practical minimum opening/closing time of
with control paths for power/speed control (explained in deflector for their full range of movement were measured
section III.D) and nozzle control as well as the oil-hydraulic equal to 10.4 s / 1.6 s, whereas for the nozzles 2, 4 and 5 as 34
system (two most upper blocks in Fig. 2). The electro- to 39 s / 18.6 to 20.3 s and for the nozzles 1 and 3 as 37 to 39 s
hydraulic transducer (EHT), acting as the interface between / 14.5 to 14.9 s.
both systems, transforms the electrical control signal into a
TABLE II
mechanical movement. The movement is amplified via a pilot IDENTIFIED PARAMETERS OF OIL-HYDRAULIC SYSTEM
servomotor to be able to control the main valves of TDP / yPD max / yPT max yPT min
servomotors for deflector and the five nozzles (Fig. 6). The Parameter TDM TTM 1...5
TTP yPD min (1...5) (1...5)
pilot and main servomotor of a single nozzle is shown in Fig. Identified 3.4 s to 0.11 / 0.1 to -0.18 to
1.0 s 1.55 s
6 below. Physically, there are 5 nozzles following the position Value 6.3 s -0.32 0.17 -0.43
feedback of the deflector.
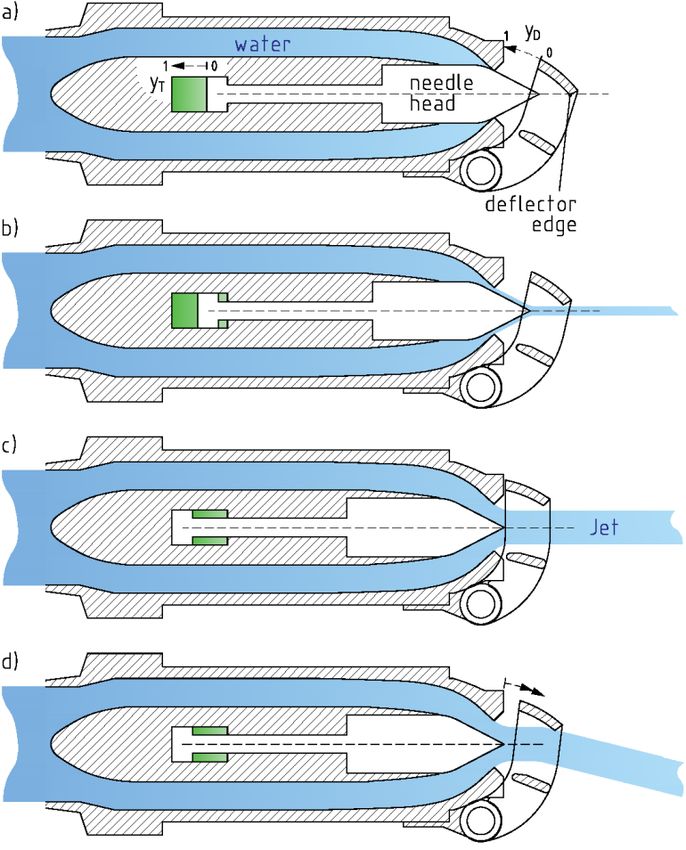
According to the position of the nozzle yT, the water jet From the introduced values, it can be seen that the nozzles
gets a cylindrical form with variable cross section aT (Fig. 7, a- 1 and 3 show a bit different behavior with slightly faster
c). The stationary characteristics between yT and aT was closing speed. The reason are different operational modes for
already integrated into the water hydraulic subpart (Fig. 3). different power stages. At a power output lower than 40 MW
only the nozzles 1 and 3 are active, thus they are known as
lead jets. The nozzles 2, 4 and 5 are disabled by the stop signal
shown in Fig. 6 at the digital nozzle controller part. For
generator active power values higher than 40 MW, the plant
changes to the 5-nozzle operation mode. The changing process
between the operation modes is accompanied by transition
processes and a non-stable power output.
Fig. 6. Sub-model of oil-hydraulic part of governor as well as digital nozzle
controller, exemplary for one nozzle
The power/speed controller forces the deflector to move
very fast to a certain position. The nozzles follow slowly
accordingly to their new stationary position, determined by a
‘deflector-nozzle conjugation table’, which fixes the relation
between deflector and nozzle position. The conjugation table
causes the deflector edge standing constantly at a small
distance above the jet radius under stationary conditions. As
the speed of the deflector is much faster than the speed of the
Fig. 7. Working principle of nozzles and deflector; a) closed position,
nozzles, the deflector affects the water jet during fast closing b) slightly opened position, c) fully opened position, d) interference of the
processes (load rejection) to prevent the turbine from over- deflector during a closing transition process
speeding under islanded conditions (Fig. 7, d).
D. Power/Speed controller
Besides the controller function, the traversing velocity of
deflector and nozzles are determinant for the performance of The digital power/speed controllers of HPP Tala consist of
the plant in transient processes. The maximal moving velocity different control paths, which are active under different
of the main servomotors are dependent on their respective operational condition.
time constants and the adjustment of the maximal opening On one hand, there is the combined speed and power
positons of the main valves. Table II shows the identified controller (NPC) with power statics. It is a P-type controller,5
equipped with permanent and transient droop and acceleration boundary of the speed band, managed by the ‘speed track’
of the Δn signal. On the other hand, there is a pure power block. When the speed gets back inside of the speed band
controller (PC) with I-characteristic, which is always active in (under the hysteresis limit), the controller switches back to the
interconnected operation when the speed is inside of the PC path. This switching logic can cause instabilities under
defined speed band from 47.5 to 52 Hz (hysteresis of 1 %) certain conditions (compare chapter V).
(see Fig. 8). There are further limiter and run-up functions
E. Voltage controller / Generator
which are not shown in the simplified picture, but included in
the model. The digital voltage controller corresponds to the IEEE
The NPC contrastingly is active before synchronization, standard controller ST1A connected to a potential-source
when the generator circuit breaker (GCB) is switched off or controlled rectifier exciter system [3]. It is a simple P-type
when the generator speed gets outside of the defined speed controller consisting of an amplification gain with transient
band in grid interconnected condition. gain reduction, reactive current compensation and influence of
The usually used control equation for stationary state of a a dual input Power System Stabilizer (type IEEE PSS2A,
combined speed/power controller is: frequency input disabled) for damping of power swings. As
only the power generation path of the plant was modeled in
0 . (3) Matlab/Simulink, the voltage controller is not a part of the
Simulink model yet. It will be added during migration of the
Due to the very slow change of active power, connected model into DIgSILENT PowerFactory Software. A separately
with the slow nozzle speed, the much faster feedback of the done revision showed that the voltage model is able to fit the
deflector yD is used for stability reasons as follows: measurements of the controller output signal.
Due to the above mentioned reasons, the generator model
( ) 0 . (4) was reduced to its mechanical equivalent connected to the
strong Indian grid. The easiest analogue of this system is a
Because pG and yD does not have a proportional relation,
two-mass-model, representing the Tala rotating unit as a small
the factor ntrim had to be introduced to get the nominal speed in and the Indian system as an almost infinite big mass. The
synchronization mode. The deflector opening position in no-
elastic coupling between the masses generates the electrical
load operation is about 0.3 p.u., the permanent droop σp is
synchronous torque according to the rotor load angle relation:
adjusted at 10 %, the speed reference is 1 p.u.. Therefore, a
correction factor ntrim of about 3 % is necessary to reach the ·
[p.u.]. (5)
synchronization speed. ·
After grid interconnection, σp is switched to 6 % and the
While the synchronous torque is proportional to sin and
speed reference is adapted by the ‘speed track’ block
dependent on the excitation, there is also a reluctance torque in
according to the actual speed.
salient pole generators, which is independent of excitation and
proportional to sin 2 . In the two-mass-model the torque can
then be further expressed as:
2 [p.u.]. (6)
Another possibility is to model the generator according to
[4] as nonlinear model of fifth order. In this case, also the
network has to be calculated in RMS values, to provide the
complex generator voltage. As this method is much more
wasteful, the easier way was chosen for this investigation.
Anyway, to a later stage of this project, the model will be
implemented inclusive of voltage controller to the DIgSILENT
PowerFactory Software, where the complex generator voltage
is already built in. The influence of the generator-voltage
controller system for stability investigations will be considered
then. For this first stability checks those effects are secondary.
IV. MODEL VALIDATION / SIMULATIONS
Fig. 8. Sub-model of the digital power/speed controller, simplified without The sub-models according to Fig. 2 were built and
opening limiter, start up functions and disabled controller paths separately tested. The last step was the unification of the sub-
models to a complete model, which enables the simulation of
In case of islanding the generator with closed GCB, the PC the processes in closed loop.
path is not able to stabilize the frequency. The speed will Measurement delays had to be implemented owing to real
reach the band limit and the controller switches over to the time scenarios, where the signals and feedbacks have to be
NPC path. The speed reference will now be kept at the6
a) test 2: active power [MW] a) test 25: position deflector / nozzle 1
200
measurement defl. measurement
setpoint
0.6
yT1 measurement
150 simulation defl. simulation
position in p.u.
pG in MW
0.4 yT1 simulation
100
change to 5-nozzle 0.2
operation
50
change to 2-nozzle 0
operation
0
0 500 1000 1500 2000 0 50 100 150 200
time in s time in s
b) test 2: deflector position b) test 25: nozzles / turbine flow
1 0.2
measurement turbine flow simulation
simulation nozzles flow simulation
0.15
position in p.u.
0.8
flow in p.u.
0.1
0.05
0.6
0
0.4 -0.05
0 500 1000 1500 2000 30 40 50 60 70
time in s time in s
c) test 2: position nozzle 1, 2 c) test 25: deflector control signal yDctr
0.8 0.1
yT1 measurement
yT2 measurement
0.6 0
yT1 simulation
position in p.u.
signal in p.u.
yT2 simulation
0.4 -0.1
-0.2
0.2
-0.3 measurement
0 simulation
-0.4
0 500 1000 1500 2000 0 50 100 150 200
time in s time in s
d) test 2: deflector control signal yDctr d) test 25: turbine speed
0.06 1.04
measurement measurement
simulation
turbine speed in p.u.
0.04 simulation
1.02
signal in p.u.
0.02
1
0
0.98
-0.02
-0.04 0.96
0 500 1000 1500 2000 0 50 100 150 200
time in s time in s
Fig. 9. Comparison of measurement and simulation for test 2: change of Fig. 10. Comparison of measurement and simulation for test 25: load
power set-points within the whole power range shedding of 30 MW in 2-neddle operation
inevitably transformed into the controllers’ signal format, Of course for all of these simulations the model works with
where small delays are unavoidable. the same structure and set of parameters. The state of the plant
For the proof of accuracy of the model, one comparison of is detected by the control structure and the model acts like the
measurement and simulation in interconnected operation mode real plant under the boundary conditions of test ambience.
(test 2) and one load shedding process (test 25) are shown as Fig. 9 shows the results of a change of power set-points
valid examples. (Fig. 9 and 10) within the whole operational range. Even the transitions from
5-nozzles-operation to 2-nozzles-operation and back are7
included. In test 25 (Fig. 10) a load of about 30 MW was shed test 25: turbine speed
by opening the generator main circuit-breaker (GCB). Also the 1.1
measurement
simulated flow of water through the nozzle assembly and the 1.05 simulation
turbine speed in p.u.
diverting effect of the deflector are shown in Fig. 10 b. For
both simulations, it can clearly be seen, that the model is able 1
to fit the real behavior with a high accuracy. Slow as well as
0.95
fast changes and different controller paths can be modeled
with a comparable high quality. 0.9
Fig. 11 and 12 illustrate the validity of the model for further
test measurements. In Fig. 11 a sequence of 3 tests in a time 0.85
100 200 300 400 500
range of more than one hour is presented. This wide range is time in s
needed to get a proof of the surge shaft oscillations with a very
Fig. 12. Speed simulation of a load shedding test of full load (170 MW)
high period length, which occur after a fast shut down in test
no. 8. In the zoomed-in picture below, the fast slightly damped
V. INVESTIGATION OF ISLANDING PERFORMANCE
penstock traveling waves can be recognized. The different
oscillations of very different time ranges are reproduced very Based on the introduced model, some initial simulations of
close to the measurement signal. From this comparison, it can islanding performance of the existing constellation can be
be derived that the fundamental wave model of water conducted. It is assumed, that one unit is running in separate
hydraulics is sufficient for these purposes. operation and suddenly an arbitrary islanded load, after a
network disconnection, has to be taken over. A usual load
surge chamber oscillations after shut down
frequency dependency factor of 2 p.u. is considered.
90 Fig. 13 shows some examples of stable and unstable
simulation transition. For the transient process the limit of electrical over
Pressure head [kp/cm²]
measurement 8
speed detection at 55 Hz (1.1 p.u.) as well as the plant
88 measurement 9
measurement 10 disconnection limit of 47 Hz (0.94 p.u.) has to be taken into
account (marked with red lines in Fig. 13). The speed band
86 limit exit in power control mode is marked with solid green
lines; the smaller speed band entry because of the hysteresis is
84 marked with dashed green lines.
0 1000 2000 3000 4000 turbine speed
Time [s] 1.15
transient limit overshoot unstable transition
90 stable transition
1.1
Pressure head [kp/cm²]
speed in p.u.
88 1.05
controller instabitity
1
86
0.95
84 0.9
0 50 100 150 200 250 300
250 260 270 280 290 300 time in s
Time [s] Fig. 13. Speed simulation of transitions from interconnected to islanded
Fig. 11. Proof of validity in the water hydraulic part: oscillations in different operation, initial load 70 MW, islanded load 40, 50 (stable) and 80 MW
time ranges, surge shaft oscillations and penstock traveling waves
For cases when equation (4) gives a speed settlement
The speed simulation in Fig. 12 according to test 23 shows between 1.04 ≤ n ≤ 1.1, a stable transition can be achieved,
a good fit of ramp rates for speeding up and slowing down of when the transient overshoot doesn’t cross the limiting lines.
the rotating unit after a load shedding of full load (170 MW). In the example shown in picture 13 this is the case only for the
Responsible are the inertia of the rotating system with an transition from 70 MW to 50 MW. For the transition from
identified time constant of 10 s and the no load losses (meanly 70 MW to 80 MW, controller instability can be expected,
mechanical losses) of about 2.3 MW at nominal speed. During where the controller continuously switches between NPC and
this test, the unit tripped because of an unknown reason. PC mode and foments sustained oscillations.
Anyway, the reaction of the system under cooperation of the Fig. 14 shows a generalization of the transition
deflector can accurately be simulated. combinations in a grid of 10 MW steps with the above
mentioned boundary conditions. There is a wide band of
steady stable working points, but due to the transient
overshoot only a small band of dynamically stable transitions
exist. A maximal load step of only 30 MW can be balanced.8
Also the change of operation mode, particularly from 2-nozzle further goals on a dynamic model basis.
to 5-nozzle operation is problematic because of associated
speed turbulences. VII. REFERENCES
Dissertations:
[1] H. Weber, "Dynamische Netzreduktion zur Modalanalyse von Frequenz-
und Leistungspendelungen in ausgedehnten elektrischen
Energieübertragungsnetzen," PhD. dissertation, Univ. Stuttgart,
Germany, 1990
Books:
[2] J. Giesecke, E. Mosonyi “Wasserkraftanlagen”, 5th edition, Springer-
Verlag Berlin Heidelberg, 2009, p.527
Standards:
[3] IEEE Recommended Practice for Excitation System Models for Power
system Stability Studies, IEEE Standard 421.5-1992, March 1992
Papers from Conference Proceedings (Published):
[4] A. Holst and M. Golubović, "Dynamic Model of Hydro Power Plant
"Djerdap I" in Serbia", IYCE 2007 Conference Budapest, Hungaria,
2007, pp. 101-102
VIII. BIOGRAPHIES
Karchung was born in Tashiyangtse, Bhutan, on
March 5, 1990. He is studying the final year BE in
Electrical Engineering at College of Science and
Technology (CST), under Royal University of
Bhutan, Bhutan. His special field of interest
includes Renewable energy and Hydropower.
Fig. 14. Generalization of stability aspects for transition combinations from Karchung was a scholarship supported member
interconnected to islanded operation in a grid of 10 MW steps of THP of the Bhutan’s students exchange group at the
University of Rostock, Germany, for Modeling and
Simulation of Bhutan’s Hydropower plant, Tala.
A broad spectrum of investigation in this field as well as
investigations of measures to improve the island mode Axel Holst was born in Rostock, Germany, in May
performance are in the focus of the future activities in this 1970. After his professional training as electrician
project. he studied at the University of Rostock.
He has professional experience in planning and
design of electrical networks and in the field of
VI. CONCLUSION wind turbines. Since 2001 he works as a scientific
assistant and PhD student at the Institute for
This paper presents the state of a still ongoing work Electrical Power Engineering at the University of
concerning investigations of the dynamic behavior of Bhutan’s Rostock. His special field of interest are
power system. The goal is to develop a dynamic model of the calculations and simulations in electrical power
systems as well as power quality. He is the coordinator of the DAAD funded
entire Bhutan power system with power plants, networks and project “Analysis and Modelling of Bhutan’s Hydropower Plants”.
consumers for large dynamic investigations.
The first Hydropower plant HPP Tala was measured and a Deepen Sharma was born in Gomtu, Samtse,
practical oriented simulation model was developed. The Bhutan on 21st of January 1981 and finished his
B.Tech and M.Tech studies in Allahabad and New
validity of the model was demonstrated for different operation Delhi, India.
scenarios. The results show a high quality modeling work, He is currently working as electrical engineer at
which will be the basis of extensive investigations with the Druk Green Power Corporation Ltd. (DGPC),
attached to Tala Hydropower Plant, Bhutan. As the
focus on isolated operation of the Bhutan’s power network. manager of the Control & System Analyses group of
First investigations with the Tala model show, that the the Centre of Excellence for Control & Protection
performance of the plant is still not optimized for operation (CoECaP), he is the responsible person at DGPC for
under islanded conditions. The adaption of parameter settings the above mentioned DAAD funded project.
or even the overall control structure can further improve the
Roshan Chhetri was born in Bhutan on 6th October
performance of THP. 1966. He completed his BTech from NIT (REC)
The migration of the model into the network simulation Warangal, India and MScE in Electrical Engineering
software DIgSILENT PowerFactory enables extensive from University of New Brunswick, Canada. He is a
senior lecturer at College of Science and Technolgy
investigations, concerning the behavior of the complete (CST), Royal University of Bhutan and responsible
system in island mode operation and the transition process, person at CST for the above mentioned DAAD
which is hardly possible to test in practice. The development funded project.
of an islanding concept and a network restoration plan as well
as the optimization of control structures can be considered asYou can also read