Effective Removal of Maxilon Red GRL from Aqueous Solutions by Walnut Shell: Nonlinear Kinetic and Equilibrium Models
←
→
Page content transcription
If your browser does not render page correctly, please read the page content below
Effective Removal of Maxilon Red GRL from
Aqueous Solutions by Walnut Shell: Nonlinear
Kinetic and Equilibrium Models
Fatih Deniz
Nigar Erturk Trade Vocational High School, 27590 Gaziantep, Turkey; f_deniz@windowslive.com (for correspondence)
Published online 14 June 2013 in Wiley Online Library (wileyonlinelibrary.com). DOI 10.1002/ep.11797

   The feasibility of walnut shell as a waste biomaterial for         biotechnology due to its low-initial cost, simplicity of design,
removing Maxilon Red GRL (MR GRL) dye from aqueous sol-               ease of operation, insensitivity to toxic substances, proper
utions was investigated in this work. The biosorption was             removal of pollutants even from dilute solutions, and avail-
studied as a function of pH, ionic strength, biosorbent dos-          ability of biomass [5,6].
age, particle size, temperature, initial dye concentration,               Recently, a considerable number of low-cost biosorbents
and contact time. Nonlinear kinetic equations including the           based on natural materials or agro-industrial wastes have
pseudo-first order, pseudo-second order, and Logistic were            been investigated for the removal of wide range of dyes
applied to the experimental data for describing the biosorp-          from aqueous solutions [4,7]. But the search for excellent
tion kinetics. The Logistic model showed the best correlation         and efficient biosorbent is still continuing. A few studies
with the experimental data. Besides, intraparticle diffusion          have been reported on the utilization of walnut shell (modi-
was not the sole rate-controlling factor. The Langmuir,               fied or activated carbon forms) in removing heavy metal ions
Freundlich, Hill, and Dubinin-Radushkevich nonlinear iso-             such as Cr(VI), Pb(II), and Hg(II) [8–10]. However, to the
therms were fitted to the equilibrium data, and the Hill              best of my knowledge, no work in the literature has been
model presented the best fit. Thus, this research highlights the      focused until now on the biosorption potential of raw walnut
potential of walnut shell as an effective biosorbent for the          shell as a waste biomaterial for certain dye.
removal of MR GRL from aqueous media. V         C 2013 American
                                                                          Walnut is a rounded, single-seeded stone fruit of walnut
Institute of Chemical Engineers Environ Prog, 33: 396–401, 2014       tree (Juglans regia L.). In the world, according to FAOSTAT
  Keywords: biomaterials, dye biosorption, Maxilon Red                of 2010, 846,059 hectares of walnut trees were grown com-
GRL, nonlinear models, walnut shell                                   mercially with an estimated annual production of 2,545,388
                                                                      metric tons of walnut fruits [11]. The major producers of wal-
                                                                      nut are China, United States, Iran, and Turkey. Walnut shell
INTRODUCTION
                                                                      makes up a large percentage of walnut fruit (50%) and is
    Industrial activities produce large volumes of wastewater         available in abundant supply as an agricultural by-product of
effluents including hazardous materials like synthetic dyes           walnut processing industry. Walnut shell is a hard, chemi-
[1]. Various industries (textile, plastic, paper, cosmetics, food,    cally inert, nontoxic, and biodegradable material. This shell
etc.) use dyes to color their products. These compounds               is also advantageous due to its availability as a renewable
affect aesthetic merit, reduce light penetration, and thus pre-       resource [12].
clude photosynthesis process. Besides, most of synthetic                  The focus of the present study is to assess the potentiality
dyes are toxic, carcinogenic, and mutagenic for human and             of walnut shell for the removal of Maxilon Red GRL (MR
other organisms [2]. Hence, several governments have estab-           GRL) from aqueous solutions. MR GRL was used as a model
lished environmental restrictions with regard to the quality of       compound of azo dyes, which represent more than a half of
colored wastewater and obligated the industries to remove             the global dye production [13]. These dyes have been identi-
dye residues from effluents before discharging [3].                   fied as one of the most problematic dyes in the industrial
    Several technologies such as coagulation, ion exchange,
                                                                      effluents. Thus, removal of such colored agents from the
membrane filtration, reverse osmosis, and chemical oxidation
                                                                      effluents is a significant environmental importance. The bio-
have been tested for the removal of dyes from the industrial
                                                                      sorption studies were carried out under various parameters
wastewater to decrease their objectionable impacts on the
                                                                      including pH, ionic strength, biosorbent dosage, particle size,
environment. These techniques require high capital and
                                                                      temperature, initial dye concentration, and contact time. In
operating costs and may result in large volumes of solid
                                                                      this work, in order to characterize the biosorption process,
wastes. Furthermore, they have also other restrictions like
                                                                      the detailed kinetic and equilibrium studies for MR GRL bio-
formation of by-products, release of aromatic amines, and
                                                                      sorption by walnut shell were performed. The biosorption
short half-life [4]. Conversely, in recent times, biosorption has
                                                                      kinetic data were tested by the pseudo-first order, pseudo-
emerged as an alternative ecofriendly method for dye
                                                                      second order, and Logistic nonlinear kinetic models. Besides,
removal from industrial effluents. Biosorption is a promising
                                                                      intraparticle diffusion was also applied to the experimental
                                                                      data for describing the biosorption mechanism. The equilib-
      C 2013 American Institute of Chemical Engineers
      V                                                               rium data were analyzed using the Langmuir, Freundlich,

396     July 2014                                       Environmental Progress & Sustainable Energy (Vol.33, No.2) DOI 10.1002/ep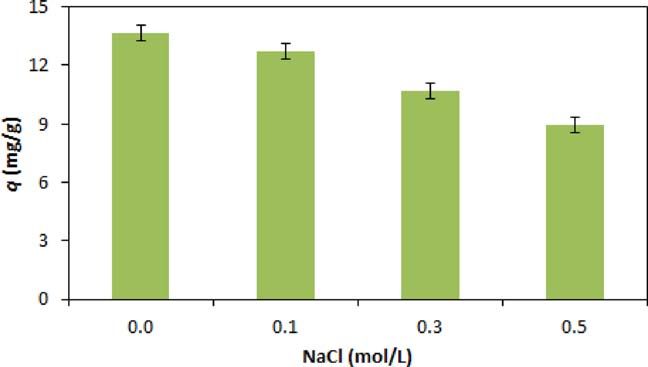
Hill, and Dubinin-Radushkevich (D-R) nonlinear isotherm            model to the experimental data using the software Minitab
models. Such a study could be useful to compare and select         (ver. 16.2.1, Minitab, PA). For MSE method, the smaller val-
a biosorbent for a particular application.                         ues point out the best curve fitting. S factor is measured in
                                                                   the units of the response variable and represents the stand-
MATERIALS AND METHODS                                              ard distance data values fall from the regression line. For a
                                                                   given study, the better the equation predicts the response,
Biosorbent Material                                                the lower the S factor is. Also, R2 (adj) is a modified R2 that
    Walnut shell used in this work was obtained from a local       has been adjusted for the number of terms in the model.
source in vicinity of Gaziantep, Turkey. This material was         Unlike R2, R2 (adj) may get smaller when you add terms to
first washed with distilled water to remove soluble impur-         the model.
ities. It was then dried in an oven for 24 h at 80 C. The dried
biomass was powdered and sieved to obtain different parti-         RESULTS AND DISCUSSION
cle size ranges (63–125, 125–250, and 250–500 mm). Finally,
it was stored in an airtight plastic container to use as bio-      Evaluation of Parameters Affecting Biosorption
sorbent without any pretreatments.                                     Solution pH is an important factor on the dye biosorption
                                                                   capacity of certain biosorbent [14]. Thus, the effect of pH for
MR GRL Dye Solution                                                the biosorption of MR GRL onto walnut shell over a pH
    MR GRL (Mf: C18H24N6O4S, Mw: 322 g mol21, type: cati-          range of 2–8 was studied as shown in Figure 1. The uptake
onic, kmax: 530 nm, purity: 99%) was supplied by a local tex-      of MR GRL increased from 7.30 to 12.26 mg g21 when the
tile plant. It was of commercial quality and used without          solution pH was increased from 2 to 8 (Co: 40 mg L21, m: 1 g
further purification. A stock solution of 500 mg L21 was pre-      L21, dp: 63–125 mm, t: 30 min, T: 25 C). It can be attributed
pared by dissolving accurately weighed quantity of the dye         to the increase in negative charge on the surface of biosorb-
in distilled water. Experimental solutions of desired concen-      ent with increasing pH and the reduction of H1 ions com-
tration were obtained by further dilution from the stock solu-     peting with the dye cations for the same biosorption sites [2].
tion. About 0.1 M NaOH and HCl solutions were used for                 Large amounts of salts are consumed in the dyeing proc-
initial pH adjustment.                                             esses. Therefore, salt concentration in dye wastewater is one
                                                                   of the important parameters that control both electrostatic
                                                                   and nonelectrostatic interactions between the surface of bio-
Biosorption Experiments
                                                                   sorbent and dye molecules and thus affects biosorption
   Batch biosorption tests were performed under several            capacity [15]. Figure 2 presents the influence of the ionic
parameters including pH (2–8), ionic strength (0–0.5 NaCl          strength on the MR GRL biosorption by walnut shell (pH: 8,
mol L21), biosorbent dose (m, 1–5 g L21), particle size (dp,       Co: 40 mg L21, m: 1 g L21, dp: 63–125 mm, t: 30 min, T:
63–500 mm), temperature (T, 25–45 C), initial dye concentra-      25 C). The increasing ionic strength of the solution exhibited
tion (Co, 40–80 mg L21), and contact time (t, 0–150 min)           a negative effect on the biosorption process. This decrease
under the aspects of kinetic and isotherm studies. The tests       can be due to the competition between Na1 and the dye cat-
were carried out in 100-mL Erlenmeyer flasks with 50 mL of         ions for the active sites on biosorbent [16].
the total working volume of desired initial dye concentration,         Biosorbent dosage is a significant factor because of defin-
pH, biosorbent dose, etc. The solutions were agitated at a         ing capacity of biosorbent for a fixed dye concentration [1].
constant speed in a temperature-controlled water bath at dif-      The biosorption yield (%) for MR GRL onto walnut shell
ferent temperatures for the required time period. The flasks       increased from 58.02 to 72.95% when the biosorbent concen-
were withdrawn from the bath at prefixed time intervals, and       tration was increased from 1 to 5 g L21 (pH: 8, Co: 80 mg
the residual MR GRL concentration in the solution was ana-         L21, dp: 63–125 mm, t: 50 min, T: 45 C). The increase in bio-
lyzed by centrifuging the mixture and then measuring the           sorption with biosorbent dose can be attributed to an
absorbance of supernatant using a UV–vis spectrophotometer         increased biosorbent surface and the availability of more bio-
at the maximum wavelength of 530 nm. The concentration             sorption sites [17].
of MR GRL was calculated by comparing absorbance to the                Particle size is other important parameter in the biosorp-
dye calibration curve previously obtained.                         tion process [18]. For this study, the amount of MR GRL bio-
   The amount of dye sorbed onto biosorbent, q (mg g21),           sorption enhanced from 7.49 to 13.90 mg g21 for a decrease
and the percentage dye removal efficiency (R, %) were              in biosorbent particle size ranges from 250–500 to 63–125 mm
defined by Eqs. (1) and (2), respectively.                         (pH: 8, Co: 40 mg L21, m: 1 g L21, t: 30 min, T: 25 C). The
   ðCo 2Ct ÞV
q5                                                           (1)
       M
       Co 2Ct
Rð%Þ5         3100                                           (2)
         Co

where Co is the initial dye concentration (mg L21), Ct is the
residual dye concentration at any time (mg L21), V is the vol-
ume of solution (L), and M is the mass of biosorbent (g). q
and Ct are equal to qe and Ce at equilibrium, respectively.

Statistical Tests
    All studies were duplicated, and only the mean values
were reported. The kinetic and isotherm model data were
defined by nonlinear regressions using the software Origin-
Pro (ver. 8.0, OriginLab Co., MA). Beside the coefficient of       Figure 1. Effect of solution pH on biosorption. [Color figure
determination (R2), S factor, the adjusted determination coef-     can be viewed in the online issue, which is available at
ficient [R2 (adj)] and mean square error (MSE) statistical anal-   wileyonlinelibrary.com.]
ysis techniques were used to evaluate the best-fit of the

Environmental Progress & Sustainable Energy (Vol.33, No.2) DOI 10.1002/ep                                         July 2014 397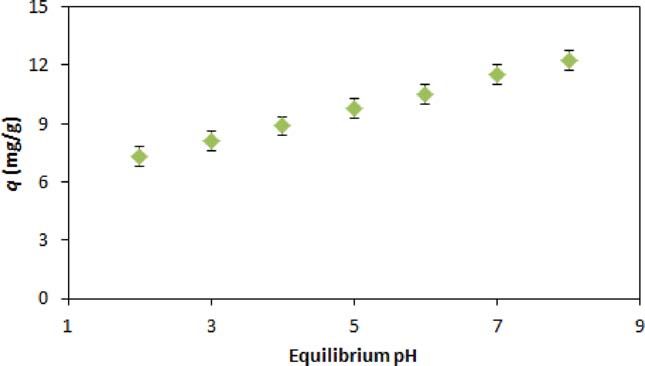
higher biosorption potential with smaller biosorbent particles Kinetic Modeling of Biosorption Process
can be attributed to the fact that smaller particles provide a Kinetics studies provide valuable insights into the reaction
larger surface area and better accessibility of dye into active pathway and mechanism of biosorption system. Thence, the
pores [1,19]. experimental data were analyzed by the pseudo-first order,
Temperature has an apparent effect on the removal of pseudo-second order, and sigmoid Logistic nonlinear kinetic
dye from aqueous solutions [20]. The effect of temperature models, and these models are presented in Table 1.
on the biosorption of MR GRL by the biosorbent was studied Table 2 shows the parameters obtained from the fits of
in the range of 25–45 C. The dye removal increased from the biosorption kinetic models. The statistical data indicate
13.20 to 19.60 mg g21 with the rise in temperature from 25 to that the nonlinear pseudo-first-order model was not appro-
45 C, suggesting that the process was endothermic in nature priate for describing the biosorption kinetics. Contrary to this
(pH: 8, Co: 40 mg L21, m: 1 g L21, dp: 63–125 mm, t: 30 min). kinetic model, the biosorption process was well described by
Better biosorption at higher temperature may be due to
enhanced mobility of the dye molecules from the solution to
the biosorbent surface [21]. Table 1. Kinetic model equations employed.
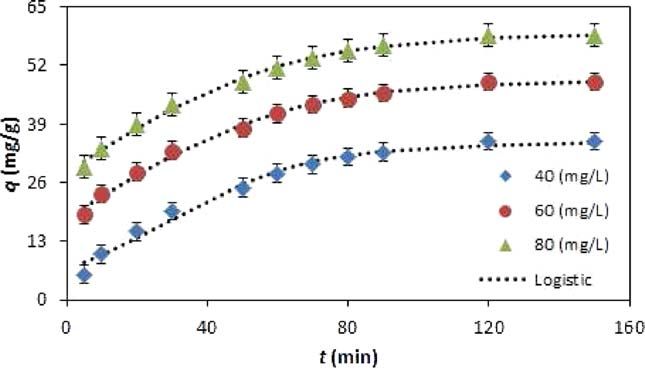
Initial dye concentration plays an important role in the
biosorption capacity of dye for biosorbent [22]. The effect of Model Nonlinear equation Reference
initial MR GRL concentration on the dye removal process is
presented in Figure 3 as a function of contact time (pH: 8, Pseudo-first order qt 5qe ð12e2k1 t Þ [24]
m: 1 g L21, dp: 63–125 mm, T: 45 C). The biosorption amount
h5k1 qe
at equilibrium increased from 35.14 to 58.68 mg g21 with the
increase in the initial dye concentration from 40 to 80 mg k2 qe2 t
L21. The result may be due to the increase in the driving qt 5
Pseudo-second order 11k2 qe t [24]
force of the concentration gradient with the higher initial dye
concentration [23]. Additionally, it was observed that the h5k2 qe2
qe
uptake of dye was rapid for the first 30 min, and thereafter Logistic qt 5 11e2kðt2tcÞ
[25]
proceeded at a slower rate up to 90 min, and finally, attained 1=2
Intraparticle diffusion qt 5kp t 1C [24]
saturation in about 120 min as shown in Figure 3. Such a
short equilibrium time indicates the feasibility of biosorbent
for the dye removal from aqueous solutions. k1 and k2, rate constants for first-order and pseudo-second
order models; h, initial biosorption rate; k, relative biosorp-
tion rate; tc, t point defining center of qe value; kp, intrapar-
ticle diffusion rate constant; C, a constant related to thickness
of boundary layer.
Table 2. Parameters obtained from fits of biosorption kinetic
models.
Nonlinear Co (mg L21)
model Parameter 40 60 80
21
Pseudo-first qe (exp) (mg g ) 35.14 48.37 58.68
order k1 (min21) 0.0269 0.0569 0.0924
Figure 2. Influence of ionic strength on dye removal. [Color qe (mg g21) 37.74 45.01 53.72
figure can be viewed in the online issue, which is available h (mg g21 min21) 1.015 2.561 4.964
at wileyonlinelibrary.com.] S factor 1.8177 3.8324 4.4463
R2 96.50 90.40 88.90
R2 (adj) 96.40 89.40 86.60
MSE 4.670 7.690 9.662
Pseudo-second k2 (g mg21 min21) 0.0006 0.0015 0.0022
order qe (mg g21) 36.45 51.46 60.34
h (mg g21 min21) 0.797 3.972 8.010
S factor 1.5511 2.2021 1.5632
R2 (%) 98.50 96.50 98.40
R2 (adj) (%) 98.50 96.00 98.30
MSE 2.560 3.570 2.650
Logistic K (min21) 0.048 0.038 0.034
qe (mg g21) 34.78 48.50 59.18
S factor 0.7506 0.8581 0.6994
R2 (%) 99.50 99.40 99.60
R2 (adj) (%) 99.50 99.30 99.50
MSE 0.560 0.740 0.490
Intraparticle kp (mg g21 min21/2) 3.1532 3.1481 3.1389
Figure 3. Effect of initial MR GRL concentration on biosorp- diffusion C (mg g21) 1.44 14.68 25.15
tion process with Logistic model lines. [Color figure can be S factor 2.3189 2.3296 2.3302
viewed in the online issue, which is available at R2 (%) 95.10 95.10 95.10
wileyonlinelibrary.com.] R2 (adj) (%) 94.50 94.60 94.50
MSE 5.377 5.427 5.430
398 July 2014 Environmental Progress & Sustainable Energy (Vol.33, No.2) DOI 10.1002/epthe nonlinear pseudo-second-order model with better statisti- different dye concentrations, all the model parameters with
cal results for all MR GRL concentrations. This suggests that the statistical data are listed in Table 4.
the rate of dye biosorption process was probably controlled The Freundlich model can be applied to multilayer sorp-
by the surface sorption [26]. tion with nonuniform distribution of sorption heat and affin-
The Logistic model is one of the most common sigmoid ity over the heterogeneous surface [6]. The statistical analysis
curves that find an application in wide range of fields includ- values show that the nonlinear Freundlich model did not
ing biology, sociology, economics, chemistry, and psychol- properly characterize the biosorption equilibrium. Besides,
ogy. This model is mainly used for modeling of microbial for this study, the values of nf between 1 and 10 represent a
growth and product formation [27,28]. In the research, the suitable biosorption [19].
nonlinear Logistic model is newly used for explaining the The Langmuir model proposes that the biosorption pro-
whole biosorption process of MR GRL onto walnut shell. As cess takes place at the specific homogeneous sites within the
shown in Table 2, the Logistic model presented the best-fit biosorbent surface and that once the dye molecule occupies
to experimental data. Figure 3 also depicts that this model a site, no further biosorption can take place at that site,
lines were quite close to the experimental data obtained which concludes that the biosorption process is monolayer
over the biosorption period. Moreover, for all initial dye con- in nature [30]. As depicted in Table 4, this model fitted better
centrations, the biosorption capacity values of biosorbent, qe to the biosorption data than the Freundlich model in all
(mg g21), obtained from the model agreed very well with cases. This indicates the monolayer coverage of dye mole-
those of experimental. In this way, these results reveal that cules on the biosorbent surface. The RL values between 0
the Logistic model could be applied effectively for describing and 1 also reflect a favorable biosorption [6,14].
the whole dye removal process. The Hill equilibrium model is used for describing the
Because the above models could not identify the diffusion binding of different species onto homogeneous substrates
mechanism, the experimental data were also tested by the [31]. In the work, the nonlinear Hill model is first applied to
intraparticle diffusion model [29]. With reference to this explain the MR GRL biosorption by walnut shell. Table 4
model, if a linear line passing through the origin exists denotes that this equation was the most appropriate isotherm
between qt and t1/2, the intraparticle diffusion is the sole model to define the equilibrium behavior. Additionally, bio-
rate-limiting step. But, if multilinear plots are exhibited, two sorption capacity values predicted from this model agreed
or more steps control the biosorption process. The plots for very well with the experimental values for all MR GRL con-
MR GRL removal of walnut shell at three different concentra- centrations. Thus, the results present that the Hill model
tions had three distinct regions. The initial region of the could be properly used to express the biosorption equilib-
curve relates the biosorption on the external surface. The rium manner of MR GRL for walnut shell.
second stage corresponds to the gradual uptake presenting The aforesaid isotherm models could not explain clearly
the intraparticle diffusion as rate-controlling step. The final the physical or chemical behavior of the biosorption process,
plateau region indicates the surface sorption and the equilib- and the equilibrium data were further analyzed using the
rium stage [19,26]. Thus, the intraparticle diffusion was not nonlinear D-R model. The magnitude of mean-free energy
the only rate-limiting step, and also the other mechanism(s) value (E, kJ mol21) obtained from D-R model is useful to
may control the rate of biosorption process or all of which predict the type of biosorption process. The E values
may be operating simultaneously. between 8 and 16 kJ mol21 indicate chemical sorption while
the values lower than 8 kJ mol21 imply physical sorption
Equilibrium Modeling of Biosorption
Biosorption isotherm studies procure some basic informa- Table 4. Isotherm model parameters.
tion on a given system. Equilibrium isotherms are used to
compare different biosorbents and define the affinities,
Nonlinear Co (mg L21)
capacities, and surface properties of biosorbents. Thus,
Freundlich, Langmuir, Hill, and D-R nonlinear equilibrium model Parameter 40 60 80
models were used to describe the equilibrium data. The Freundlich qe (exp) (mg g ) 21
35.14 48.37 58.68
equations of isotherm models used are given in Table 3. For Kf (mg g21) (L g21)1/n 6.96 6.65 7.04
nf 2.04 1.81 1.78
Table 3. Equations of isotherm models used. S factor 3.6973 4.2158 4.2949
R2 (%) 97.40 96.20 95.40
Model Nonlinear equation Reference R2 (adj) (%) 95.70 94.90 94.60
1=n MSE 5.670 6.773 7.446
Freundlich qe 5Kf Ce f [6] Langmuir b (L mg21) 0.079 0.034 0.025
Langmuir qL bCe [6] qL (mg g21) 36.41 50.82 62.96
qe 5
11bCe RL 0.24 0.33 0.34
1 S factor 1.6154 1.7181 1.9126
RL 5 R2 (%) 98.80 98.75 98.67
11bCo
nH R2 (adj) (%) 98.50 97.90 97.00
Hill qe 5 KqH1C
Ce
nH [6] MSE 3.388 3.824 5.308
H e
qe 5qDR e2Be
2
Hill qH (mg g21) 35.24 47.98 58.21
Dubinin-Radushkevich [6] S factor 1.3758 1.5305 1.2838
E51=ð2BÞ1=2 R2 (%) 99.40 99.00 99.60
R2 (adj) (%) 99.20 98.70 99.40
Kf and nf, constants related to capacity and intensity of bio- MSE 1.890 2.340 1.650
sorption; b, a constant related to energy of biosorption; qL, Dubinin– qDR (mg g21) 35.34 54.63 66.92
qH, and qDR, maximum biosorption capacity; RL, separation Radushkevich E (kJ mol21) 0.32 0.15 0.11
factor; KH and nH, constant and exponent of Hill model; B, a S factor 1.6128 3.3998 3.8926
constant related to biosorption energy; e, Polanyi potential; R2 (%) 98.80 96.60 94.80
E, mean-free energy. R2 (adj) (%) 98.60 95.90 93.90
MSE 2.600 5.759 8.367
Environmental Progress & Sustainable Energy (Vol.33, No.2) DOI 10.1002/ep July 2014 399[19]. For the present research, the E values were found to be of Acid Black 1 dye biosorption by different brown mac-
lower than 8 kJ mol21, presenting that the biosorption of MR roalgae, Chemical Engineering Journal, 179, 158–168.
GRL onto walnut shell might be a physical-sorption process. 14. Sahmoune, M. N., & Ouazene, N. (2012). Mass-transfer
processes in the adsorption of cationic dye by sawdust,
CONCLUSION Environmental Progress and Sustainable Energy, 31,
This study reports on the possibility of using walnut shell 597–603.
as a biosorbent for the removal of MR GRL from aqueous 15. Do gan, M., Abak, H., & Alkan, M. (2009). Adsorption of
media. The nonlinear Logistic model was the best model to methylene blue onto hazelnut shell: Kinetics, mechanism
represent the dye-biosorption kinetics. Additionally, the intra- and activation parameters, Journal of Hazardous Materi-
particle diffusion was not the sole rate-limiting step influenc- als, 164, 172–181.
ing the biosorption process. The biosorption of MR GRL dye 16. Aksu, Z., & Balibek, E. (2010). Effect of salinity on metal-
showed an excellent conformity with the nonlinear Hill iso- complex dye biosorption by Rhizopus arrhizus, Journal
therm model. According to this model, the maximum dye- of Environmental Management, 91, 1546–1555.
biosorption capacities (qH) for walnut shell were found as 17. Mahmoodi, N. M., Hayati, B., & Arami, M. (2012). Kinetic,
35.24, 47.98, and 58.21 mg g21 at the initial dye concentra- equilibrium and thermodynamic studies of ternary system
tions of 40, 60, and 80 mg L21, respectively. The nonlinear dye removal using a biopolymer, Industrial Crops and
D-R model showed that this biosorption process might be a Products, 35, 295–301.
physical sorption [mean-free energy (E): 0.11–0.32 kJ mol21]. 18. Li, P., Su, Y.-J., Wang, Y., Liu, B., & Sun, L.-M. (2010).
Consequently, the present work suggests that walnut shell Bioadsorption of methyl violet from aqueous solution
can provide an efficient and cost-effective technology for onto Pu-erh tea powder, Journal of Hazardous Materials,
eliminating MR GRL from aqueous solutions. 179, 43–48.
19. Chowdhury, S., & Saha, P. (2010). Sea shell powder as a
new adsorbent to remove Basic Green 4 (Malachite
LITERATURE CITED Green) from aqueous solutions: Equilibrium, kinetic and
1. Chowdhury, S., & Das, P. (2012). Utilization of a domestic thermodynamic studies, Chemical Engineering Journal,
waste-eggshells for removal of hazardous Malachite 164, 168–177.
Green from aqueous solutions, Environmental Progress 20. Shah, B. A., Patel, H. D., & Shah, A. V. (2011). Equilib-
and Sustainable Energy, 31, 415–425. rium and kinetic studies of the adsorption of basic dye
2. Khambhaty, Y., Mody, K., & Basha, S. (2012). Efficient from aqueous solutions by zeolite synthesized from
removal of Brilliant Blue G (BBG) from aqueous solu- bagasse fly ash, Environmental Progress and Sustainable
tions by marine Aspergillus wentii: Kinetics, equilibrium Energy, 30, 549–557.
and process design, Ecological Engineering, 41, 74–83. 21. Safa, Y., Bhatti, H. N., Bhatti, I. A., & Asgher, M. (2011).
3. Mahmoodi, N. M., Hayati, B., Bahrami, H., & Arami, M. Removal of direct Red-31 and direct Orange-26 by low
(2011). Dye adsorption and desorption properties of cost rice husk: Influence of immobilisation and pretreat-
Menthe pulegium in single and binary systems, Journal of ments, The Canadian Journal of Chemical Engineering,
Applied Polymer Science, 122, 1489–1499. 89, 1554–1565.
4. Salleh, M. A. M., Mahmoud, D. K., Karim, W. A., and 22. Mahmoodi, N. M., Arami, M., Bahrami, H., &
Idris, A. (2011). Cationic and anionic dye adsorption by Khorramfar, S. (2010). Novel biosorbent (Canola hull):
agricultural solid wastes: A comprehensive review. Surface characterization and dye removal ability at differ-
Desalination, 280, 1–13. ent cationic dye concentrations, Desalination, 264,
5. Gadd, G. M. (2009). Biosorption: Critical review of scien- 134–142.
tific rationale, environmental importance and significance 23. Kumar, P. S., Ramalingam, S., Senthamarai, C., Niranjanaa,
for pollution treatment, Journal of Chemical Technology M., Vijayalakshmi, P., & Sivanesan, S. (2010). Adsorption
and Biotechnology, 84, 13–28. of dye from aqueous solution by cashew nut shell: Stud-
6. Foo, K. Y., & Hameed, B. H. (2010). Insights into the ies on equilibrium isotherm, kinetics and thermodynam-
modeling of adsorption isotherm systems, Chemical Engi- ics of interactions, Desalination, 261, 52–60.
neering Journal, 156, 2–10. 24. Cazetta, A. L., Vargas, A. M. M., Nogami, E. M., Kunita,
7. Sharma, P., Kaur, H., Sharma, M., & Sahore, V. (2011). A M. H., Guilherme, M. R., Martins, A. C., Silva, T. L.,
review on applicability of naturally available adsorbents Moraes, J. C. G., & Almeida, V. C. (2011). NaOH-activated
for the removal of hazardous dyes from aqueous waste, carbon of high surface area produced from coconut
Environmental Monitoring and Assessment, 183, 151–195. shell: Kinetics and equilibrium studies from the methyl-
8. Altun, T., & Pehlivan, E. (2012). Removal of Cr(VI) from ene blue adsorption, Chemical Engineering Journal, 174,
aqueous solutions by modified walnut shells, Food 117–125.
Chemistry, 132, 693–700. 25. Hu, L., Tian, K., Wang, X., & Zhang, J. (2012). The “S”
9. Saadat, S., & Jashni, A. K. (2011). Optimization of Pb(II) curve relationship between export diversity and eco-
adsorption onto modified walnut shells using factorial nomic size of countries, Physica A, 391, 731–739.
design and simplex methodologies, Chemical Engineer- 26. Saha, P. D., Chakraborty, S., & Chowdhury, S. (2012).
ing Journal, 173, 743–749. Batch and continuous (fixed-bed column) biosorption of
10. Zabihi, M., Asl, A. H., & Ahmadpour, A. (2010). Studies crystal violet by Artocarpus heterophyllus (jackfruit) leaf
on adsorption of mercury from aqueous solution on acti- powder, Colloid Surface B, 92, 262–270.
vated carbons prepared from walnut shell, Journal of 27. Don, M. M., & Shoparwe, N. F. (2010). Kinetics of hyal-
Hazardous Materials, 174, 251–256. uronic acid production by Streptococcus zooepidemicus
11. FAOSTAT. http://faostat.fao.org, accessed in August considering the effect of glucose, Biochemical Engineer-
2012. ing Journal, 49, 95–103.
12. Srinivasan, A., & Viraraghavan, T. (2008). Removal of oil 28. Eroglu, E., Gunduz, U., Yucel, M., & Eroglu, I. (2010).
by walnut shell media, Bioresource Technology, 99, Photosynthetic bacterial growth and productivity under
8217–8220. continuous illumination or diurnal cycles with olive mill
13. Kousha, M., Daneshvar, E., Dopeikar, H., Taghavi, D., & wastewater as feedstock, International Journal of Hydro-
Bhatnagar, A. (2012). Box-Behnken design optimization gen Energy, 35, 5293–5300.
400 July 2014 Environmental Progress & Sustainable Energy (Vol.33, No.2) DOI 10.1002/ep29. Reddy, S., Sivaramakrishna, L., & Reddy, A. V. (2012). material lotus leaf, Chemical Engineering Journal, 171,
The use of an agricultural waste material, Jujuba seeds 1–8.
for the removal of anionic dye (Congo red) from aque- 31. Ringot, D., Lerzy, B., Chaplain, K., Bonhoure, J. P.,
ous medium, Journal of Hazardous Materials, 203, Auclair, E., & Larondelle, Y. (2007). In vitro biosorption
118–127. of ochratoxin A on the yeast industry by-products: Com-
30. Han, X., Wang, W., & Ma, X. (2011). Adsorption parison of isotherm models, Bioresource Technology, 98,
characteristics of methylene blue onto low cost biomass 1812–1821.
Environmental Progress & Sustainable Energy (Vol.33, No.2) DOI 10.1002/ep July 2014 401You can also read


