Analysis and Evaluation to a State's Fragility

Page created by Theodore Deleon
 
CONTINUE READING
Analysis and Evaluation to a State's Fragility
International Journal of Modern Nonlinear Theory and Application, 2018, 7, 16-33
                                                                                                   http://www.scirp.org/journal/ijmnta
                                                                                                               ISSN Online: 2167-9487
                                                                                                                 ISSN Print: 2167-9479

Analysis and Evaluation to a State’s Fragility

Zirui Su, Yuting Nie, Fei Xie

Tianjin University, Tianjin, China

How to cite this paper: Su, Z.R., Nie, Y.T.       Abstract
and Xie, F. (2018) Analysis and Evaluation
to a State’s Fragility. International Journal     Climate change is a global focus over the decades. It triggers many environ-
of Modern Nonlinear Theory and Applica-           ment issues frequently, even serious natural disasters. The potential effects of
tion, 7, 16-33.                                   the climate change are worse than itself. Many of these effects will gradually
https://doi.org/10.4236/ijmnta.2018.71002
                                                  weaken the structure of society and government. As a result, the broken gov-
Received: February 28, 2018                       ernments will turn into fragile states which refer to those states that are not
Accepted: March 23, 2018                          able or choose not to provide the basic essentials to its people. We develop the
Published: March 26, 2018
                                                  fuzzy mathematics evaluation model to analyze the problem and evaluate
Copyright © 2018 by authors and
                                                  the degree of a country’s fragility, and we definite the fragility evaluation le-
Scientific Research Publishing Inc.               vels through the results in the model. In addition, we also apply our model to
This work is licensed under the Creative          Yemen and compare the different situations whether considering climate
Commons Attribution International
                                                  change or not. Then we put our eyes on South Africa, a getting-warmer coun-
License (CC BY 4.0).
http://creativecommons.org/licenses/by/4.0/
                                                  try in Africa. We construct the second model—Time series forecasting
                Open Access                       model, to grasp the changing fragility trend in South Africa and make predic-
                                                  tion to see time and ways the fragility degree will change. Furthermore, we
                                                  modify the forecasting model and use a brand new third model which is called
                                                  grey model, to figure out the importance of Somalia governmental aid along
                                                  with intervention by predicting that the arrival of drought in Somalia will be
                                                  slowed down through positive response from the government.

                                                  Keywords
                                                  Fragility, Fuzzy Mathematics, Time Series Forecasting, Grey Forecast

                                                1. Introduction
                                                1.1. Background
                                                The effects of climate change such as increased droughts, shrinking glaciers,
                                                changing animal and plant ranges and sea level rise will alter the way humans
                                                live today and may weaken or even break the structures of social and govern-
                                                ment, resulting in fragile states at last.
                                                  A fragile state which means the state government could not provide the basic

DOI: 10.4236/ijmnta.2018.71002          Mar. 26, 2018                  16                Int. J. Modern Nonlinear Theory and Application
Analysis and Evaluation to a State's Fragility
Z. R. Su et al.

                                 essentials to its people. Some countries have become more fragile like Syria and
                                 Yemen due to the drought. Environmental stress alone may not trigger violent
                                 conflict, but it may enable violent conflict when it combines with weak frag-
                                 mentation of government and society.

                                 1.2. Our Work
                                 • Construct a model to determine a country’s fragility and measure the influ-
                                    ence of climate change.
                                 • Select a state from the top 10 most fragile states as determined by the Fragile
                                    State Index, then discuss how climate change increases fragility of that coun-
                                    try. Use the constructed model to illustrate in what way(s) the state may be
                                    less fragile without these effects.
                                 • Choose another state which is not included in the top 10 list to measure its
                                    fragility. Next observe the time and ways climate change push it into more
                                    fragile and define the tipping point for a country.
                                 • Use the model to show which state driven interventions could reduce the risk
                                    of climate change and prevent a country from becoming a fragile state, and
                                    then give some suggestions or solutions.
                                 • Determine whether the constructed model could work on other types of
                                    “states” such as cities or continents and modify the model.

                                 1.3. Literature Review
                                 After reading some documents about fragility in a country or a state, we have
                                 found that the most of them had sorted fragile countries and scored them from
                                 many aspects, according to the research paper by Mina Baliamoune-Lutz and
                                 Mark McGillivray in 2008, if the country policy and institutional assessment
                                 (CPIA) score falls below a particular threshold, the state will be classified as fra-
                                 gile, followed by illustrating how the situation is severe and appealing to us to
                                 prevent it. Besides, there have been some management to control the damage
                                 caused by climate change. We can see the optimistic solutions to manage the
                                 disaster and climate change damage in Geoff O’Brien, Phil O’Keefe, Joanne Rose
                                 and Ben Wisner’s thesis—Climate change and disaster management. Howev-
                                 er, there are still some fields which are not covered clearly including prediction
                                 of a normal country to be a fragile country due to climate change, the costs of a
                                 certain state to restore the circumstance back to the former.
                                   Our work aims to these unsolved problems and attempts to find some solu-
                                 tions to make them clear and feasible by using the mathematics and computer
                                 science models.

                                 2. Assumptions and Notations
                                 2.1. Assumptions
                                 In order to quantify the issue responsibly and build mathematics models more
                                 scientifically, we think of that some assumptions must be taken into considera-

DOI: 10.4236/ijmnta.2018.71002                         17                 Int. J. Modern Nonlinear Theory and Application
Analysis and Evaluation to a State's Fragility
Z. R. Su et al.

                                 tion:
                                 • A certain country or a state could be simplified into specific elements and
                                    they will not affect mutually, so that fragility could be qualitative and quan-
                                    titative.
                                 • The elements are constant and will not change as time goes, to eliminate un-
                                    necessary effects.
                                 • The contribution of each element to the fragility is equal without climate
                                    change.
                                 • Every element weight will change only due to climate change because our re-
                                    search is aim to the relationship between climate change and fragility.

                                 2.2. Notations
                                 For clarifying the issue by using some effective solutions and visualize the prob-
                                 lem through some formulas and models, we make the following notations to
                                 symbolize variables (See Table 1).

                                 Table 1. Symbols & meanings extracted from the “fragility” problem.

                                                   Symbol                                      Meaning

                                                      ui                                   Evaluation index

                                                      hi                                    Evaluation level

                                                      R                                      Fuzzy matrix

                                                      A                                     Weight vector

                                                     F                                  Ultimate weight vector

                                                      D                                   Judgement matrix

                                                     mi                                 Factor in normalized F

                                                     Cp                                     Cohesion point

                                                     Ep                                     Economy point

                                                     Pp                                      Politics point

                                                     Sp                                       Social point

                                                     UE                                  Ultimate Evaluation

                                                      g1                                    Tipping point 1

                                                     g2                                     Tipping point 2

                                                     
                                                     yt +1                             The average of yt ~ yt −3

                                                      yt                                The time series variable

                                                      S                            The prediction standard deviation

                                                     a%                              The contribution rate of GDP

                                                     W                             The Somalia’s cost of intervention

DOI: 10.4236/ijmnta.2018.71002                             18            Int. J. Modern Nonlinear Theory and Application
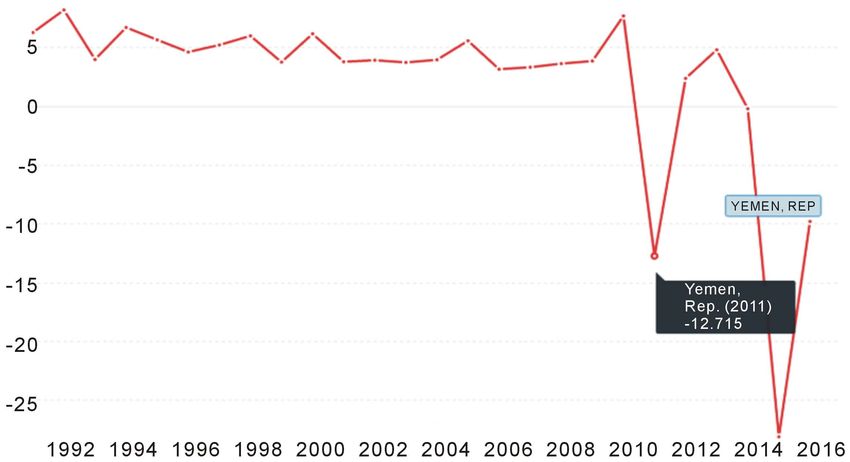
Analysis and Evaluation to a State's Fragility
Z. R. Su et al.

                                 3. Determine the Conception of Fragility
                                 3.1. Existing Conception
                                 The EU Council pointed out that vulnerability refers to structural weakness or
                                 failure, that is to say, the state is unable or unwilling to fulfill its basic functions,
                                 including the application of the rule of law, the protection of human rights and
                                 fundamental freedom and the protection of the general public [1].

                                 3.2. Qualitative
                                 According to the chapter 1.2, we consider that it is necessary to clarify the defi-
                                 nition of fragility first. In view of that a country or a sovereign state consists of
                                 economy, politics, population, social structure, therefore we conclude four as-
                                 pects to definite fragility which are:
                                 • Cohesion.
                                 • Economy.
                                 • Politics.
                                 • Social.
                                    It is universally acknowledged that these four factors are the fundamental
                                 parts to a certain state or a country, so once some of them change worse due to
                                 the climate change indirectly affect them, the fragility volume will increase and is
                                 mainly determined by the four factors above.
                                    Then we divide fragility into following three levels to define the degree of fra-
                                 gility:
                                 • Extreme Fragile.
                                 • Vulnerable.
                                 • Stable.

                                 3.3. Quantification and Standard
                                 To measure a certain state level of fragility, and next we construct models to
                                 qualify a country’s fragility.
                                    We evaluate fragility in the range of 0 to 10, and determine the acceptable
                                 range for each element for simplifying and clarifying the degree of a country’s
                                 fragility (See Table 2).

                                 Table 2. The degrees of a country’s fragility.

                                                      Points                                    Standard
                                                      0-5                                         Stable
                                                      5-8                                       Vulnerable
                                                      8 - 10                                 Extreme Fragile

                                             Stable                     Vulnerable             Extreme Fragile

                                           0-5                            5-8                       8 - 10

DOI: 10.4236/ijmnta.2018.71002                            19                Int. J. Modern Nonlinear Theory and Application
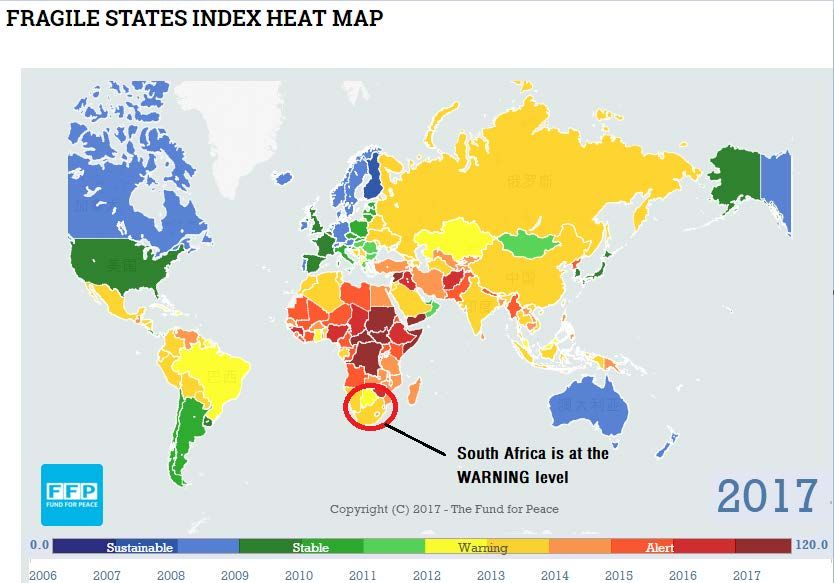
Analysis and Evaluation to a State's Fragility
Z. R. Su et al.

                                 4. Model Design
                                 4.1. Fuzzy Mathematics Evaluation Model
                                 4.1.1. The Reason of Choosing the FME Model
                                 The FME Model always apply to quantify some fuzzy variables to construct a
                                 comprehensive evaluation. There are many applications about Fuzzy Mathemat-
                                 ics Evaluation solutions in numbers of fields such as transportation, medical
                                 treatment, campus environment quality and so on. We focus on comparing the
                                 fragility to a state with campus environment quality and analyze some reports
                                 concerning Fuzzy comprehensive evaluation method of campus environment
                                 quality to find common points in the two subjects, then we decide to start with
                                 the theory to design our model.

                                 4.1.2. Evaluation Steps
                                 • 1) Determine evaluation factors set
                                                                   u = {u1 , u2 , u3 , u4 } .

                                 • 2) Determine evaluation levels set
                                                                   h = {h1 , h2 , h3 , h4 }

                                 • 3) Construct fuzzy relationship matrix R
                                                                     r11 … r1n 
                                                                               
                                                                  R=    
                                                                    r          
                                                                     m1  rmn 
                                   The element rmn refers to fragility membership from the perspective of fac-
                                 tor um at hn level.
                                 • 4) Determine the weight of each evaluation factor

                                                                (=
                                                                 a , a , a , , a ) , ∑ a
                                                                                           q
                                       =A                          1   2   3         q           i   1
                                                                                          i =1

                                                                  aq ≥ 0, i =
                                                                            1, 2, , n

                                   We consider that it is necessary to introduce another model to figure out the
                                 weight vector A and we adopt the AHP model in chapter 4.2.
                                 • 5) Integrate fuzzy synthesis evaluation result vector
                                   After normalizing weight vector A and figuring out the matrix R we construct
                                 the ultimate weight vector F
                                                                                          r11 … r1n 
                                                                                                    
                                                    F = A ⋅ R = ( a1 , a2 , a3 , , aq )     
                                                                                         r          
                                                                                          m1  rmn 

                                 4.2. Sub Model
                                 The AHP Model
                                   The AHP model helps us determine the relative importance between elements.
                                 AHP is a multiple criteria decision-making tool that has been used in almost all
                                 the applications related to the decision-making [2].

DOI: 10.4236/ijmnta.2018.71002                        20                   Int. J. Modern Nonlinear Theory and Application
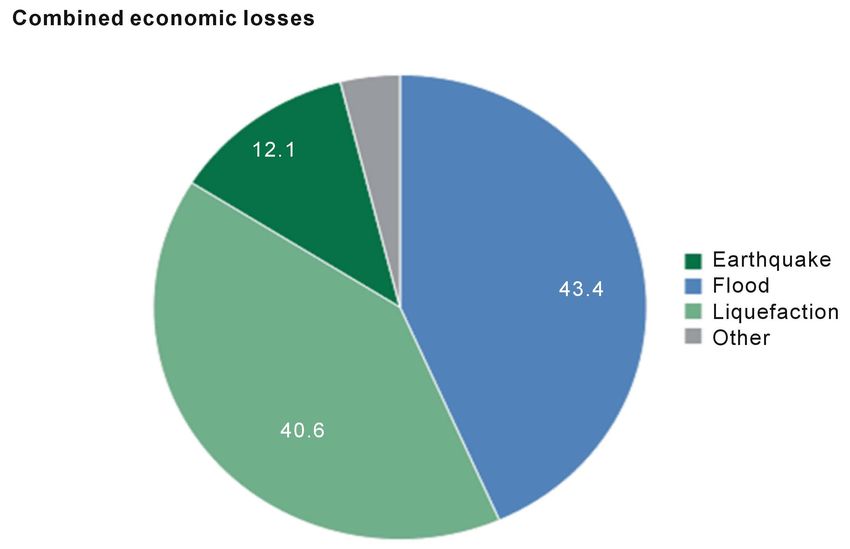
Analysis and Evaluation to a State's Fragility
Z. R. Su et al.

                                   Construct Judgement Matrix
                                   Matrix D

                                                                =D       (D )
                                                                           ij n×n   , Dij > 0,=
                                                                                              D ji
                                                                                                       1
                                                                                                       Dij

                                   Then we use the criterion [3] for AHP.
                                   After integrating our investigation and the change in rankings among a num-
                                 ber of 178 states or countries over the years, we sort these four elements into the
                                 sheet (See Table 3): (The simulation will be shown in the part of Appendix).
                                   So the judgement matrix is:

                                                                       1 1 2 1 4 1 5 
                                                                       2 1 1 2 1 7
                                                                     D=              
                                                                       4 2    1 1 3
                                                                                     
                                                                       5 7    3   1 

                                 4.3. The Solution of the Fuzzy Mathematics Model
                                 4.3.1. Work out the Secondary Weight Vector
                                 We combine the result of AHP model and the fuzzy relationship matrix to ob-
                                 tain the secondary weight F= A ⋅ R and then normalize it into normalized
                                 vector F ′
                                                                         F ′ = ( m1 , m2 , m3 , m4 )

                                 4.3.2. Synthesis
                                 After constructing the vector F ′ , we make use of the statistics from FSI [4] and
                                 improve them in order to match them with vector F ′ through synthesis eval-
                                 uation score method, followed by judging and classifying the scores according to
                                 the standard in Chapter 3.2.
                                            Ultimate Evaluation (UE ) = m1 ∗ C p + m2 ∗ E p + m3 ∗ Pp + m4 ∗ S p

                                 5. Model Application
                                 5.1. Simulation for a Top 10 Country
                                 5.1.1. Yemen, the Typical Country in the Top 10 List
                                 From the Fragile State Index, We show great interest in Yemen, because it is
                                 going through a deadlock about conflict at present—Yemen civil war [5]. The sit-
                                 uation in Yemen is turbulent: Houthi & pro-Saleh forces and Hadi government

                                 Table 3. The evaluation of four elements’ mutual effects.

                                    Factors & Relativity        Cohesion              Economy                Politics    Social

                                         Cohesion                    1                   1/2                   1/4         1/5

                                         Economy                     2                    1                    1/2         1/7

                                          Politics                   4                    2                     1          1/3

                                          Social                     5                    7                     3           1

DOI: 10.4236/ijmnta.2018.71002                             21                       Int. J. Modern Nonlinear Theory and Application
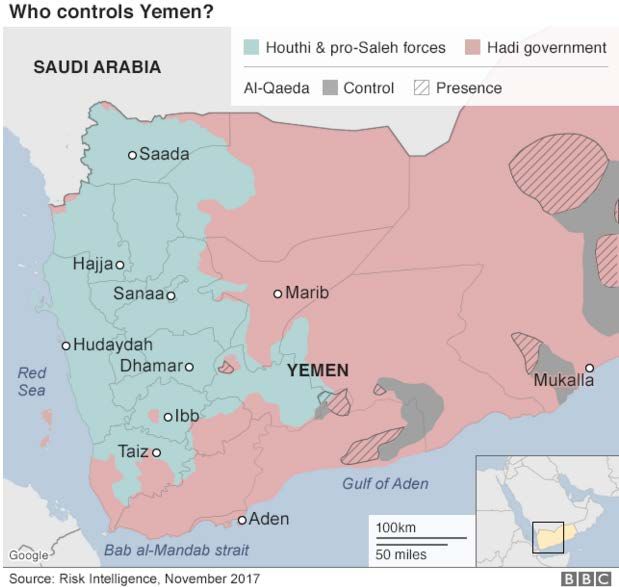
Analysis and Evaluation to a State's Fragility
Z. R. Su et al.

                                 are struggling with each other (Figure 1). It will help us to apply our FME model
                                 to a typical country which is fragile and bearing the party split.
                                   We concern the cause why the conflict happened to Yemen, and negative ef-
                                 fects the war brings to the country rather than the struggle itself.

                                 5.1.2. The Effect Climate Change Brings to Yemen
                                   1) Climate condition
                                   Temperatures are hot in the day, but fall dramatically at night. Perennial
                                 streams occur in the highlands, but these never reach the sea because of high
                                 evaporation in the Tihamah. The central highlands are an extensive high plateau
                                 over 2000 m (6562 ft) in elevation. This area is driver than the western highlands
                                 because of rain-shadow influences, but still receives sufficient rain in wet years
                                 for extensive cropping. Water storage allows for irrigation and the growing of
                                 wheat and barley. Yemen’s portion of the Rub al Khali desert in the east is much
                                 lower, generally below 1000 m (3281 ft), and receives almost no rain [7].
                                   2) Losses and GDP growth damage
                                 • Losses
                                   We can see that the liquefaction takes the lead in mortality (Figure 2) and the
                                 flood domains in economic losses from Nationally reported losses from 1990 to
                                 2014 (Figure 3).
                                 • GDP growth damage
                                   The country has been thwarted from 1992 to 2016 which is also can be seen
                                 from the GDP growth (annual%) [9], and the two obvious sharp drops are vi-
                                 vidly shown from the changing curve (Figure 4):

                                 Figure 1. Who controls Yemen [6]?

DOI: 10.4236/ijmnta.2018.71002                         22               Int. J. Modern Nonlinear Theory and Application
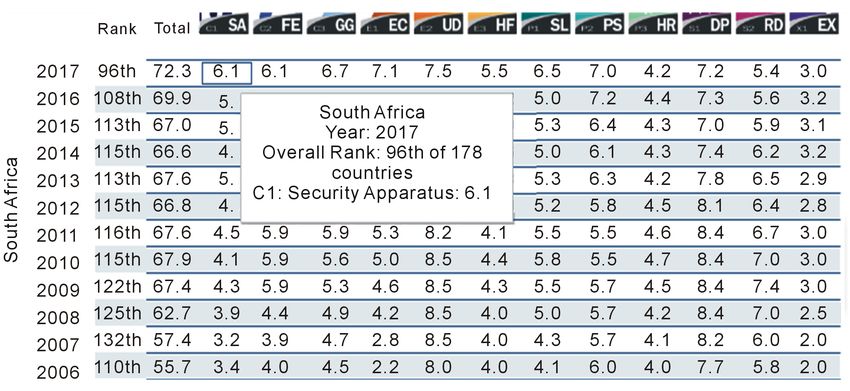
Analysis and Evaluation to a State's Fragility
Z. R. Su et al.

                                 Figure 2. Mortality.

                                 Figure 3. Nationally Reported Losses 1990-2014 [8].

                                 5.1.3. Comparison
                                 We apply the FME model to Yemen, comparing climate change and non-climate
                                 change curves from 2007 to 2017. It is clearly that the red curve (climate change
                                 curve) is higher than the blue curve (non-climate change) most of the time
                                 (Figure 5), so we conclude that the climate change effect on fragility cannot be
                                 ignored.

                                 5.2. Simulation for a State Not in the Top 10 List
                                 5.2.1. Focus on the Climate in South Africa
                                 We pay attention to South Africa (ranks 96th and scores 72.3 points from Fragile
                                 State Index). We look up to documents and news from social media, finding out
                                 that the most disturbing problems of climate change are:

DOI: 10.4236/ijmnta.2018.71002                          23               Int. J. Modern Nonlinear Theory and Application
Z. R. Su et al.

                                 Figure 4. Two sharp drops in the diagram.

                                 Figure 5. Compare the red curve with the blue curve.

                                 • Growing carbon dioxide emission.
                                 • Serious natural disasters.

                                 5.2.2. Global Warming to South Africa
                                 Global warming trend is sweeping across the world, especially in Africa illu-
                                 strated from the Fragile States Index heat map (Figure 6). South Africa is suf-
                                 fering a lot, and it is at WARNING level from the standard which is set by The
                                 Fund for Peace in 2017:

                                 5.2.3. Destructive Natural Disasters
                                 • Earthquakes:
                                   The worst earthquake to hit South Africa was in Tulbagh, an area located in
                                 the Winelands area of the Western Cape, on the 29th of September 1969, it meas-
                                 ured a staggering 6.5 on the Richter Scale, the most recent powerful earthquake

DOI: 10.4236/ijmnta.2018.71002                         24                Int. J. Modern Nonlinear Theory and Application
Z. R. Su et al.

                                 Figure 6. The heat map [10] displays South Africa is a “warm” country in 2017.

                                 in Orkney only measured 5.5. The Tulbagh earthquake remains the most de-
                                 structive in South African History. The earliest reported earthquake took place
                                 on Robben Island in 1620 however the accuracy of the account has been ques-
                                 tioned.
                                 • Floods:
                                    On the 25th of January 1981, the town of Laingsburg was devastated by a se-
                                 vere flood which left over a hundred people dead, 72 of the victim’s bodies were
                                 never recovered. 184 houses were destroyed and only 21 houses remained
                                 standing in the town. The town was hit by a flash flood after very heavy rains
                                 (425mm over two days) which caused the nearby Buffalo River to burst its banks
                                 which resulted in the entire town being covered in the deluge [11].

                                 5.3. Definite the Tipping Point
                                 • We consider that once a certain state of fragility shifts to another state, to be
                                    specific, a country’s state change from “vulnerable” to “stable”, it must go
                                    through the tipping point.
                                 • We update our former standard in chapter 3.3 (Table 2), in order to definite
                                    the tipping or turning point. The fragility is still evaluated from 0 - 10 which
                                    is generally clarified in the sheet (See in Table 4):
                                   Identification:
                                 • When a country’s UE shifts from range [ 0, g1 ] to [ g1 , g 2 ] , it is identified as
                                    passing the tipping point g1 ;
                                 • When a country’s UE shifts from range [ g1 , g 2 ] to [ g 2 ,10] , it is identified
                                    as passing the tipping point g 2 ;
                                 • When a country’s UE shifts more than one range, it is identified as passing
                                    the two points.

DOI: 10.4236/ijmnta.2018.71002                         25                 Int. J. Modern Nonlinear Theory and Application
Z. R. Su et al.

                                 Table 4. Tipping points g1, g2 in evaluation.

                                                     Points                                        Standard

                                                     0 - g1                                         Stable

                                                     g1 - g2                                      Vulnerable
                                                     g2 - 10                                    Extreme Fragile

                                 5.3.1. Prediction Model
                                 According to the diagram with respect to South Africa on Fragile State Index
                                 [12] (Figure 7), South Africa is always ranking the one of the lowest countries
                                 but the situation is worse and worse over the years from 2006 to 2017.
                                   Our team consider that it is necessary to give solutions to predict when and
                                 how the country becomes more fragile under the influence of climate change,
                                 still focus on these evaluation factors and find out whether the country’s stan-
                                 dard will shift passing the tipping point, either. To predict scientifically, we use
                                 the Time Series Forecasting Model to work out the issue.

                                 5.3.2. Description of the Model
                                 Time Series Forecasting Model is aim to forecast the time of the target and study
                                 the changing trend, besides, a time series is often a combination of several forms.

                                 5.3.3. Prediction Formula and Standard Deviation
                                       yt + yt −1 + yt −2 + yt −3
                                    =yt =                          , t N , ,12
                                                    N

                                                                           ∑ ( yt − yt )
                                                                           12               2

                                                                    S=     t=N
                                                                                 12 − N
                                   We use the two formulas to predict the fragility shift in South Africa with its
                                 UE factor from 2006 to 2017 we have calculated, to find out the years and ways
                                 to South Africa changing its fragility standard. We do loop computing succes-
                                 sively to solve out the statistics from 2018 (Vulnerable) to a certain year (Ex-
                                 treme Fragile) in the future (The result will be shown in the part of Appendix).

                                 5.3.4. Further Research in South Africa
                                 The country faces immense social problems—poverty and inequality, unem-
                                 ployment, HIV/AIDS and personal and property insecurity—which have
                                 barely improved since the apartheid era, or even deteriorated. Ten million
                                 people—23 per cent of the population—were living on less than $2 per day in
                                 2000, and an estimated 37 per cent were below a nationally defined poverty
                                 line [13].

                                 5.4. Intervention Mechanism
                                 5.4.1. Somalia’s Response
                                 Somalia government has been taken actions (Figure 8) to prevent and deal with
                                 the drought issue [14].

DOI: 10.4236/ijmnta.2018.71002                            26                Int. J. Modern Nonlinear Theory and Application
Z. R. Su et al.

                                 Figure 7. The statistics table from 2006 to 2017.

                                      The ICRC in Somalia is helping communities access whatever water is availa-
                                 ble, and so far this year has assisted 760,000 people.

                                 5.4.2. Grey Model and Cost
                                   1) Grey Model
                                      Given a row of origin statistic          ( x( ) (1) , x( ) ( 2 ) ,, x( ) ( n ) ) , to constant ζ, if
                                                                                    0           0            0

                                 x(
                                      0)
                                           (i ) > ζ   , we identify it as abnormal number(s). Next we pick them from the
                                 row and form another row of statistic, the new row of statistic is the disaster se-
                                 quence.
                                    We construct GM (1,1) model which means that it contains only level 1 and
                                 1 variable—the rainfall statistics from 2006 to 2017 with the accumulate method
                                 to predict how Somalia will be less fragile in the future.
                                      After we predict the year of the drought in Somalia next time, we emphasize
                                 that it is vital to realize the importance of the aid for the Somalia government, as
                                 its response for drought in 2017 and should intensify the investigation.
                                      2) Cost Prediction
                                      To Somalia, we classify water and sanitation activities with relief activities into
                                 the standard Economy and Social, and then we put health care activities in Poli-
                                 tics and Cohesion.
                                      Before the Somalia’s intervention, we use the vector

                                                                       S 01 = ( C p , E p , Pp , S p )

                                      After the Somalia’s intervention, the vector changes into

                                                                       S 02 = ( C ′p , E ′p , Pp′ , S ′p )

                                      Define
                                                                                S 01(1) = C p

                                      Then we follow the rule
                                                                               S 01( 2 ) = E p


DOI: 10.4236/ijmnta.2018.71002                                 27                   Int. J. Modern Nonlinear Theory and Application
Z. R. Su et al.

                                 Figure 8. ICRC’s aid.

DOI: 10.4236/ijmnta.2018.71002                       28   Int. J. Modern Nonlinear Theory and Application
Z. R. Su et al.

                                    In view of a country’s GDP contribution rate to every factor is different, we
                                  introduce the rate a% to determine the share of the two main category. Now we
                                  can infer the cost formula:
                                        S 01(1) − S 02(1) S 01( 4 ) − S 02( 4 ) 
                        =W GDP * a % *                      +                       
                                             S 01(1)                  S 02( 4 )     
                                                                                    
                                                 S 01( 2 ) − S 02( 2 ) S 01( 3) − S 02( 3) 
                           + GDP * (1 − a % ) *                        +                   
                                                                                          
                                                       S 01( 2 )                 S 01( 3)

                                  6. Modification
                                    The bigger or smaller one?
                                    More recently, cities have emerged as a new category of fragility in the securi-
                                  ty and development landscape. With unprecedentedly fast urbanization rates, ci-
                                  ties are becoming the focal point of global poverty, conflict, and vulnerability to
                                  disasters—particularly when situated within a fragile state [15].

                                  7. Conclusions
                                  • Strengths
                                    We improve our algorithm in AHP model, and integrate R with AHP model
                                  to build the complete Fuzzy Mathematics Model. We opportunely apply our
                                  prediction models to successfully predict the situation in Yemen and Somalia.
                                  Through our work, we consider that the FME model and prediction models are
                                  necessary to accurately evaluate the degree of a state’s fragility and helpful for
                                  the government to take actions to reduce the damage caused by the climate
                                  change.
                                  • Weaknesses
                                    There are also some cons along with the pros during our modeling process.
                                    The determination of R may be subjective, and the Time Series Forecasting
                                  model is strongly dependent on the statistics from our investigation, so the devi-
                                  ation cannot be neglected. Our assumptions may be a little incomplete or
                                  somewhat needless, and the notations may have mutual effects, in order to sim-
                                  plify the problem we ignore them.
                                  • Future work
                                    First, we will improve our models to avoid using the data which is not con-
                                  vincing enough or somewhat subjective. Secondly, we are devoted to finding
                                  some more rational algorithms and analyzing the issue in a multi-dimensional
                                  way such as the relationship between the extent of climate change and national
                                  aid cost over the years.
                                    Besides, we also show great interest in fragility in Asian countries like China,
                                  Korea, Japan and so on.

                                  References
                                  [1]   European Council (2007) Council Conclusions on an EU Response to Situations of

DOI: 10.4236/ijmnta.2018.71002                          29               Int. J. Modern Nonlinear Theory and Application
Z. R. Su et al.

                                       Fragility. 19-20 November.
                                 [2]   Analytic Hierarchy Process: An Overview of Applications, Omkarprasad S. Vaidya,
                                       Sushil Kumar, 2006.
                                 [3]   https://en.wikipedia.org/wiki/Analytic_hierarchy_process_%E2%80%93_leader_exa
                                       mple
                                 [4]   Fragile State Index. http://fundforpeace.org/fsi/
                                 [5]   https://en.wikipedia.org/wiki/Yemeni_Civil_War_(2015%E2%80%93present
                                 [6]   Yemen Crisis: Who Is Fighting Whom? BBC News, World-Middle East, 2018.
                                       http://www.bbc.com/news/world-middle-east-29319423
                                 [7]   https://en.wikipedia.org/wiki/Yemen#Regions_and_climate
                                 [8]   https://www.preventionweb.net/countries/yem/data/
                                 [9]   https://data.worldbank.org/indicator/NY.GDP.MKTP.KD.ZG?locations=YE
                                 [10] http://fundforpeace.org/fsi/
                                 [11] https://briefly.co.za/4773-video-shows-uzalo-stars-beauty-netizens-throw-shade.ht
                                      ml#4773
                                 [12] Fragile State Index. http://fundforpeace.org/fsi/
                                 [13] LSE Research Online, Jo Beall, Stephen Gelb and Shireen Hassim, Fragile Stability:
                                      State and Society in Democratic South Africa.
                                 [14] Somalia Drought Emergency Response in 2017.
                                      https://www.icrc.org/en/document/somalia-drought-emergency-response-2017
                                 [15] Discussion Paper Fragile States and Fragile Cities, Independent Commission on
                                      Multilateralism.

DOI: 10.4236/ijmnta.2018.71002                           30                 Int. J. Modern Nonlinear Theory and Application
Z. R. Su et al.

                                 Appendix
                                 • AHP Model

                                 Table A1. The fundamental scale for pairwise comparisons.

                                                          The Fundamental Scale for Pairwise Comparisons

                                       Intensity of
                                                                   Definition                              Explanation
                                       Importance
                                                                                        Two elements contribute equally to the
                                            1                   Equal importance
                                                                                        objective
                                                                                        Experience and judgment moderately favor
                                            3              Moderate importance
                                                                                        one element over another
                                                                                        Experience and judgement strongly favor one
                                            5                   Strong importance
                                                                                        element over another
                                                                                        One element is favored very strongly over
                                            7              Very strong importance       another, its dominance is demonstrated in
                                                                                        practice
                                                                                        The evidence favoring one element over
                                            9               Extreme importance          another is of the highest possible order of
                                                                                        affirmation

                                  Intensities of 2, 4, 6, and 8 can be used to express intermediate values. Intensities of 1.1, 1.2, 1.3,
                                  etc. can be used for elements that are very close in importance.

                                 B1= [1         1/2 1/4 1/5        ;
                                       2        1     1/2 1/7       ;
                                       4        2     1   1/3           ;
                                       5        7     3   1 ];
                                 [n,n]=size(B1);
                                 [v,d]=eig(B1);
                                 r=d(1,1);
                                 CI=(r-n)/(n-1);
                                 RI=[0 0 0.58 0.90 1.12 1.24 1.32 1.41 1.45 1.49 1.52 1.54 1.56 1.58 1.59];
                                 CR=CI/RI(n);
                                 if CR
Z. R. Su et al.

                                 disp(num2str(CR_Result));
                                 disp('Eigenvalue:');
                                 disp(num2str(r));
                                 disp('weight vector:');
                                 disp(num2str(w));
                                   Inconsistent degree
                                   Consistent Index
                                                                                λ −n
                                                                         CI =
                                                                                n −1
                                   Consistent rate
                                                                                CI
                                                                         CR =      ,
                                                                                RI
                                   When CR < 0.1 , the consistency check result is Pass.
                                 • Vector A :
                                                     A = [ 0.073746 0.11084 0.22847           0.58695]

                                 • Matrix R :

                                                                0.058   0.277 0.556 0.110 
                                                               0.160    0.489 0.310 0.041
                                                             R=
                                                               0.040    0.328 0.466 0.167 
                                                                                          
                                                                0.041   0.225 0.499 0.236 

                                 • Time Series Forecasting Predict Model Statistics

                                 Table A2. Time series forecasting predict model statistics

                                                      2006                                       4.7615

                                                      2007                                       4.9071

                                                      2008                                       5.2982

                                                      2009                                       5.5896

                                                      2010                                       5.6606

                                                      2011                                       5.5631

                                                      2012                                       5.5155

                                                      2013                                       5.5961

                                                      2014                                       5.4963

                                                      2015                                       5.5895

                                                      2016                                       5.7992

                                                      2017                                       6.0201

                                                      2018                                       5.9871

                                                      2019                                       6.1098

                                                      2020                                       6.2399

                                                      2021                                       6.3500

DOI: 10.4236/ijmnta.2018.71002                          32                 Int. J. Modern Nonlinear Theory and Application
Z. R. Su et al.

                                 Continued

                                                      2022                                           6.4325

                                                      2023                                           6.5439

                                                      2024                                           6.6524

                                                      2025                                           6.7555

                                                      2026                                           6.7894

                                                      2027                                           6.8992

                                                      2028                                           7.0159

                                                      2029                                           7.1339

                                                      2030                                           7.2285

                                                      2031                                           7.3383

                                                      2032                                           7.4480

                                                      2033                                           7.5561

                                                      2034                                           7.6616

                                                      2035                                           7.7699

                                                      2036                                           7.8778

                                                      2037                                           7.9583

                                                      2038                                           8.0925

                                 South Africa will be ‘Extreme Fragile’ in 2038.
                                 • Grey Model code
                                 a=[220.8,224.9,246.8,262.8,276.0,214.8,356.1,225.7,250.9,259.1,238.7,275.2,
                                   269.1,285.7,263.8,281.2,287.7,263.4,254.5,244.6,292.6,258.1,302.3,259.8] ;
                                 t0=find(a
You can also read