Lake Powell Pipeline Project Appendix B: Purpose and Need Report - Coconino and Mohave Counties, Arizona Kane and Washington Counties, Utah ...
←
→
Page content transcription
If your browser does not render page correctly, please read the page content below
- BUREAU OF -
 RECLAMATION

 Lake Powell Pipeline Project
 Appendix B: Purpose and Need
 Report
 Coconino and Mohave Counties, Arizona
 Kane and Washington Counties, Utah

U.S. Department of the Interior June 2020
Contents
 Page

Introduction ......................................................................................................1
 1.1 Objective of this Report........................................................................................... 1
 1.2 Lake Powell Pipeline Project Participants ............................................................. 1
Proposed Lake Powell Pipeline Project ...........................................................1
 2.1 Project Proponent Objectives ................................................................................. 2
Methods for Need Assessment ....................................................................... 2
 3.1 Study Team ................................................................................................................ 2
 3.2 Study Approach ......................................................................................................... 2
 3.2.1 Water Supply .................................................................................................... 4
 3.2.2 Water Demand ................................................................................................ 4
 3.2.3 Water Needs .................................................................................................... 4
Water Supplies ................................................................................................. 5
 4.1 Kane County Water Conservancy District ............................................................ 5
 4.1.1 Current Operations and Delivery System.................................................... 5
 4.1.2 Current, Planned, and Future Supply ........................................................... 5
 4.2 Washington County Water Conservancy District ................................................ 6
 4.2.1 Current Operations and Delivery System.................................................... 6
 4.2.2 Virgin River Daily Simulation Model ........................................................... 8
 4.2.3 Current Supply................................................................................................. 8
 4.2.4 Local Planned Projects to Increase Future Water Supply ......................... 9
 4.2.5 Projected Water Supply without LPP .......................................................... 9
Water Conservation ........................................................................................ 10
 5.1 Participant Water Conservation Practices ........................................................... 10
 5.1.1 Kane County Water Conservancy District ................................................ 10
 5.1.2 Washington County Water Conservancy District .................................... 10
 5.2 Evaluation of Water Use Rates ............................................................................. 11
Water Demand ............................................................................................... 12
 6.1 Kane County Water Conservancy District .......................................................... 12
 6.1.1 Demographic Projections ............................................................................ 12
 6.1.2 Future Water Requirements ........................................................................ 12
 6.2 Washington County Water Conservancy District .............................................. 13
 6.2.1 Demographic Projections ............................................................................ 13
 6.2.2 Future Water Requirements ........................................................................ 13
Participant Water Needs ................................................................................ 14
 7.1 Kane County Water Conservancy District .......................................................... 14
 7.2 Washington County Water Conservancy District .............................................. 15
 7.2.1 Projected Shortages in Reliable Yield......................................................... 15
 7.2.2 Lake Powell Pipeline Project Contribution to Reliable Yield ................. 15
 7.2.3 Conclusion ..................................................................................................... 16
Purpose and Need Statement ........................................................................ 17
References ...................................................................................................... 17
 Acronyms ...................................................................................................... 18

 i
Tables
Table 4.1-1 Current, Planned, and Future Supplies for Kane County Water
 Conservancy District ........................................................................................ 5
Table 4.2-1 Current Water Supplies for Washington County Water
 Conservancy District ........................................................................................ 9
Table 4.2-2 Local Planned Projects by Washington County Water Conservancy
 District ................................................................................................................ 9
Table 5.2-1 Water Usage Rates (gallons per capita per day) for Kane County,
 Utah ................................................................................................................... 11
Table 5.2-2 Water Usage Rates (gallons per capita per day) for Washington
 County, Utah .................................................................................................... 12
Table 6.1-1 Future Water Requirements for Kane County Water Conservancy
 District .............................................................................................................. 13
Table 6.2-1 Future Water Requirements for Washington County Water
 Conservancy District ...................................................................................... 14
Table 7.1-1 Projected Supply Surplus in 2060 for Kane County Water
 Conservancy District ...................................................................................... 15
Table 7.2-1 Projected Water Supply Deficit in 2060 for Washington County
 Water Conservancy District........................................................................... 15
Table 7.2-2 Lake Powell Pipeline Contribution to Washington County Water
 Conservancy District’s Reliable Water Supply in 2060.............................. 16

Figures
Figure 3.2-1 Service Areas for the Project Participants .................................................... 3

 ii
Introduction

1.1 Objective of this Report
The overall objective of this report is to assess the water needs of the Project Participants, determine
to what extent the Lake Powell Pipeline (LPP) Project would meet those water needs, and define the
purpose and need statement for the LPP Project Draft Environmental Impact Statement (DEIS).
This report outlines the process used to determine the underlying need to which the Bureau of
Reclamation (Reclamation) and the cooperating agencies are responding and Reclamation’s vetting
of that process. Originally, the Kane County System was included in the project; however, as a result
of Reclamation’s evaluation of Kane County Water Conservancy District’s (KCWCD) supply and
demand and a letter received from the general manager of the KCWCD, the Kane County System
was removed (see analysis below).

1.2 Lake Powell Pipeline Project Participants
The Utah Board of Water Resources (UBWR) is the policy-making body of the Utah Division of
Water Resources (UDWRe) and is the Project Proponent. The Project Participants (or simply
“Participants”) for the LPP Project include the Washington County Water Conservancy District
(WCWCD) and KCWCD.

 Proposed Lake Powell Pipeline Project
The LPP is a proposed water delivery pipeline that begins at Lake Powell near Glen Canyon Dam in
Page, Arizona, and ends at Sand Hollow Reservoir near St. George, Utah. The pipeline would
deliver up to 86,249 acre-feet of water from Lake Powell to Washington and Kane Counties in Utah,
with the objective to satisfy future water demands of growing populations in those counties. Up to
82,249 acre-feet of water would be delivered to WCWCD’s service area and up to 4,000 acre-feet
would be delivered to the Kanab/Johnson Creeks Sub-basin service area of the KCWCD. Two
pipeline alignments have been proposed: the Southern Alternative and the Highway Alternative.
Both alternatives begin and end in the same location and would be capable of delivering the same
amount of water on the same demand schedule. Therefore, the rest of the individual components of
the LPP Project are not discussed further. Those details are provided in the LPP Plan of
Development (UDWRe 2020a; provided as Appendix E, Plan of Development) and Chapter 2,
Alternatives Development and Screening, of the LPP DEIS.

 1
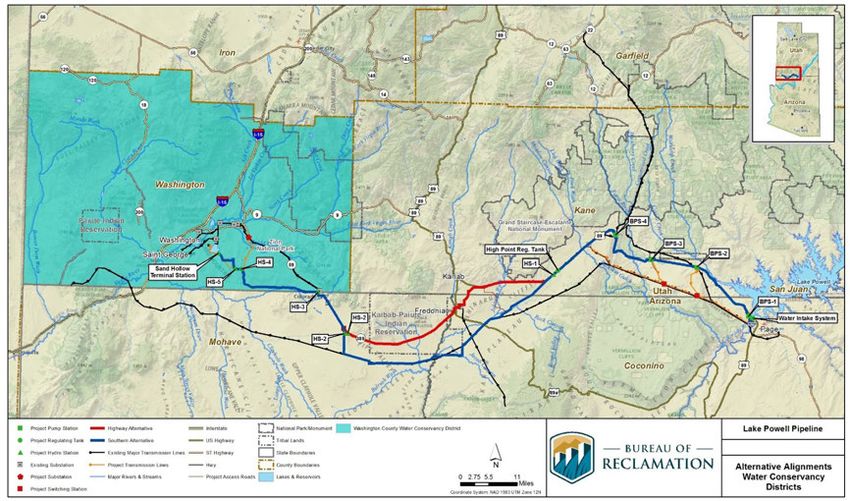
2.1 Project Proponent Objectives
The UBWR proposes building the LPP to meet future water demands through 2060 and beyond. In
addition, the LPP is intended to achieve other prudent planning objectives, consistent with the
UBWR’s mission (UBWR 2019; UDWRe 2019), which include:
 1. Diversifying the regional water supply portfolio by providing a second source of water for
 Washington County;
 2. Providing for system reliability by developing a secure source of water;
 3. Providing for system redundancy in the event of system failure due to disasters or aging
 infrastructure;
 4. Accounting for climate change scenarios; and
 5. Accounting for long-term uncertainty when considering the summed effect of the
 vulnerability to the water supply.

Other large water districts/suppliers in Utah that operate and maintain some of Reclamation’s
federal projects have similar objectives in both their day-to-day and long-term plans (e.g., Jordan
Valley Water Conservancy District 2019).

 Methods for Need Assessment

3.1 Study Team
The study team tasked with vetting the information that was provided by the Project Participants
included two civil engineers from Reclamation that are experienced in hydrology modeling and
reservoir operations.

3.2 Study Approach
Each Project Participant provided information and data regarding supply and demand scenarios for
their respective service areas (see Figure 3.2-1). One engineer reviewed the supply information and
the other engineer reviewed the demand information for each Project Participant. Water needs were
then determined by subtracting supply from demand. Where a quantitative method was not used by
the Project Participants, the Reclamation team used their years of experience and professional
judgment to determine whether the information provided and the conclusions derived were
reasonable.

 2
Figure 3.2-1 Service Areas for the Project Participants

 3
3.2.1 Water Supply
The Project Participants provided supply information using different approaches. KCWCD’s supply
is largely from groundwater resources. No model or climate change component is quantitatively
applied to their groundwater supply. Water supply data was collected from UDWRe’s 2018
Municipal and Industrial (M&I) Use Report and KCWCD water managers and operators (UDWRe
2018).

The WCWCD primarily derives their water supply from surface water resources (Virgin River),
although some groundwater sources provide a portion of their supply. In addition, the UDWRe
developed the Virgin River Daily Simulation Model (VRDSM) to estimate reliable yield for
WCWCD’s supply. The VRDSM now includes a climate change component for the surface water
supplies. Vetting WCWCD’s supply information, therefore, included reviewing the VRDSM
assumptions and inputs, outputs, and resulting data.

3.2.2 Water Demand
Base annual water demand was based on population projections from the University of Utah Kem
C. Gardner Policy Institute (Gardner Institute 2017). Other factors were included as well for the
WCWCD, including water usage rate (gallons per capita per day [gpcd]), conservation, system loss,
and a 15-year reserve planning buffer. Factors for KCWCD were the same except for conservation
and the lack of a 15-year buffer. Vetting demand information, therefore, included determining
whether estimates and the approach (e.g., rate of conservation, inclusion of a reserve buffer) were
reasonable in light of the Districts’ need to provide reliable water supplies to customers in their
service areas and also plan against uncertainties related to climate change, reductions in water quality,
reliance on a single source, unexpected population growth or economic expansion, and potential
interruptions in supply.

3.2.3 Water Needs
The future water need (or supply deficit) in each Participant’s service area was calculated by
subtracting the estimated water supply in 2060 from the estimated water demand in 2060. Adding
the water needs together provided the amount of water needed for the overall Proposed Project.
After calculating the future water need, the amount of LPP water allotted to each Project Participant
was applied to their respective deficits. This identified the contribution of the Proposed Project to
satisfying the water supply deficit and whether a deficit remained or if the Proposed Project would
result in a surplus. Vetting this portion of the process was simply a determination that the correct
mathematical operations were used.

 4
Water Supplies

4.1 Kane County Water Conservancy District
The KCWCD was formed in 1992. The KCWCD boundary encompasses all of Kane County. Kane
County is geographically large and diverse county that encompasses pieces of multiple Utah water
rights adjudication subdivisions or sub-basins. These sub-basins include the following:
 • East Fork Virgin River;
 • Kanab/Johnson Creeks;
 • Zion;
 • Paria River;
 • Escalante;
 • Boulder; and
 • An unassigned/unnamed basin.

The KCWCD and other water providers in the county manage and provide water supplies to
communities and rural areas throughout the sub-basins. Existing KCWCD water supply customers
include rural developments located in the Cedar Mountain and Johnson Canyon areas. The
KCWCD owns and operates wells in the Johnson Canyon area to meet these demands. The
KCWCD has a connection to the Kanab City water supply and plans to supply water in the future to
this municipal customer. This needs analysis focuses on supplies and demand in the Kanab/Johnson
Creeks sub-basin, which encompass Kanab City and the Johnson Canyon area.

4.1.1 Current Operations and Delivery System
All existing M&I supplies in Kane County, including those in the Kanab/Johnson Creeks sub-basin,
are derived from groundwater resources (wells and springs). Most current groundwater supplies are
pumped from the Navajo Sandstone Aquifer.

4.1.2 Current, Planned, and Future Supply
Current supply minus 10 percent shortage is estimated at 2,278 acre-feet per year based on UDWRe
M&I Water Use 2018 data (UDWRe 2018). Planned reliable supply was estimated by KCWCD
water managers and operators. Future reliable supply was a sum of the current and planned supplies,
totaling 4,123 acre-feet per year (see Table 4.1-1 below).

Table 4.1-1 Current, Planned, and Future Supplies for Kane County Water Conservancy District
 Supply acre-feet per year
 Current (2020) Reliable Supply with 10% Reserve 2,278
 Planned Reliable Supply with 10% Reserve 1,845
 2060 Reliable Supply with 10% Reserve 4,123

 5
4.2 Washington County Water Conservancy District
The WCWCD is a public non-profit agency, charged under state law with conserving, developing,
managing, and stabilizing water supplies within the county to establish a safe, sustainable water
supply for human use and for a healthy natural environment in the Virgin River basin. The
WCWCD is primarily a wholesaler of water to local water providers. As a political subdivision of the
state, the WCWCD operates under the Water Conservancy District Act (Utah Code Annotated
[UCA] § 17B-2a-1001 et seq.), Limited Purpose Local Government Entities – Local Districts (UCA
§ 17B-1-101 et seq.), Open and Public Meetings Act (UCA § 52-4-1 et seq.) and other statutes
generally applicable to public agencies. The WCWCD has the limited purposes and powers set forth
in Utah law applicable to limited purpose local government entities and has no general police powers
or governing authority.

4.2.1 Current Operations and Delivery System
The cities and towns in Washington County have historically developed independent water
collection and treatment systems; however, since WCWCD’s first project in the mid-1980s, the
major municipal water systems have become increasingly integrated. The majority of WCWCD
system water is delivered to municipal customers who serve over 85 percent of the population of the
county. WCWCD water supply systems include the following major facilities.

Quail Creek Water Treatment Plant. The Quail Creek Water Treatment Plant is an integral
component of WCWCD’s water system. This 60-million-gallon-per-day (mgd) plant can receive
water from three sources: Quail Creek Reservoir, Sand Hollow Reservoir, and the Virgin River. The
plant delivers culinary water to Regional Water Supply Agreement municipal customers. Located just
below Quail Creek Reservoir, this conventional filtration plant will eventually be expanded to treat
80 mgd.

Quail Creek and Sand Hollow System. Quail Creek and Sand Hollow Reservoirs are a combined
system, receiving Virgin River water from the Quail Creek Diversion structure through a pipeline
network. Water delivery to these off-stream reservoirs is limited by the capacity and operational
requirements of the diversion structure and pipeline system. Quail Creek Reservoir has a capacity of
40,000 acre-feet and supplies raw water to the Quail Creek Water Treatment Plant. Sand Hollow
Reservoir has a 50,000-acre-foot capacity with an active pool of about 30,000 acre-feet and a
drought pool of 20,000 acre-feet reserved for extreme drought. The drought pool is included in the
reliable yield for Sand Hollow Reservoir. In addition, the reservoir serves as a groundwater recharge
facility to the Navajo Sandstone Aquifer, which currently stores about 140,000 acre-feet with an
estimated future capacity of about 300,000 acre-feet. Water may be delivered from Sand Hollow to
Quail Creek Reservoir or directly to the Quail Creek Water Treatment Plant.

Kolob Reservoir. Kolob Reservoir, 5,585 acre-feet, on a tributary of the Virgin River, was built in
1957 and later acquired by the WCWCD. Water from the reservoir is released to the Virgin River for
diversion at the Quail Creek diversion structure for storage in Quail Creek and Sand Hollow
reservoir.

 6
Crystal Creek Pipeline. Water is diverted from Crystal Creek and conveyed through a 12-mile
pipeline to Kolob Reservoir to augment deliveries to Quail Creek and Sand Hollow Reservoirs. The
yield for the Crystal Creek Pipeline was assumed to be “new water” that would otherwise not be
diverted from the Virgin River, because it utilizes excess capacity in Kolob Reservoir.

Meadow Hollow Reservoir. Meadow Hollow Reservoir, 600 acre-feet, is located on Spring Creek
and LaVerkin Creek in Iron County and was built in 1948 for irrigation purposes.

Ash Creek Reservoir. Ash Creek Reservoir is a 3,275-acre-foot reservoir that receives snowmelt
and peak flow runoff from the Ash Creek drainage basin. The reservoir seldom fills, does not retain
water, and the storage capacity has been restricted significantly because of dam safety concerns by
the Utah State Engineer. The Ash Creek Pipeline is currently proposed to convey water from Ash
Creek Reservoir to the proposed Toquer Reservoir near Anderson Junction.

Sand Hollow Wells. The Sand Hollow well field includes 18 wells that draw water from pre-
reservoir groundwater rights and from water recharged to the Navajo Sandstone Aquifer by Sand
Hollow Reservoir. Water is chlorinated and pumped to two storage tanks with a total of 3 million
gallons of storage capacity prior to delivery to Regional Water Supply Agreement municipal
customers and Sky Ranch and Cliff Dwellers retail customers. Currently it is estimated that there are
approximately 140,000 acre-feet stored in the aquifer that could be used for this purpose. Most of
the recharged water stored in the Navajo Sandstone Aquifer would be reserved for use during dry
periods to compensate for any deficit between annual supply and demand.

Cottam Wells System. The Cottam Well System delivers water from two wells via pipeline to
Toquerville, LaVerkin, and Hurricane and Virgin and, if needed, to Leeds. This system also supplies
water to about 20 customers in WCWCD’s retail system, Casa de Oro, near Leeds.

Kayenta (Ence Wells) Water System. The Kayenta Wells (also known as the Ence Wells) are two
wells with a total pumping capacity of 310 gallons per minute located within the incorporated
boundary of Ivins. They provide water to the residential community of Kayenta.

Regional Pipeline Transmission System. The Regional Pipeline transmission system (pipeline,
500,000-gallon tank, and two pump stations) conveys water from the Quail Creek Water Treatment
Plant and Sand Hollow Wells to St. George, Santa Clara, Washington, and Ivins.

Retail Water Systems. The WCWCD delivers retail water to the residential communities of Sky
Ranch and Cliff Dwellers, south of Hurricane, the Casa de Oro subdivision near Leeds and certain
areas on Kolob plateau.

St. George Wastewater and Reuse Treatment Plants. Utah water law specifies that original water
rights owners retain ownership after the first-use water has been treated for reuse so the St. George
Treatment Plant relies upon agreements reached with WCWCD and municipal entities to distribute
the reclaimed water. The St. George Wastewater Treatment Plant (WWTP) produces Type II
effluent using an extended aeration treatment process that uses physical and biological processes to
treat sewage. The current design capacity of the WWTP is about 17 mgd. The wastewater effluent is
either treated by the reuse plant or discharged to the Virgin River. St. George completed the reuse
plant in 2006 to treat water from the WWTP for reuse as secondary untreated water, in conjunction
with the Shivwits Band of Paiute Indians water rights settlement on Santa Clara River water, under

 7
which St. George agreed to deliver 2,000 acre-feet of reuse water annually to the Shivwits Band of
Paiute Indians.

4.2.2 Virgin River Daily Simulation Model
The VRDSM is a mean daily simulation model of the Virgin River developed by the UDWRe. The
model is a FORTRAN-based yield model used to evaluate potential changes in operations on the
Virgin River in southwest Utah. The model simulates the river system from the Virgin River at
Virgin gage to the Utah-Arizona state line for a 78-year period from 1941 to 2018. The model
simulates the Quail Creek project, Sand Hollow Reservoir, pump-back from the Washington Fields
diversion to Sand Hollow Reservoir, hydropower plants in operation within the WCWCD and
instream flow requirements (UDWRe 1998). The model has the capability to simulate additional
regulating storage, an expanded secondary system for the St. George area and the import of Lake
Powell reservoir water to Sand Hollow Reservoir by the LPP.

Inflow to the model includes streamflow records from the Virgin River at the Virgin gage and the
main Virgin River tributary inflow, including Ash Creek/LaVerkin Creek, Quail Creek/Leeds Creek
and the Santa Clara River. The U.S. Geological Survey stream gage located on the Virgin River near
the town of Virgin (USGS 09406000) provides long-term records for the Virgin River at Virgin
(1909 to 1971 and then 1979 to the present). Discontinued streamflow records (1972 to 1978) were
estimated using the Virgin River near Hurricane gage, which began in 1967, and equations from the
model. Short-term records are available on Ash Creek and LaVerkin Creek. Missing data were
estimated with correlations to the Virgin gage. Missing years at the Santa Clara River gage (1941 to
1950 and 1955 to 1983) were filled in from the UDWRe monthly model of the Santa Clara River.
The monthly flows from the model were divided by the number of days in the month to obtain the
daily inflows (UDWRe 1998).

Flow is diverted year-round in the Quail Creek pipeline to provide flows to the Hurricane and
LaVerkin diversions, Pah Tempe hydropower flows and flow to Quail Creek Reservoir. If the
natural flow is less than 86 cubic feet per second at the Washington Fields Diversion, no water is
diverted to Quail Creek Reservoir (UDWRe 1998).

The VRDSM can be configured to analyze local surface water yields under various conditions or to
analyze effects of specific operations on the Virgin River. For the yield analysis in this DEIS,
VRDSM simulates the maximum water supply yield in the St. George area with a specified
maximum shortage in the worst year (10 percent in the Proposed Project simulations). This
simulation produces a 90 percent reliable yield of local surface water supplies for further planning
studies.

4.2.3 Current Supply
Washington County water supplies come from a combination of groundwater (springs and wells)
and surface water (direct diversions and reservoirs; Table 4.2-1). The Navajo Sandstone Aquifer and
shallow alluvial aquifers in the Virgin River Basin provide groundwater resources. Surface water
sources consist of the Virgin River and its tributaries. Groundwater supplies developed by public
drinking water systems are generally of high quality and can be used directly for culinary uses after
disinfection. Surface water supplies are used directly to meet secondary untreated water demands or
are treated to meet culinary demands.

 8
Table 4.2-1 Current Water Supplies for Washington County Water Conservancy District
 Reliable Culinary Reliable Secondary Water
 Current Supplies Water Yield Yield
 (acre-feet/year) (acre-feet/year)
 Quail Creek and Sand Hollow Reservoirs (a),(b) 24,922 0
 Sand Hollow No-Recharge Groundwater (c) 4,000 0
 Cottam Well Field 875 0
 Kayenta (Ence Wells) Water System 250 0
 Crystal Creek Pipeline 2,000 0
 Toquerville Secondary untreated Water System 0 178
 Other Washington County Municipal Providers 27,125 8,327
 Subtotals 59,172 8,505
 Total Current Supplies 67,677
Notes:
(a) Reliable yield for Quail and Sand Hollow Reservoirs includes yields from Kolob and Meadow Hollow Reservoirs.
(b) Reliable yield determined using a 50th percentile climate change scenario with a 10 percent shortage condition.
(c) Supply utilizes existing water rights and natural basin recharge.

4.2.4 Local Planned Projects to Increase Future Water Supply
Because most of the readily available water in the county has been developed and most of the
county is closed by the state engineer to the acquisition of new water rights, the municipalities
generally rely upon the WCWCD for future water supplies, most of which will need to be provided
through large water projects that require a regional funding base (Table 4.2-2).

Table 4.2-2 Local Planned Projects by Washington County Water Conservancy District
 Reliable Culinary Reliable Secondary
 Future Planned Supplies Water Yield Water Yield
 (acre-feet/year) (acre-feet/year)
 Ash Creek Pipeline (a) 2,840 0
 Sand Hollow Recharge and Recovery 3,000 0
 Westside (Gunlock Wells) Arsenic Treatment 5,000 0
 Groundwater Well Development 2,830 0
 Maximize Existing Wastewater Reuse 0 7,300
 Agricultural Conversion from Development (b) 0 10,080
 Subtotals 13,670 17,380
 Total Future Supplies 31,050
Notes:
(a) Reliable yield determined using a 50th percentile climate change scenario with a 10 percent shortage condition.
(b) The estimated supply is 12,880 acre-feet/year with 90 percent reliability. However, it was estimated that
approximately 2,800 acre-feet/year of this supply is currently in use and has been accounted for in the reliable
secondary untreated supply.

4.2.5 Projected Water Supply without LPP
The total reliable current and planned water supplies from the local Virgin River basin equals 98,727
acre-feet per year, which is the summed total of the current reliable water supply (67,677 acre-feet)
and the estimated reliable water supply from future non-LPP projects (31,050 acre-feet).

 9
Water Conservation

5.1 Participant Water Conservation Practices
5.1.1 Kane County Water Conservancy District
The Districts have pursued conservation objectives for many years. The KCWCD and the City of
Kanab have developed conservation plans for the Johnson Creek and Kanab Creek areas. The City
of Kanab adopted a water conservation plan in 1999 and revised it in 2009. The water conservation
plan addresses past water conservation measures, opportunities to develop and implement
management conservation measures, and short- and long-term goals for efficient water use. The
primary conservation measures of the City of Kanab focus on system efficiency upgrades, education,
well management, and residential water device and landscaping requirement. Conservation efforts
for the KCWCD focus on management of household usage and outside usage via education and rate
structuring, facilitation of water rights transfers and acquisition of new water rights, and
maintenance and system upgrades.

5.1.2 Washington County Water Conservancy District
The WCWCD and its municipal partners have invested over $60 million in recent conservation
efforts. Washington County was the first Utah county to meet the statewide water conservation goal
of reducing per capita water use 25 percent by 2025. In August of 1993, facing rapid population
growth and a limited water supply, WCWCD approved a Water Resource Management,
Development, and Protection Plan, which states, “The District shall develop a water conservation
plan which promotes public education and information dissemination concerning water
conservation; and promotes the adoption of technologies, practices, and devices which will yield
improvements in the efficiency and management of water use.” That same month, the WCWCD
board called on community citizens to form a Water Conservation and Drought Management
Committee. Their efforts resulted in the 1996 Water Conservation Plan, the first of its kind in Utah,
followed by updates in 2005, 2010, and 2015.

WCWCD’s 2015 Water Conservation Plan (WCWCD 2015) includes the following measures:
 • Promotion of universal metering;
 • Secondary water metering;
 • Smart controller irrigation technology;
 • Time of day watering ordinances;
 • Requirement of a water conservation plan for municipal customers;
 • Water efficient landscape workshops;
 • Public information programs/school education;
 • Residential and commercial system water audits, leak detection, and repair;
 • Free outdoor irrigation efficiency audits for residences and businesses;
 • Incentive water conservation pricing;
 • Landscape ordinance requirements;
 • Incentives to reduce irrigated landscape area in new development (water conservation
 easements);

 10
• Full-time water conservation manager;
 • Water conservation demonstration gardens with two full-time horticultural educators;
 • Water Smart irrigation rebate program;
 • Water Smart commercial upgrades equipment rebate;
 • Training and certification of landscape training professionals;
 • Financial incentives for irrigation upgrades;
 • Large landscape conservation programs and incentives;
 • U.S. Environmental Protection Agency WaterSense appliance rebates;
 • Statewide water-wise plant list and tagging program;
 • Public athletic fields conversion to artificial turf grant program;
 • WaterSense toilet/urinal rebates;
 • Multi-family high-efficiency washer rebate program;
 • Funding for local and statewide media campaigns;
 • Horticultural classes, training, and awards;
 • Maximize use of secondary water systems including using wastewater reuse; and
 • Studying and establishing industry standards or practice for use of high salinity water for
 landscape.

The WCWCD periodically monitors the impact of its programs and considers new measures in
response to community changes and technological advancements. The WCWCD’s current
conservation goal is to reduce the 2015 gpcd water use in its service area by 20 percent by 2060.

5.2 Evaluation of Water Use Rates
UDWRe reports M&I water usage rates from around Utah in its yearly M&I Reports (UDWRe
2020c). Total system water use rates in 2015 to 2018 ranged between 301 gpcd and 313 gpcd for
Washington County and 264 gpcd and 473 gpcd for the Kanab/Johnson Creeks sub-basin in Kane
County (UDWRe 2015, 2016, 2017, 2018; see Table 5.2-1 and Table 5.2-2). Water use in an
individual year is dependent on that year’s climate and economic activity, among other factors.

Table 5.2-1 Water Usage Rates (gallons per capita per day) for Kane County, Utah
 Year Residential Potable Total Potable Total Secondary Overall Total
 2015 142 239 65 304
 2016 172 317 156 473
 2017 147 210 68 279
 2018 125 190 74 264
 Average 146.5 239 90.75 330
 2065 water usage rate goal from 2019 Regional Conservation Plan 282
 (UDWRe 2019b)
 2060 water usage rate goal used in this report 283

In 2019, UDWRe published the Regional Conservation Plan in 2019 that provided conservation
goals for each region in Utah (UDWRe 2019b). In that plan, the 2015 baseline water use rate for
Washington County was approximately 302 gallons gpcd and approximately 358 gpcd for Kane
County. The 2065 conservation goal for Washington County was 236 gpcd. WCWCD’s

 11
conservation goal of 20 percent by 2060, or 240 gpcd, is in line with the regional goal and is used in
this purpose and need report. The 2065 conservation goal for Kane County was 282 gpcd. A Kane
County goal of 283 gpcd by 2060 is used in this report.

Table 5.2-2 Water Usage Rates (gallons per capita per day) for Washington County, Utah
 Year Residential Potable Total Potable Total Secondary Overall Total
 2015 179 231 72 303
 2016 177 222 91 313
 2017 177 226 81 307
 2018 168 218 83 301
 Average 175.25 224.25 81.75 306
 2065 water usage rate goal from 2019 Regional Conservation Plan 236
 (UDWRe 2019b)
 2060 water usage rate goal used in this report 240

 Water Demand
Water demand is based on different circumstances for the respective Project Participants’ service
areas.

6.1 Kane County Water Conservancy District
6.1.1 Demographic Projections
The University of Utah Kem C. Gardner Policy Institute provided population projections in 2017
for Kane County through 2060. Baseline projections for Kane County during that time period are
provided in Table 6.1-1.

6.1.2 Future Water Requirements
Estimation of total annual water demand in 2060 for Kane County was based on the following
generalized equation:

 ∗ ∗
 =

The KCWCD does not include a reserve buffer in their water planning.

 12
Table 6.1-1 Future Water Requirements for Kane County Water Conservancy District
 Kane County Percent of Kane County-wide
 Population County residents in GPCD per
 Kanab/Johnson
 ([Gardner Kanab/Johnson Kanab/Johnson State's
 Creek Sub-
 Year Institute Canyon areas (% Creeks Sub- Regional Goals
 basin Demand
 2017] population) taken basin Population (2019 Regional
 (acre-feet)
 estimate and from 2016 LPP Water Conservation
 projection) Needs Assessment (a)
 Plan)
 2015 7,272 0.73 5,309 358 2,129
 2020 8,165 0.73 5,961 340 2,270
 2025 8,684 0.73 6,340 322 2,287
 2030 9,152 0.73 6,681 304 2,275
 2035 9,611 0.73 7,016 297 2,330
 2040 9,910 0.73 7,234 289 2,342
 2045 10,179 0.73 7,430 288 2,394
 2050 10,437 0.73 7,619 286 2,442
 2055 10,736 0.73 7,838 285 2,500
 2060 11,093 0.73 8,098 283 2,571
Note:
(a) UBWR 2016
Key:
GPCD = gallons per capita per day
LPP = Lake Powell Pipeline

6.2 Washington County Water Conservancy District
6.2.1 Demographic Projections
The University of Utah Kem C. Gardner Policy Institute provided population projections in 2017
for Washington County that show dramatic increases (almost threefold) in the population through
2065. Baseline projections for that time period are provided in Table 6.2-1.

6.2.2 Future Water Requirements
Estimating total annual water demand in 2060 for Washington County was based on the following
generalized equation:

 ∗ ∗
 =

Water demand in 2060 must include population projections out to 2075 because the WCWCD
incorporates a 15-year reserve buffer. To estimate the population from 2061 to 2075, a constant rate
of increase of approximately 1.0174 was applied to the previous year’s population projection. This
value was used because it was the rate of increase between 2059 and 2060 (the last year before the
planning period ends) and because it was the lowest rate of population increase from 2020 to 2060,
therefore, representing a conservative estimate.

 13
Table 6.2-1 Future Water Requirements for Washington County Water Conservancy District
 WCWCD Service Area
 GPCD per
 Population - Baseline System loss Demand
 Applied
 Projection (calculated from Applied (acre-feet)
 Year Analysis that
 using the Gardner Analysis with System
 includes 20%
 estimate multiplied by model Loss
 conservation
 UDWRe system ratio)
 2015 151,360 302 0.154 59,038
 2020 182,689 296 0.154 69,791
 2025 214,408 283 0.154 78,483
 2030 246,338 271 0.154 86,370
 2035 280,731 260 0.154 94,289
 2040 314,199 250 0.154 101,326
 2045 348,064 240 0.154 107,999
 2050 383,226 240 0.154 118,909
 2055 420,257 240 0.154 130,399
 2060 458,960 240 0.154 142,408
 2065 500,349 240 0.154 155,250
 2070 545,470 240 0.154 169,251
 2075 594,660 240 0.154 184,513
Key:
GPCD = gallons per capita per day
UDWRe = Utah Division of Water Resources
WCWCD = Washington County Water Conservancy District

 Participant Water Needs
Participant water needs were determined by subtracting the estimated water supply in 2060 from the
estimated water demand in 2060.

7.1 Kane County Water Conservancy District
Estimated future reliable water supply without the LPP surpasses the estimated future demand in
2060, resulting in an estimated surplus of 1,553 acre-feet in 2060 (see Table 7.1-1). This
demonstrates that there is no need for LPP water for KCWCD at this time. Therefore, the Kane
County System portion of the Proposed Project was removed. The 4,000 acre-feet of water that
would have been delivered to the KCWCD service area is now proposed to be sent to Sand Hollow
Reservoir, if needed at full demand. Reclamation has concluded, utilizing the professional expertise
and judgement of the agency’s study team, that the results derived from this report for KCWCD are
reasonable and accurate, given the information, data, and methods available at this time.

 14
Table 7.1-1 Projected Supply Surplus in 2060 for Kane County Water Conservancy District
 KCWCD Reliable KCWCD Supply KCWCD Supply
 KCWCD Demand and
 Annual Water Supply Surplus without LPP Surplus with LPP
 Reserve (acre-feet)
 (acre-feet)(a) (acre-feet) (acre-feet)
 4,123 2,571 1,553 5,553
Note:
(a) Average yield with up to 10% shortage represents reliable yield for KCWCD projects.
Key:
KCWCD = Kane County Water Conservancy District
LPP =Lake Powell Pipeline

7.2 Washington County Water Conservancy District
7.2.1 Projected Shortages in Reliable Yield
The projected shortage, or deficit, in reliable yield for the WCWCD was determined by subtracting
the 2060 reliable annual water supply from the 2060 demand. Depending on the climate change
scenario, the total annual deficit ranged from 112,997 acre-feet to 53,625 acre-feet (see Table 7.2-1).

7.2.2 Lake Powell Pipeline Project Contribution to Reliable Yield
The Proposed Project would directly contribute up to 86,249 acre-feet of water to the WCWCD
service area, with 73,000 acre-feet delivered to Sand Hollow Reservoir and 13,249 acre-feet to Apple
Valley. With potential reuse of LPP water, WCWCD estimates up to approximately 28,830 acre-feet
would be available to meet secondary demands. This reuse supply would not be available without
the Proposed Project. Assuming reuse of all 28,830 acre-feet of LPP water, the LPP would increase
the reliable water supply of WCWCD by 115,079 acre-feet.

Table 7.2-1 Projected Water Supply Deficit in 2060 for Washington County Water Conservancy District
 WCWCD 2060 Reliable Climate WCWCD 2060 WCWCD 2060
 Climate Change
 Annual Water Supply Change Demand and Supply Deficit
 Type
 (acre-feet)(a) Scenario(b) Reserve (acre-feet) (acre-feet)
 71,516 10th 112,997
 Hotter, Drier
 88,022 30th 96,492
 98,727 50th Median 184,513 85,786
 112,196 70th 72,318
 Warmer, Wetter
 130,888 90th 53,625
Notes:
(a) Average yield with up to 10 percent shortage represents reliable yield for WCWCD projects.
(b) Virgin River natural streamflow scenarios provided by Reclamation (2014).
Key:
WCWCD = Washington County Water Conservancy District

 15
Table 7.2-2 Lake Powell Pipeline Contribution to Washington County Water Conservancy District’s
Reliable Water Supply in 2060
 Deficit (-) or Deficit (-) or
 LPP Supply LPP Supply
 Surplus (+) Surplus (+)
 Contribution Contribution
 Climate Climate WCWCD 2060 with LPP with LPP
 without with full
 Change Change Supply Deficit Supply but Supply with
 Reuse of LPP Reuse of LPP
 Scenario(a) Type (acre-feet) no Reuse of full Reuse of
 Water Water
 LPP Water LPP Water
 (acre-feet) (acre-feet)
 (acre-feet) (acre-feet)
 10th Hotter, 112,997 -26,748 2,082
 30th Drier 96,492 -10,243 18,587
 50th Median 85,786 86,249 463 115,079 29,293
 70th Warmer, 72,318 13,931 42,761
 90th Wetter 53,625 32,624 61,454
Note:
(a) Virgin River natural streamflow scenarios provided by Reclamation (2014).
Key:
LPP = Lake Powell Pipeline
WCWCD = Washington County Water Conservancy District

7.2.3 Conclusion
Under warmer, wetter climate change scenarios, the LPP would deliver a surplus of water to the
WCWCD’s service area. However, these scenarios are unlikely according to recent scientific
literature regarding climate change in the Colorado River basin (Udall and Overpeck 2017; Milly and
Dunne 2020). Under the median or hotter, drier climate scenarios and without LPP reuse, the
WCWCD service area would experience a surplus of 463 acre-feet or a deficit ranging from 10,243
acre-feet to 26,748 acre-feet. This should not be interpreted to mean that shortages to residents
would be guaranteed, but rather that the 15-year reserve buffer would not be available in the
majority of years (50th percentile and hotter, drier years). With reuse of all 28,830 acre-feet of LPP
water, the WCWCD service area would experience a small deficit (2,082 acre-feet) or a large surplus
(61,454 acre-feet) depending on the climate change scenario. However, without the Proposed
Project, there would not be an opportunity for reuse of LPP water, therefore, the potential for a
surplus is dependent on the Proposed Project being built.

In sum, the LPP would supply water to the WCWCD service area that would reduce the water
deficits in some scenarios (hotter, drier climate scenarios) and could provide a surplus of water in
other scenarios. Reclamation has concluded, utilizing the professional expertise and judgement of
the agency’s study team, that the results derived from this report for WCWCD are reasonable and
accurate, given the information, data, and methods available at this time.

 16
Purpose and Need Statement
Under median climate change scenarios, approximately 86,000 acre-feet of water will be needed
annually by 2060 to satisfy increased water needs of a growing population in Washington County,
Utah. A more diverse and secure water supply is needed to mitigate vulnerabilities to unexpected
demand and supply scenarios and ensure reliable water deliveries into the future.

 References
Milly, P. C.D. and K.A. Dunne. 2020. “Colorado River flow dwindles as warming-driven loss of
 reflective snow energizes evaporation.” Science 367, 1252-1255. Accessed April 14, 2020.
 https://science.sciencemag.org/content/sci/367/6483/1252.full.pdf

Reclamation. 2014. “Virgin River Climate Change Analysis Statistical Analysis of Streamflow
 Projections.” Technical Memorandum. Katrina Grantz. March 26, 2014.

Udall, Brad and Jonathan Overpeck. 2017. “The twenty-first century Colorado River hot drought
 and implications for the future.” Water Resources Research 53(3):2404. Accessed April 14,
 2020. https://agupubs.onlinelibrary.wiley.com/doi/epdf/10.1002/2016WR019638

University of Utah Kem C. Gardner Policy Institute (Gardner Institute). 2017. Utah’s Long-term
 Demographic and Economic Projections. University of Utah, Salt Lake City, Utah.
Utah Board of Water Resources. 2016. Lake Powell Pipeline Project, Final Water Needs
 Assessment, April 2016.

Utah Board of Water Resources. 2018. Purpose and Need for Action. Lake Powell Pipeline, FERC
 Project No. P-12966, Refinement to Purpose and Need for Action, Public Filing, November
 16, 2018.

Utah Division of Water Resources (UDWRe). 1998. Virgin River Daily Simulation Model. Salt Lake
 City, Utah. April 1998.

Utah Division of Water Resources (UDWRe). 2015. “2015 Municipal and Industrial Water Use
 Report by County.” Accessed April 14, 2020. http://dwre-utahdnr.opendata.arcgis.com/.

Utah Division of Water Resources (UDWRe). 2016. “2016 Municipal and Industrial Water Use
 Report by County.” Accessed April 14, 2020. http://dwre-utahdnr.opendata.arcgis.com/.

Utah Division of Water Resources (UDWRe). 2017. “2017 Municipal and Industrial Water Use
 Report by County.” Accessed April 14, 2020. http://dwre-utahdnr.opendata.arcgis.com/.

Utah Division of Water Resources (UDWRe). 2018. “2018 Municipal and Industrial Water Use
 Report by County.” Purpose and Need. Accessed April 14, 2020. http://dwre-
 utahdnr.opendata.arcgis.com/.

 17
Utah Division of Water Resources (UDWRe). 2019a. Water for Utah, A Review of Duties and
 Funding Programs of the Division and Board of Water Resources. January 2019. “Mission”
 and “Goals” (pg. 4).

Utah Division of Water Resources (UDWRe). 2019b. Utah’s Regional M&I Water Conservation
 Goals. Salt Lake City, Utah. November 2019.
Utah Division of Water Resources (UDWRe). 2020a. Lake Powell Pipeline Plan of Development.
 February 2020.

Utah Division of Water Resources (UDWRe). 2020b. “Mission Statement of the Utah Division of
 Water Resources.” https://water.utah.gov/.

Utah Division of Water Resources (UDWRe). 2020c. Utah’s Open Water Data portal. http://dwre-
 utahdnr.opendata.arcgis.com/.

Washington County Water Conservancy District (WCWCD). 2015. Water Conservation Plan. St.
 George, Utah. Updated December 2015.

 Acronyms
DEIS Draft Environmental Impact Statement
gpcd gallons per capita per day
KCWCD Kane County Water Conservancy District
LPP Lake Powell Pipeline
M&I municipal and industrial
mgd million gallons per day
Project Participants Kane and Washington County Water Conservancy Districts
Reclamation Bureau of Reclamation
UCA Utah Code Annotated
UDWRe Utah Division of Water Resources
VRDSM Virgin River Daily Simulation Model
WCWCD Washington County Water Conservancy District
WWTP Wastewater Treatment Plant

 18
You can also read