Maglev riders would come from the wealthiest 2% of the Baltimore-Washington population
←
→
Page content transcription
If your browser does not render page correctly, please read the page content below
THE MAGLEV REVISITED: PART 4

Maglev riders would come from the wealthiest
2% of the Baltimore-Washington population
A simple calculation suggests that an individual would have to earn
at least $363,000 a year for him or her to find the maglev ticket
price worth the modest reduction in door-to-door travel time

BY OWEN KELL EY (oke lle y@gmu .ed u), MAY 2 , 2021

Common sense tells us that few people would be                described in the present article suggest that no
willing to pay 40 to 80 dollars to save just 8 to 27          more than 4% of workers in the Baltimore-
minutes. If common sense is right, then the                   Washington region earn this much. Two percent
advertised utility of a 17-billion-dollar project             is the most likely figure.
would evaporate. The project in question is the
proposed Baltimore-Washington magnetic-
levitation rail line known as "the maglev." 1
                                                              Background
                                                              The companies that want to build a maglev
    Here are the facts. In January 2021, the
                                                              between Baltimore and Washington are trying to
Federal Railroad Administration published the
                                                              persuade elected officials and the public that the
draft environmental impact statement for the
                                                              proposed maglev is for everyone, not just the rich.
proposed maglev. In this document, the agency
                                                              These companies are Baltimore Washington
stated that maglev customers would save on
                                                              Rapid Rail (BWRR) and its parent company, The
average 8 to 27 minutes of travel time, door to
                                                              Northeast Maglev. On its website, BWRR states
door. The agency also considered various options
                                                              that the maglev would be "highly valued across all
for the maglev's ticket price but settled on $40 to
                                                              travel purposes and income segments." The
$80 in the computer simulation that was used to
                                                              Northeast Maglev's website states that the
forecast how many trips would be made on the
                                                              company is "looking in to innovative ways to make
maglev.2
                                                              the train accessible to all." 3
    Common sense suggests that only a small
                                                                 The question of whether only the wealthy
proportion of the population is wealthy enough to
                                                              would ride the maglev is ignored in the Executive
be willing to pay this much money to save so little
                                                              Summary of the draft environmental impact
time. US Census data and the calculation

1
  $15–17 billion construction cost: DEIS, Appendix D4, Table D4-8, pg. D-21; 8–27 minutes saved travel time:
  Appendix D4, pg. C-6; $40–$80 ticket price: Appendix D2, pg. D-107, D-108.
2
  The DEIS considered a maglev ticket price as low as $27 but determined the official ridership forecast based on a
  $40–$80 ticket price: Appendix D2, pg. D-107, D-108, "Final SCMAGLEV Fare Assumptions" section.
3
  BWRR: https://bwrapidrail.com; TNEM: northeastmaglev.com/.

                                                          1
statement published by the Federal Railroad the draft impact statement is so brief. The draft
Administration. Buried in an appendix is a limp impact statement obtained the 67% figure from a
sentence on this subject: "higher income workers ridership report written by the Louis Berger
would be the most likely to use SCMAGLEV for consulting company, but the public is not allowed
commuting" (Appendix D4, pg. D-81). Then to read that report. Many of the documents that
again, the draft impact statement also contains a underlie the draft impact statement are hidden
sentence that implies that a majority of the from public view. For all we know, even the Louis
region's residents would find the maglev a good Berger report does not adequately explain the
deal: meaning and derivation of the 67%.
The ridership report assumes that about With the air of a farce, the Federal Railroad
70.0 percent of business travelers in the Administration released a heavily redacted copy of
defined catchment area and 67.0 percent of the Louis Berger ridership report toward the end
non-business travelers, which includes those of the public-comment period on the draft impact
making personal trips as well as commuters, statement. The redacted copy is a mere shell,
between Baltimore and Washington, D.C.
completely hiding the numerical data and the text
would choose the SCMAGLEV service if it
that would assist in interpreting the 67% figure
were available. (Chapter 4.6, pg. 4.6-3)
and other aspects of the maglev's ridership
The anticipated SCMAGLEV services are forecast.4
estimated to reduce travel times by 8 to 27
To generate a precise forecast of the fraction
minutes of travel time savings depending on
the trip purpose and length under each of of the population that would make use of a
the Build Alternatives. (Appendix D4, pg. proposed transportation facility, complicated
C-6) analysis of carefully constructed surveys is
required. It may involve mode-choice analysis of
Putting these two quotes together, the draft
stated-preference surveys, to repeat the jargon
impact statement seems to imply that, among the
used in the maglev's draft environmental impact
people whose trip origin and destination are close
statement.5
enough to a maglev station that the maglev would
save them 8 to 27 minutes, 67% of these people But the calculation is much simpler the goal is
would earn enough money that they would be just an upper and lower bound on the fraction of
happy to buy a maglev ticket. If this is the correct the population that would find the travel cost and
interpretation of these two quotes, then the 67% time-savings attractive. This calculation is simple
figure seems too high given that a maglev ticket enough to be performed on a hand-held calculator
would cost $40 to $80 one way. instead of requiring simulation software designed
by a team of experts.6
Complicating matters, it is unclear exactly
what the 67% refers to because its description in
4
Page 48 of Louis Berger (2018 Nov 08) states the 67% figure, according to the DEIS, Chapter 4.6, page 4.6-3,
footnote 9. The FRA released a heavily redacted copy of the Louis Berger report at
bwmaglev.info/index.php/project-documents/deis, on 23 April 2021. The DEIS comment period runs January
through May 24, 2021.
5
Appendix D2, pg. C-105.
6
This topic is discussed in Chapter 12 of Ortuzar and Willumsen (2011).
2The calculation described in the present article Baltimore and Washington is about $7, and this
is this sort of reality check. Mathematical details estimate may be calculated from two numbers.
and supporting data are provided in the appendix Start with the draft impact statement where it
of the present article. states that typical car trips between the two cities
are 39.6-miles long. Multiple that distance by
AAA's estimate of a typical car's per-mile cost for
Serving the 2% gas and maintenance. One could use a somewhat
Before estimating who would ride the maglev, one different value than $7 for the cost of driving and
needs to take care of two preliminaries. First, one the results would be essentially unchanged, as
chooses an estimate for how much a traveler discussed in the appendix of the present paper.8
would be willing to pay to save time. A plausible
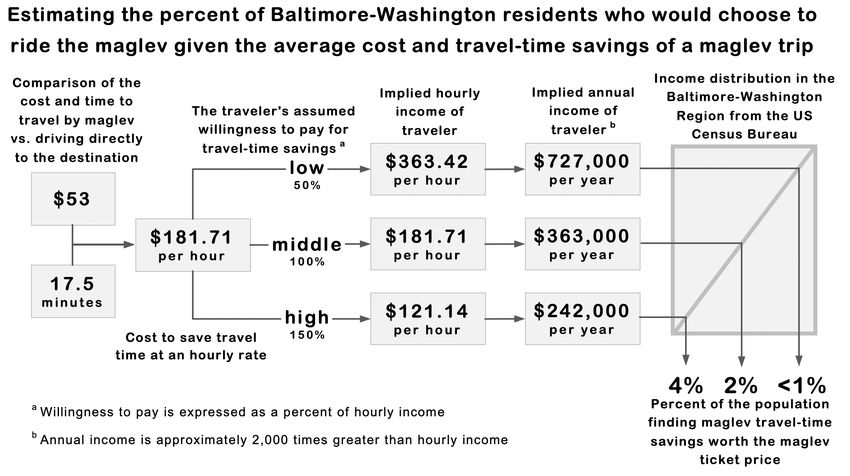
The middle of the above-mentioned range for
approximation is that an individual is willing to
the extra cost to ride the maglev is $53, and the
pay for travel-time savings at a rate similar to the
middle of the time-savings range is 17.5 minutes.
rate at which he or she earns money at his or her
Someone who finds it a fair deal to pay about
job. One variation or other of this idea is
$53 to save about 17.5 minutes would be
encountered in various transportation-modeling
demonstrating a willingness to pay $181.71 per
studies.
hour. Such a person would most likely earn at least
Second, one needs an estimate for the averages
$181.71 per hour, which would mean an annual
of two quantities. These quantities are the price
income of about $363,000. Annual income is
difference and the door-to-door travel-time
about 2,000 times greater than hourly income.9
difference between riding the maglev and driving
The Census Bureau reports that only about 2%
directly to the destination. The maglev would be
of workers in the Baltimore-Washington region
more expensive than driving and, in some cases
earn at least $363,000 a year. We can draw the
faster, depending on the location of the trip origin
conclusion that, for this reason, only about 2% of
and destination. A range for the travel-time
workers would choose to ride the maglev. As
difference is stated in the draft impact statement:
discussed in the appendix of the present article,
8 to 27 minutes. Determining the price difference
only 2 to 3 percent of worker earn $363,000 a year
requires a little math.7
in the Washington area and only 1 to 2 percent in
The price difference would be $33 to $73 for
the Baltimore area do so. Only 1% of US workers
an individual traveling alone, with a family
earn this much, which reduces the chance that the
traveling together considered later. This estimate
average visitor would find the maglev to be a
for an individual traveling alone comes from
prudent way to travel between Baltimore and
taking the $40-to-$80 per-person one-way maglev
Washington.
ticket price that is stated in the draft impact
statement and subtracting the cost of driving. The
per-vehicle cost of driving a car between
7
8–27 minutes saved travel time: Appendix D4, pg. C-6.
8
7.08 = 39.6 · 0.1787; 39.6 mile trip length: Appendix D4, Table D4-59, pg. E-82; $0.1787/mile for medium sedan:
AAA 2020.
9
$182 h -1 = $53 · 60 min. h -1 ÷ 17.5 min.
3Figure 1. A schematic diagram showing a way to estimate the percentage of the population who would
choose to ride the maglev given the average time savings and maglev ticket price. The percent
calculated (approximately 2%) applies to an individual traveling alone, not a family traveling together.
The just-described calculation for an maglev reasonably priced under these conditions.
individual traveler is shown schematically in Fewer than 1% of households earn this much in
Figure 1. the Baltimore-Washington region.
For a family traveling together, the picture is The calculations in the present article have so
even less rosy than for an individual traveling far assumed that people are willing to pay for
alone. With more than one wage earner in many travel-time savings at a rate of 100% of their
families, household income is often greater than hourly income. The next section varies this
individual income, but a family of four would need assumed value of willingness to pay.
four maglev tickets. Few families would think that
it was a good deal to save a few minute on a trip
between Baltimore and Washington by paying
Willingness to Pay
$160–$320 for 4 maglev tickets instead of driving By analyzing many surveys and traffic studies,
and paying about $7 for gas and car maintenance. transportation modelers have found that people
As shown in the appendix of the present article, are typically willing to pay no more than about
annual household income would have to be above 50% to 150% of their hourly income in order to
$1.6 million for a family of four to consider the save an hour of travel time.10
10
The appendix of the present article discusses the use of this rule of thumb in the transportation-modeling field.
4If one varies the traveler's willingness to pay small fraction of possible trips that happen to start
from 50% to 150%, then one arrives at a range and end fairly close to a maglev station.
of incomes at which the individual would see Another approach to estimating the maglev's
the maglev ticket price as worth the travel-time maximum-possible market share is to look at
saved. The lower someone's willingness to pay, commuter data from the US Census. The Census
the higher their income would need to be before Bureau has determined that under 1% of the
the maglev would seem attractive to them. The region's workers commute between Baltimore and
range of incomes is $242,000 and $727,000, as Washington to reach their job. This means that,
worked out in the appendix of the present even if the maglev could somehow capture all of
article. these commuters, it would still be serving only 1%
of the workforce.
If most Baltimore-Washington residents
had a low willingness to pay for travel-time The maglev would arbitrarily and
disproportionally benefit the small fraction of the
savings, it would result in under 1% of
region's wealthy who happen to make frequent
individual workers finding the maglev attractive
trips between downtown Baltimore and
in the Baltimore-Washington region. If most of
Washington and whose trips just happen to start
the region's residents had a high willingness to
and end near maglev stations. The rest of the
pay for travel-time-savings then approximately
wealthy would be poorly served by the maglev.
4% of them would find the maglev an attractive
To put this information together, one might
option. Under no combination of assumptions
say that the maglev serves 1% of the 2%. That is to
would anywhere near a majority of the region's
say, the people who would use the maglev both
residents earn enough that the maglev's travel-
would be rich (2% of the population) and would
time savings would, in their eyes, justify the
also be geographically lucky, i.e., part of the 1% or
maglev ticket price.
so of the region's population who frequently
travels between the two cities. 11
Serving the 2%, Kind of
In a sense, the 2% figure calculated in the present Conclusion
article overstates the market share of the proposed
The people who would ride the proposed
Baltimore-Washington maglev. The unmentioned
Baltimore-Washington maglev would be drawn
issue is that the maglev would serve only a small
from the richest 2% of the region's population.
portion of the region. In an article titled "The
The calculation that supports this prediction has
maglev would serve a small geographic area,"
two steps. In the first step, the concept of
Kelley (2021) showed that the maglev's three
"willingness to pay" is used to estimate the income
stations could save people travel time only on the
that an individual would need before the maglev
11
The 2015 American Commuter Survey (ACS) of the US Census Bureau reported 1.829 million employed people in
the following five jurisdictions: District of Columbia, Alexandria, Arlington County, City of Baltimore, and
Baltimore County. The ACS also reported that 13,087 of these employed people either worked in Baltimore and
lived in Washington or vise versa. See US Census Bureau 2014, 2015. These 5 jurisdictions are, to a first
approximation, the geographic extent of the maglev ridership area as analyzed by Kelley (2021).
5would seem like a good deal to them, given the would want to know if the proposed maglev would
maglev's ticket price and travel-time savings. In serve the region as a whole or if it would only
the second step, the income distribution reported serve a small number of wealthy people lucky
in the US Census is used to determine what enough to be living or working near one of the
percent of the region's population earns this much. three maglev stations.
Someone would have to earn at least $363,000 By remaining largely silent on this question,
a year before the maglev's travel-time savings the Federal Railroad Administration has made it
would seem worth its ticket price. Only 2% of easier for maglev proponents to broadcast their
workers earn this much in the Baltimore- message. Both before and after the draft impact
Washington region. statement was published, the website of Baltimore
Varying a person's willingness to pay for Washington Rapid Rail, the company that wants
travel-time savings would result in a range for the to build the maglev, has claimed that the maglev
minimum income needed for the maglev be an would be "highly valued" by "all income
attractive option: an annual income of $242,000 to segments."
$727,000. Approximately 4% of workers in the
Baltimore-Washington region reach the bottom of Disclaimer
this income range and under 1% reach the top.
This analysis was performed by an area resident,
Broadly speaking, the people who would acting in his capacity as a individual citizen to
choose to ride the maglev would be more than examine a non-partisan issue of interest to the
mere millionaires. They would be earning another public. If errors are suspected, please contact the
million dollars every few years. author at okelley@gmu.edu. Prior installments of
While small, the 2% figure just described this analysis have been published in the Greenbelt
overstates the maglev's market share in one sense. Online blog, https://www.greenbeltonline.org/.
The 2% figure was calculated from the set of
travelers contemplating a certain kind of trip.
Specifically, a trip in which the maglev would save References
them time, door to door, compared to other travel AAA, 2020 Dec. 14: Your Driving Cost: 2020. 8
options like driving directly to their destination. pp., https://newsroom.aaa.com/wp-
But few trips start and end close enough to a content/uploads/2020/12/2020-Your-Driving-
Costs-Brochure-Interactive-FINAL-12-9-20.pdf.
maglev station to fit in this category, as discussed
in the article "The maglev would serve a small Boardman A. E, D. H. Greenberg, A. R. Vining,
geographic area" (Kelley 2021). The maglev does and D. L. Weimer, 2018: Cost-Benefit Analysis:
not always save you time especially if you have to Concepts and Practice. 5th ed., Cambridge Univ.
Press, 594 pp.
drive out of your way to reach the maglev station,
wait for the train, and then find a ride from the EPA, 2019: The 2019 EPA Automotive Trends
final maglev station to your actual destination. Report. 211 pp.,
https://nepis.epa.gov/Exe/ZyPDF.cgi?Dockey=P1
The Federal Railroad Administration has
00YVFS.pdf. Page 5 states the average fuel
mostly avoided the question of what portion of the
economy of 25.1 miles per gallon for new cars.
region's population would make use of the maglev.
One would hope, however, that elected officials
6Federal Railroad Administration, 2021 Jan.: US Census Bureau, 2014: American Community
Baltimore-Washington Superconducting Survey: Design and Methodology. 222 pp.,
MAGLEV Project Draft Environmental Impact https://www2.census.gov/programs-
Statement and Draft Section 4(f) Evaluation. 654 surveys/acs/methodology/design_and_methodolog
pages of text plus 3,053 pages of appendices, y/acs_design_methodology_report_2014.pdf.
https://bwmaglev.info/index.php/project- US Census Bureau, 2015: Table 4, Residence
documents/deis. Use the MacOS terminal MCD/County to Workplace MCD/County
command "mdls -n kMDItemNumberOfPages Commuting Flows for the United States and
*.pdf" to count pages. Puerto Rico Sorted by Workplace Geography: 5-
Gas Buddy, 2021: 120 month average retail price Year ACS, 2011-2015. An Excel spreadsheet for
chart. web page, the entire country with over 594,000 rows. On the
https://www.gasbuddy.com/charts. States the web page titled "2011–2015 5-year ACS
average price per gallon of gas in the US, commuting flows,"
Washington area, and Baltimore area. https://www.census.gov/data/tables/2015/demo/m
Kelley, O. A., 2021 March 25: The maglev would etro-micro/commuting-flows-2015.html.
serve a small geographic area. blog post, Greenbelt US Dept. of Transportation, 2016: The Value of
Online blog, Travel Time Savings: Departmental Guidance for
https://www.greenbeltonline.org/blog-greenbelt- Conducting Economic Evaluations Revision 2
online/. (2016 Update). 26 pp.,
Khattak, A., A. Kanafani, and E. Le Colletter, 1994: https://www.transportation.gov/office-
Stated and reported route diversion behavior: policy/transportation-policy/revised-
Implications on the benefits of ATIS. research departmental-guidance-valuation-travel-time-
report, Institute of Transportation Studies, Univ. economic.
California, Berkeley, ISSN 1055-1425, 36pp., Whittington, D., and J. Cook, 2019: Valuing
https://escholarship.org/uc/item/4fz4h20k. Changes in Time Use in Low- and Middle-
Louis Berger, 2018 Nov. 08: Baltimore-Washington Income Countries. J. Benefit-Cost Analysis, 10,
SCMAGLEV Project Final Ridership Report. As 51–72, doi:10.1017/bca.2018.21. Earlier draft:
of April 2021, this document is unavailable to the Guidelines for Benefit-Cost Analysis, Working
public. Page 48 of this document states the 67% Paper #1, Benefit‐Cost Analysis Reference Case
figure discussed in the present article according to Guidance Project.
the DEIS, Chapter 4.6, page 4.6-3, footnote 9. Willumsen, L., 2014: Better Traffic and Revenue
Meyer, J. R., W. B. Tye, C. Winton, and J. A. Forecasting. Maida Vale Press, 258 pp.
Gomez-Ibanez, 1999: Essays in Transportation
Economics and Policy: A handbook in honor of
John R. Meyer. Brookings Institute Press, Appendix
https://play.google.com/books/reader?id=MFhkeh
This appendix describes Tables 1 and 2. These
z-Ky0C&hl=en&pg=GBS.PA42. Page 42 cites
tables provide evidence for the conclusions drawn
McFadden, Travitie, and associates (1966, pg.
116). by the present article. Table 1 shows the
minimum income that a customer would likely
Ortuzar, J., and L. G., Willumsen, 2011: Modeling
have if they found the maglev ticket price to be
Transportation. 4th ed., Wiley, 586 pp.
worth the limited amount of travel-time savings
7relative to making the trip by car. Table 2 shows A $40-to-$80 ticket price is used in the draft
the income distribution for the region's residents. environmental impact statement (DEIS) to
Taken together, these tables support the forecast the maglev's ridership. In this context,
conclusion that approximately 2% of the region's ridership is defined as how many one-way trips
workers would be wealthy enough to prefer the per year would be made on the maglev in the years
maglev over driving if contemplating a trip that 2030 or 2045.12
would start and end close to one of the three The $7 cost of driving is calculated as follows.
proposed maglev stations. Fuel plus maintenance is $7.08 for a 39.6-mile-
long average trip between Washington and
Defining the Income Equation
Baltimore. The fuel-plus-maintenance cost is the
The following equation calculates the minimum
trip length multiplied by the AAA estimate of
annual income required for someone to find the
$0.1787 for a typical car's per-mile cost for gas
maglev to be an equally good deal as driving
and maintenance (7.08 = 39.6 × 0.1787). Gas alone
directly to the destination given the maglev ticket
would cost only about $3.94. Gas cost may be
price and the limited travel-time savings
calculated based on the trip length, a typical car's
associated with the maglev.
fuel economy of 25.1 mile per gallon, and a fuel
Equation (1) price of $2.50 per gallon (3.94 = 2.50 × 39.6 ÷
25.1). The last section of the present appendix
I = ( 2,000 h y-1 ) c ( 60 min. h-1 ÷ t )
(100% ÷ w ) discusses alternatives to the $7 driving cost that is
estimated in this paragraph.13
In Equation (1), variable I has units of dollars per
The cost difference c in Equation (1) would be
year, and c (dollars) is the cost difference between
greater for a family of four than for an individual
riding the maglev and driving directly to the
traveler because the family would require 4 one-
destination. The amount of travel time saved by
way maglev tickets or could travel together in a
riding the maglev is t (minutes). Variable w
single car. For a family of four, the cost difference
(percent) is the percent of hourly income that a
would be $153 to $313 (i.e., 4 × [40,80] - 7). For
customer is willingness to pay in order to save an
estimating a family's transportation choice when
hour of travel time. The initial factor of 2,000
traveling together, it is plausible to consider their
converts from hourly income to annual income
household income, while for an individual
based on the round numbers of 40-hour
traveling alone, it is plausible to consider his or
workweeks and 50 workweeks per year.
her individual income. At least such assumptions
For an individual traveler, the cost difference c are acceptable when calculating a ballpark estimate
is $33 to $73. This estimate is based on a maglev to double-check the reasonableness of an official
ticket price of $40 to $80 one way per person and ridership forecast.
also based on a $7 cost of making the trip by car
([33,73] = [40,80] - 7).
12
$40–$80 ticket price: Appendix D2, pg. D-107, D-108, "Final SCMAGLEV Fare Assumptions" section.
13
39.6-mile trip length: Appendix D4, Table D4-59, pg. E-82; miles per gallon: EPA 2019; approximate average
dollars per gallon for 2015 to 2021: www.gasbuddy.com; $0.1787/mile for medium sedan: AAA 2020.
8In Equation (1), travel-time saved t is 8 to 27 willing to spend more, 140% of hourly earnings,
minutes, a value stated in the DEIS.14 for travel that is either within office hours or
The quantity w in Equation (1) is known as occurring in heavy congestion.
"willingness to pay" in the transportation- Willingness to pay is a quantity that is used to
modeling field. In this text, w is expressed as the forecast the transportation decision of an
percent of hourly earnings that that represents the individual traveler within a model that forecasts
maximum amount that the customer would be the ridership of a transportation project.
willing to pay in order to save an hour of travel Willingness to pay should not be confused with
time. another quantity that is usually called the "equity
value of time." Confusion is possible, in part,
Willingness to Pay because both quantitates are sometime referred to
Willingness to pay is an empirical guideline that by the same acronym, VTTS, which stands for
the transportation-modeling profession has "value of travel-time saved."
derived by summarizing many transportation
Equity value of time is a quantity that is used
studies.
in cost-benefit analysis. This quantity is used to
Various studies recommend values for calculate the total benefit to society of a
willingness to pay that are typically between 25% transportation solution. Federal regulations
and 140% of hourly earnings. The US Department stipulate that the same dollar value shall be
of Transportation (2016, Table 1, pg. 13) attached to each person's travel time, regardless of
recommends 70% of pre-tax household income for that person's income. For the maglev, the DEIS
commuters traveling on high-speed rail. used $15.20 h-1 or $27.10 h-1 as the equity value of
Whittington and Cook (2017) recommend 25%– time for personal or business travel, respectively.
75% of after tax individual income. Khattak et al. In this context, personal travel is defined as travel
(1993) suggest 50% of income, but state that the outside of office hours.15
percentage becomes much lower (only 10%) if the
Because the maglev tickets would be so
new form of transportation is only a small
expensive, the equity value of time just happens to
improvement over the consumer's current form of
be much lower than the willingness to pay that
transportation. Boardman et al. (2018, pg. 393)
would be demonstrated by people who choose to
suggest 40%–50% of income as the willingness to
ride the maglev (both quantities expressed in units
pay if the travel is enjoyable. Willumsen (2014,
of dollars per hour). There is nothing surprising
pg. 89) suggests 50%–80% for commuting, 50%-
about this occurring, but it is something to keep in
60% for non-work travel, and 110%–130% for
mind to avoid confusion.
travel during work hours. Ortuzar and Willumsen
(2011, pg. 511) suggest that commuting and non- Evaluating the Income Equation
work travel time is valued at 25%-43% of the Equation (1) is evaluated multiple times to create
hourly income of individual full-time workers. Table 1. Table 1 shows the lower bound of
Meyer et al. (1999) suggest that travelers may be someone's income if he or she finds that the
14
8–27 minutes saved travel time: Appendix D4, pg. C-6.
15
See discussion in Chapter 5 of Willumsen (2014) and US DOT (2016); $15.20/h and $27.10/h: Appendix D4: pg.
D-35.
9maglev travel-time savings are worth the maglev US Census Data for Interpreting the
Income Equation's Output
ticket price. The table shows how the income
cutoff varies with cost difference c, travel-time The US Census Bureau reports the distribution of
saved t, and willingness to pay w. individual and household income. Values are
reported for the country as a whole and for smaller
Looking at a middle case for travel-time
areas. The two areas used in the present article are
savings and ticket cost, Table 1 reports that the
called metropolitan statistical areas (MSAs).
lower bound to annual individual income is
Washington and its surrounding suburbs
$727,000, $363,000, and $242,000 for an
constitute an MSA that is separate and not
individual traveling alone who is willing to pay up
overlapping with the MSA that contains the City
to 50%, 100%, or 150% of their individual hourly
of Baltimore and its suburbs.
income to save an hour of travel time.
The Washington MSA has above-average
Table 2 shows that under 1% of workers in the
income compared to the rest of the country. The
Baltimore-Washington region would make the
percentiles are shown in Table 2. For example, 1%
upper income quoted ($727,000/year). Table 2
of Washington-area workers earn at least the
shows that 2%-3% of Washington-area residents
amount stated in Table 2 for the 99th percentile of
and 1%-2% of Baltimore-area residents make the
individual income. The income distribution in the
middle income quoted ($363,000/year). The table
Baltimore MSA is also above the national average,
shows that about 5% and 3% of Washington-area
but not as high as the income distribution in the
residents and Baltimore-area residents,
Washington MSA.
respectfully, make the lower income quoted
($242,000/year). For this reason, the main body of The income percentiles stated in Table 2 were
the present article states an average value of 2% or obtained from the DQYDJ financial blog,
4% for the fraction of workers in the entire region https://dqydj.com/. The DQYDJ blog obtained
whose annual income is over $363,000 or over the data from the IPUMS-CPS research center,
$242,000, respectively. https:/doi.org/10.18128/D030.V8.0. The
IPUMS-CPS research center obtained the data
Now switch from considering an individual
from the US Census Bureau.
traveling alone, and consider a family of four
traveling together. Because the cost of maglev The individual income values listed in Table 2
tickets for a family of four is so much greater than represent pre-tax income per worker, not per
the cost of driving, their household income would capita. The stated value includes income from all
have to be truly extreme for them to choose to ride sources including wages, investments, and
the maglev on a family outing. Table 1 shows that government programs. Workers are included if
the necessary annual household income would be they are at least 16 years old. The data were
approximately $1.6 million. The US Census shows published in 2020, and they refer to income
that less than 1% of Washington-area households earned during the previous year, i.e., the 12
earn this much, as shown in Table 2 and as months from January through December, 2019.
discussed in the next section.
Exaggerating the cost of driving would
not make much difference
While the present article uses $60 for the maglev-
ticket price and $7 for the cost of driving between
10Baltimore and Washington, other sources suggest a high cost to driving between the two cities.
a lower maglev-ticket price and a higher estimate What matters is whatever cost the consumer
of the driving cost. These two possibilities do not perceives for the car trip when that consumer is
alter the conclusions of the present article. choosing among the available transportation
Various hints that maglev tickets would options. Let's be real: driving between Baltimore
occasionally sell for $27 are not relevant to the and Washington costs just a few dollars for gas
maglev's official ridership forecast. The maglev's plus perhaps a few dollars set aside mentally for
draft environmental impact statement (DEIS) future car maintenance. The trip is so short that
states explicitly that it used a $40-to-$80 ticket the needle of your car's gas gauge barely moves.18
price to calculate the ridership forecast.16 Whether the consumer perceives that the cost
It is worth investigating the possibility that the of driving is closer to $7 or $16.24, it doesn't
average consumer may perceive a cost that is change the fact that riding the maglev would be
greater than $7 for making a one-way trip by car financially attractive to only a small number of
between Baltimore and Washington. The DEIS very wealthy people. For example, one can
appears to use a cost of $16.24 for this car trip evaluate Equation (1) using $16.24 for the cost of
when calculating the maglev's official ridership driving and assuming that 83% of hourly income
forecast. The DEIS, however, is vague on this is what the customer is willing to pay for travel-
point. The Northeast Maglev is clear about its time savings. The result of this calculation is the
estimate of the cost of the car trip: $20.38. The same as evaluating Equation (1) using a $7 driving
Northeast Maglev is the parent company of the cost and a willingness to pay of 100% of hourly
company that wants to build the maglev.17 income. Both 83% and 100% are within the
reasonable range of values for willingness to pay,
These arguments miss the point. It does not
as discussed earlier in this appendix. 19
matter that the Federal Railroad Administration
and The Northeast Maglev can find ways to assign
16
$27 ticket price considered and rejected for $40–$80 ticket price: Appendix D2, pg. D-107, D-108, "Final
SCMAGLEV Fare Assumptions" section.
17
$16.24 for 39.6 miles or 0.41 per mile: DEIS, Appendix D4, Table D4-82; pg. D-32; $20.38 for 39.6 miles or 0.56
per mile: The Northeast Maglev Website (24 Apr 2021).
18
A few dollars for gas: appendix of present article.
19
Use $16.24 driving cost and 83% willingness to pay in Eq. (1) of the appendix of the present article to obtain
$357,000 = 2,000 h y-1 × {$60 - $16.24} × (60 min. h -1 ÷ 17.5 min) × (100% ÷ 83%). This is essentially the same value
as the $363,000 when a $7 driving cost and 100% willingness to pay was used earlier in the appendix.
11Table 1. The cost of maglev-related travel-time savings (r, dollars per hour) and the income (I, dollars
per year) of someone willing to pay that rate to save travel time. The incomes listed in the rightmost
three columns are calculated using Equation (1) of the present article.
Characteristics of a maglev trip, The traveler's minimum annual income for
compared to driving different values of willingness to pay, w d
Cost Travel-time Cost per
b
difference, c saved, t hour, r c w = 50% w = 100% w = 150%
Individual, traveling alone
worst case a $73 8 minutes $548 h-1 $2.2 million $1.1 million $730,000
middle case $53 17.5 minutes $182 h-1 $727,000 $363,000 $242,000
best case a $33 27 minutes $73 h-1 $293,000 $147,000 98,000
Family of four, traveling together
worst case $313 8 minutes $2,348 h-1 $9.4 million $4.7 million $3.1 million
middle case $233 17.5 minutes $799 h-1 $3.2 million $1.6 million $1.1 million
best case $153 27 minutes $340 h-1 $1.3 million $680,000 $453,000
a
The worse and best case refer to cases when the maglev is least or most attractive to travelers
considering ticket price and the amount of travel-time saved.
b
Excess cost per trip is the maglev price (the individual ticket price multiplied by the number of
travelers) minus the $7 per-vehicle cost of driving between Baltimore and Washington, as discussed
in the present appendix.
c
Cost per hour of travel-time saved is calculated as c (60 min h-1 ÷ t ), using the values for c and t in
the two columns to the left.
d
Willingness to pay is the maximum amount of money that a traveler would be willing to pay to save
travel time, expressed as a percent of the traveler's hourly income. The incomes stated in the
rightmost three columns of this table are intended to represent the individual income of an individual
traveling alone or the household income of a family traveling together.
12Table 2. Annual income percentiles for individual workers and households in the Washington
Metropolitan Statistical Area (MSA), the Baltimore MSA, and the entire United States.a
Washington MSA Baltimore MSA United States
Percentile Individual b Household Individual b Household Individual b Household
99th $641,000 $910,000 $440,000 $654,000 $363,000 $531,000
98th $408,000 $660,000 $266,000 $446,000 $257,000 $387,000
97th $296,000 $522,000 $220,000 $345,000 $217,000 $329,000
95th $238,000 $387,000 $178,000 $266,000 $176,000 $270,000
92nd $197,000 $324,000 $149,000 $237,000 $140,000 $221,000
90th $175,000 $302,000 $135,000 $229,000 $125,000 $201,000
85th $149,000 $257,000 $116,000 $192,000 $101,000 $166,000
80th $131,000 $220,000 $100,000 $169,000 $86,000 $142,000
75th $113,000 $199,000 $90,000 $146,000 $75,000 $124,000
50th $64,000 $121,000 $51,000 $88,000 $44,000 $68,000
25th $30,000 $62,000 $25,000 $43,000 $23,000 $34,000
10th $11,000 $32,000 $10,000 $20,000 $9,000 $16,000
a
These statistics were published in 2020, and they represent the income reported for the prior 12
months, i.e., January through December, 2019. The data in the table were obtained from the
DQYDJ investment blog (https://dqydj.com/income-by-city/) for the Washington and Baltimore
MSAs. The statistics for US households were taken from https://dqydj.com/household-income-
percentile-calculator/, and for US individual workers from https://dqydj.com/individual-income-by-
year/. The DQYDJ blog obtain the data from the IPUMS-CPS research center
(https:/doi.org/10.18128/D030.V8.0). The ultimate source of the data is the US Census Bureau.
b
Individual means "per worker," not per capita.
13You can also read