Database Systems on Virtual Machines: How Much do You Lose?
←
→
Page content transcription
If your browser does not render page correctly, please read the page content below
Database Systems on Virtual Machines: How Much do You Lose?

   Umar Farooq Minhas                      Jitendra Yadav                  Ashraf Aboulnaga                  Kenneth Salem
   University of Waterloo                    IIT Kanpur∗                  University of Waterloo          University of Waterloo

                            Abstract                                         the same physical machine while providing them with a
                                                                             guaranteed share of the resources of this machine [13]. This
   Virtual machine technologies offer simple and practical                   server consolidation is already widely used by many en-
mechanisms to address many manageability problems in                         terprises and service providers, since it reduces the num-
database systems. For example, these technologies allow                      ber of servers required by an organization, which also re-
for server consolidation, easier deployment, and more flex-                  duces space, power, and cooling requirements. We could
ible provisioning. Therefore, database systems are increas-                  also use the VMM to change the resource allocation to a
ingly being run on virtual machines. This offers many op-                    database system in response to fluctuations in the work-
portunities for researchers in self-managing database sys-                   load. As another example, we could use virtualization to
tems, but it is also important to understand the cost of virtu-              simplify deploying database systems by providing VM im-
alization. In this paper, we present an experimental study of                ages (i.e., suspended and saved VMs) with pre-installed and
the overhead of running a database workload on a virtual                     pre-configured database systems. In this case, deploying a
machine. We show that the average overhead is less than                      database system is simply a matter of starting a VM from
10%, and we present details of the different causes of this                  the saved VM image. Such pre-configured VM images are
overhead. Our study shows that the manageability benefits                    known as virtual appliances and are increasingly being used
of virtualization come at an acceptable cost.                                as a model for software deployment [16].
                                                                                These are but a few examples of the benefits that vir-
1. Introduction                                                              tual machine technologies can provide to database systems
    Virtual machine technologies are increasingly being                      and other software systems. These benefits are widely rec-
used to improve the manageability of software systems,                       ognized in the IT industry, which has led to users adopt-
including database systems, and lower their total cost of                    ing virtual machine technologies at an increasing rate, and
ownership. These technologies add a flexible and pro-                        to hardware and software vendors providing new features
grammable layer of software, the virtual machine monitor                     aimed specifically at improving support for virtualization.
(VMM), between software systems and the computing re-                        However, the benefits of virtualization come at a cost since
sources (such as CPU and disk) that they use. The VMM                        virtualization adds performance overhead. Our goal in this
allows users to define virtual machines (VMs) that have in-                  paper is to quantify this overhead for database systems. We
dependent operating systems and can run different software,                  ask the question: How much performance do we lose by
and it guarantees that these VMs will be isolated from each                  running a database system in a virtual machine? What is
other: Faults in one VM will not affect other VMs, and                       the cost of the manageability benefits of virtualization?
the performance of a VM will not be affected by the ac-                         To answer this question, we present a detailed exper-
tivity in other VMs. The VMM also adds flexibility to the                    imental study of the performance of the TPC-H bench-
computing environment by providing capabilities such as                      mark [15] on PostgreSQL. We compare the performance on
dynamically changing the resource allocation to different                    Linux without virtualization to the performance in a VM
VMs, suspending and resuming VMs, and migrating VMs                          using the Xen hypervisor [18], currently one of the most
among physical machines.                                                     popular VMMs. We show that the average overhead is less
    By running database systems in VMs and exploiting the                    than 10% and we report details on the nature and causes of
flexibility provided by the VMM, we can address many                         this overhead. We view this as an encouraging result, since
of the provisioning and tuning problems faced by self-                       it means that the benefits of virtualization do not come at
managing database systems. For example, we can allow                         a high cost. Ours is not the first study to report the over-
many different database systems running in VMs to share                      head of virtualization [1, 12]. However, to the best of our
  ∗ Work done while the author was a summer intern at the University of      knowledge, we are the first to provide a detailed study of
Waterloo.                                                                    this overhead for database systems.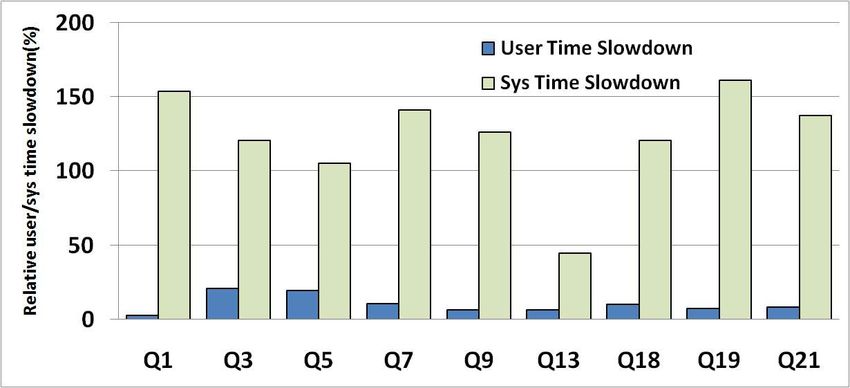
The rest of this paper is organized as follows. In Sec-       and DomU run the same version of Linux as the Base sys-
tion 2 we present an overview of related work. Section 3         tem, and their file systems are also ReiserFS. In addition to
describes our experimental setup, and Section 4 reports our      the operating system, the DomU file system contains Post-
experimental results. Section 5 concludes.                       greSQL and the test database. Dom0 and DomU use one
                                                                 virtual CPU each, and these virtual CPUs are mapped to
2. Related Work                                                  different physical CPUs on the machine, which ensures that
                                                                 Dom0 has enough resources to do its work without throt-
    There has recently been an increasing interest in virtual-   tling DomU or competing with it for resources. We refer to
ization technologies [1, 17]. Virtualization provides flexi-     this system in our experiments as the Xen system.
bility and improved manageability by enhancing availabil-            For our database system, we use PostgreSQL 8.1.3,
ity [3], performance isolation [5], security [4], memory         which we refer to simply as Postgres. The workload we
management, and control of resources [11].                       use for our experiments is the OSDL implementation of
    In this paper, we focus on the Xen VMM [18]. Xen was         the TPC-H benchmark [10], with scale factor 1 (i.e., 1GB).
proposed in [1], where the authors provide a comparative         We use the 22 queries of the benchmark, and not the up-
performance evaluation against base Linux (with no virtu-        date streams. This benchmark implementation is optimized
alization), the VMWare VMM [17], and User Mode Linux.            for Postgres and utilizes several indexes to improve perfor-
Using a variety of benchmarks, including database bench-         mance. The total size of the database on disk, including all
marks, they show that the overhead of Xen is quite small         tables and indexes, is 2GB. We set the Postgres buffer pool
compared to these other platforms. Their results are inde-       size (the shared buffer parameter) to 2GB, ensuring
pendently reproduced in [2].                                     that we can fit the entire database in memory in our warm
    In a more recent study, Padala et al. [12] provide an        buffer pool experiments. All the other Postgres configura-
evaluation of the performance of the Xen and OpenVZ vir-         tion parameters are left at their default values. Postgres was
tualization platforms for server consolidation. They use         identically configured for the Base and Xen systems. The
multi-tier applications that run on a web server and database    Postgres client and server are both run on the same machine,
server, and they report that the performance overhead for the    and in the same domain for Xen (DomU). The client adds a
database server is small for both virtualization platforms.      negligible overhead to the machine, consuming well below
    Gupta et al. [6] present XenMon, a performance moni-         1% of the CPU and very little memory.
toring tool for Xen. Using XenMon, they study the perfor-            For our experiments, we run the 22 benchmark queries
mance of a web server running in a Xen VM. In a similar          in identical settings on the Base and Xen systems, and we
study, Menon et al. [8] present Xenoprof, a toolkit to facil-    compare the performance of these two systems. Our perfor-
itate system-wide statistical profiling of a Xen system. The     mance measurements use Linux tools that are not Xen spe-
authors use Xenoprof to analyze the performance overhead         cific, so we use the same tools and measurement method-
of running a networking application on Xen.                      ology for both systems. We conducted two different sets
    These papers all study the performance overhead of Xen       of experiments to measure the Xen overhead for different
virtualization, but none of them provides a detailed study of    cases. In the warm experiments, the Linux file system cache
this performance overhead for database systems.                  and the Postgres buffer pool are warmed up before we do
                                                                 the measurement, and in the cold experiments we start with
3. Experimental Testbed                                          cold file system caches and buffer pool. For all our mea-
                                                                 surements, we repeat the experiment five times and report
    We use two identical machines for our experiments, one
                                                                 the average measurement obtained from these five runs. The
with Linux without virtualization and one with Xen virtu-
                                                                 variance in our measurements was very low in all cases.
alization. The machines are Sun Fire X4100 x64 servers,
each with two 2.2GHz AMD Opteron Model 275 dual core
processors, 8GB memory, and two 73GB SCSI 10K RPM                4. Experimental Results
drives. Our Linux system without virtualization runs SUSE        4.1. Warm Experiments
Linux 10.1 with version 2.6.18 of the kernel and the Reis-
erFS file system. We refer to this system as the Base system.       For these experiments, we run the 22 TPC-H queries
    Our Xen system uses Xen 3.1, the latest release of Xen       once to warm up the buffer pool and file system cache,
at the time of this writing. Xen uses a special VM (a do-        then we run them again and measure their performance.
main in Xen terminology) to control other VMs. This con-         Table 1 presents the run time reported by Postgres for
trol domain is known as Dom0, and we allocate it 4GB of          each query in the Base and Xen systems. The table also
memory. We create a single VM (DomU) for running the             shows the absolute slowdown, defined as (XenRunT ime−
database system, and we give it 3GB of memory and a sin-         BaseRunT ime), and the relative slowdown, defined as
gle 10GB virtual disk mounted as a file in Dom0. Dom0            (XenRunT ime − BaseRunT ime)/BaseRunT ime.
Base Xen Abs Rel
Runtime Runtime SlwDwn SlwDwn
(secs) (secs) (secs) (%)
Q1 14.19 15.30 1.11 7.82
Q2 0.12 0.17 0.05 40.39
Q3 5.20 6.98 1.78 34.35
Q4 0.74 1.07 0.33 44.00
Q5 4.53 5.99 1.46 32.21
Q6 1.40 2.12 0.73 52.03
Q7 4.09 5.32 1.23 30.14
Q8 1.39 1.98 0.59 42.05
Q9 10.99 12.81 1.81 16.49
Q10 5.04 6.36 1.32 26.17 Figure 1. Slowdown: User vs. system time.
Q11 0.78 0.94 0.16 20.82
Q12 1.85 2.73 0.88 47.32
Q13 14.02 15.27 1.25 8.93 4.1.1 System Call Time
Q14 0.66 0.90 0.24 37.12
It is expected that system calls will be slower in the Xen sys-
Q15 1.24 1.66 0.42 34.32
Q16 1.89 2.18 0.29 15.17 tem than the Base system. The way Xen is designed, many
Q17 0.39 0.47 0.08 19.45 system calls have to go through the Xen hypervisor (which
Q18 9.38 11.54 2.17 23.12 is why Xen virtualization is called para-virtualization). In
Q19 5.26 6.33 1.07 20.41 the Base system, system calls are directly handled by the
Q20 0.59 0.94 0.35 60.03
Q21 2.79 3.65 0.86 31.03
operating system. A longer system time can therefore be
Q22 1.59 1.70 0.10 6.58 attributed to a longer execution path for system calls inside
Xen. In this section, we are interested to know: (a) How
Table 1. Overhead: Base vs. Xen.
much slower are system calls in Xen?, and (b) How much
of the overhead of virtualization can be attributed to slow-
The table shows that most queries experience a fairly down in system calls?
large overhead when moving from the Base system to Xen, With a focus on these questions, we use the strace
as indicated by the relative slowdown. We focus next on tool to collect the number of system calls made by
explaining this overhead. In the interest of space, we only each query (more precisely, by the Postgres process ex-
present results for the ten queries whose run time in the Base ecuting the query) and the time to serve these sys-
system in Table 1 exceeds 2 seconds. The results for the tem calls. Table 2 presents these results for the
other queries are similar, and can be found in [9]. ten selected TPC-H queries in the Base and Xen sys-
tems. The table also presents the relative slowdown in
In order to get an insight into the cause of the overhead,
serving system calls, defined as (XenSysCallT ime −
we use the mpstat tool to break down the overall run time
BaseSysCallT ime)/BaseSysCallT ime.
of each query into user time and system time. Figure 1
shows the relative slowdown (defined similarly to Table 1) As expected, the total time to serve system calls is higher
in user and system time for the ten selected queries.We can inside Xen, increasing up to 871% compared to the Base
see that both the user time and the system time of almost system (except for Q13). Also as expected, the number
all queries experience slowdown in Xen compared to Base. of system calls in the Base and Xen systems is very sim-
However, the slowdown in user time is very small compared ilar since the program behavior of Postgres does not change
to the slowdown in system time. This is expected since Xen when it is run in a VM. The strace tool consistently re-
adds overhead to system level operations and does not af- ports a small difference between Base and Xen of around 15
fect user level operations. User level code only experiences system calls. Most importantly, we note that for all queries,
a minor slowdown that has been attributed in previous stud- system call time is a minor fraction of the total system time.
ies to the increased number of CPU cache misses under Thus, while system calls in Xen are significantly slower
Xen [12], since the Xen code and data compete for CPU than the Base system, this is not a major cause of slowdown
cache with user code and data. On the other hand, the slow- for database queries, since these queries do not spend that
down in system time is quite significant (up to 154%) and much time on system calls. We next look into the second
can explain the run time overhead of Xen. So we focus next component of system time: time to handle page faults.
on the question: Where does the slowdown in system time 4.1.2 Page Fault Handling Time
come from? For these queries, system time is attributable
to either system calls or page fault handling. We look into A page fault is an exception generated by hardware when
these two components next. the memory page accessed by the current instruction has
not been loaded into physical memory (a major page fault),
or has been loaded into memory for some other process butBase Xen Rel
Number SysCall System Number SysCall System SysCall
of Time Time of Time Time Time
SysCalls (ms) (ms) SysCalls (ms) (ms) SlwDwn
(%)
Q1 112 0.02 390.34 95 0.03 989.80 82.05
Q3 226 0.40 568.66 209 3.92 1253.02 871.44
Q5 204 0.13 557.38 188 0.42 1144.08 225.51
Q7 221 0.92 536.52 205 5.47 1294.16 491.20
Q9 348943 4.19 782.34 348926 11.45 1768.40 173.35
Q10 224 1.34 542.92 206 6.09 1219.52 353.00
Q13 34974 59.92 751.00 34957 34.92 1085.00 -41.73
Q18 308 16.97 962.12 291 65.89 2123.12 288.34
Q19 149 0.91 392.10 132 2.87 1023.72 215.08
Q21 579 0.02 451.40 562 0.05 1072.00 203.45
Table 2. System Call Time.
Base Xen Page Faults Rel this correlation, Table 3 is sorted by the number of page
Page Faults Page Faults per SlwDwn
Second (%) faults per second. This important conclusion establishes the
Q21 272679 272655 74700 31.03 fact that page faults are a major cause of database system
Q7 351018 350303 65817 30.14 slowdown in Xen.
Q5 343477 342106 57136 32.21 We investigated the reason behind the page faults and
Q10 344395 340994 53593 26.17 found that the majority of them are caused by accesses to
Q3 370884 368685 52814 34.35
database pages in the shared buffer cache of Postgres. Like
Q19 288348 286636 45261 20.41
Q18 476445 473605 41029 23.12 many database systems, Postgres uses worker processes,
Q9 364944 362777 28326 16.49 known as postmaster processes, to execute user queries,
Q1 270281 269217 17594 7.82 and they all use one shared buffer cache for database pages.
Q13 98128 97738 6400 8.93 When a postmaster process accesses a database page
Table 3. Page Fault Handling: Base vs. Xen. (from a table or index), this page may already be in the
shared buffer cache, but the memory pages in which this
is not mapped to the address space of the faulting process database page resides may not be mapped to the address
(a minor page fault). Page fault handling is a significant space of the process. The process needs to map these pages
source of complexity for VMMs, including the Xen hyper- to its address space, which causes minor page faults.
visor, so it is important to study their contribution to the ob- This discussion implies that it takes longer to handle a
served overhead. To do so, we measure the number of page page fault in Xen than in the Base system. To verify this,
faults generated by each query, and we attempt to establish we measure the time to handle a page fault in the Base and
a relationship between slowdown and page faults. Xen systems using the lmbench tool kit [7]. The results
In our experiments we only observe minor page faults. indicate that it takes 1.67µs and 3.5µs to handle a page fault
Our settings are chosen such that all pages required by the in the Base and Xen systems, respectively. This direct mea-
queries can fit into physical memory and are loaded in the surement shows that page faults in Xen are more than twice
warmup phase, thus avoiding major page faults. Minor page as expensive as they are in the Base system.
faults, on the other hand, can arise due to sharing of code Since the page fault rate (page faults per second) is
and data pages between processes. strongly correlated to overhead, page fault handling is likely
We use the sar tool to measure the number of page the major source of overhead for Xen. We turn our attention
faults by each query, and we report the results in Table 3. next to reducing this overhead.
The table also shows the relative slowdown of the queries 4.1.3 Reducing Page Fault Overhead
(from Table 1). The number of page faults by each query To reduce page fault overhead, we attempt to reduce
shows a slight variation between Base and Xen but this is the number of minor page faults that happen when a
not significant. The important observation is that there is postmaster process maps pages from the shared buffer
a strong correlation between relative slowdown and page cache to its own process space. The key to reducing these
faults per second, which is also shown in the table and is page faults is to realize that they only happen the first time
defined as the number of page faults generated in Xen di- the process touches a memory page from the shared buffer
vided by the total run time of the query in Xen. In general, cache. Once a page is mapped to the address space of
if a query has a higher number of page faults per second, it a postmaster process, the process can reuse this page
will incur a higher run time overhead in Xen. To highlight without faulting.Base Xen Abs Rel
Runtime Runtime SlwDwn SlwDwn
(secs) (secs) (secs) (%)
Q1 13.3 14.04 0.74 5.55
Q3 4.61 5.82 1.21 26.23
Q5 4.14 4.97 0.84 20.22
Q7 3.52 3.66 0.14 3.91
Q9 10.52 11.36 0.83 7.91
Q10 4.57 4.69 0.12 2.58
Q13 13.36 14.1 0.75 5.59
Q18 8.86 10.13 1.27 14.36
Q19 4.84 5.05 0.22 4.46 Figure 2. Page Faults for Single Connection.
Q21 2.3 2.48 0.18 7.84
Table 4. Overhead for Single Connection. virtualization introduces new types of overheads, and that
there may be simple ways to reduce these overheads.
In the previous experiments, each query is individu- The average relative slowdown of the 22 TPC-H queries
ally run from the command line using the pgsql Post- using one database connection is only 9.8%. This can be
gres client, which means that there is a different client pro- further reduced by using newer server CPUs that have hard-
cess and a different database connection for each query. In ware support for virtualization and include features that en-
the Postgres architecture, whenever a new connection to able, for example, faster page fault handling. The CPUs of
the database is initiated, the master server process spawns the machines that we use in our experiments do not have
a child worker process (a postmaster process) that is this support, so the 9.8% can be viewed as a worst case per-
responsible for handling requests on the new connection. formance overhead that can likely be improved.
This means that in our case each query runs in a new
postmaster process, which needs to map the buffer pool
4.2. Cold Experiments
pages it uses to its address space. Each query thus causes Next, we turn our attention to the case where the queries
a large number of minor page faults. To reduce the number run on a cold database. For this set of experiments, we
of page faults, we repeat the experiments in Section 4.1, but restart Postgres and flush the Linux file system caches in
we run all queries in one pgsql client, using one database both DomU (the Postgres VM) and Dom0 (the control VM)
connection and one postmaster process. before running each query. This ensures that all data re-
Table 4 presents the overhead in this case for the ten se- quired by a query is read from disk, thereby bringing an
lected queries. In this new setting, the overall run time of all important (and usually very costly) factor into play, namely
queries decreases in both Base and Xen. More importantly, physical disk I/O. It is generally accepted that Xen adds a
the absolute and relative slowdown values are also lower high overhead to the I/O path. In Xen, every I/O request in
compared to Table 1. The decrease in run time is due to a DomU is forwarded to Dom0 where it is serviced. Data that
significant decrease in system time, which in turn is due to is read (or written) by Dom0 is copied to (or from) DomU.
a reduction in the number of page faults. Other components This is a complex process, so we expect to see larger slow-
of run time are not significantly affected. downs in this experiment.
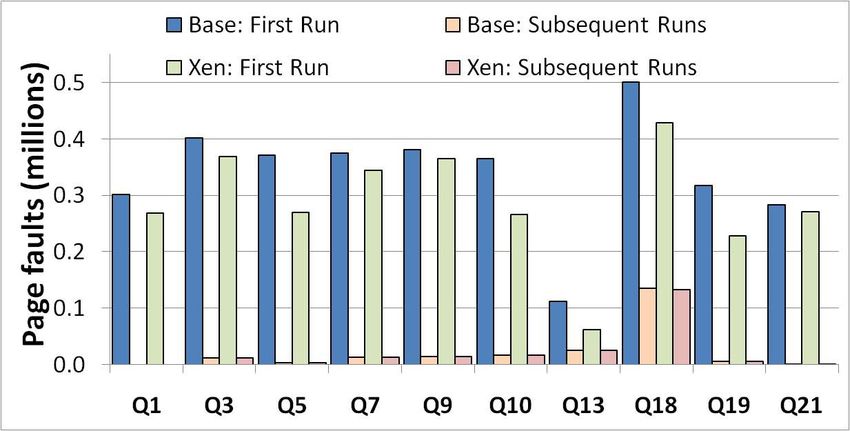
To verify that the number of page faults is indeed re- We perform cold runs of the 22 TPC-H queries in the
duced, we conduct an experiment in which we establish a Base and Xen systems. Table 5 reports the run time of each
database connection and run the same query multiple times query in both cases and the slowdown between Base and
on this connection, measuring the number of page faults in Xen. Surprisingly, the slowdown numbers are not high. The
each run. Figure 2 presents the results for the ten longest I/O path in Xen is not as slow as commonly believed, and
running TPC-H queries. The number of page faults in the the cost of virtualization is low even in the cold case.
second and later runs of each query is almost identical, and We obtain the run time break down of these queries as
is a lot smaller than the number of page faults in the first run. in the warm case. In these runs, system call and page fault
After the first run, the required pages from the shared buffer numbers are unchanged from the warm case, but they rep-
cache are mapped to the address space of the postmaster resent a small fraction of query run time. As expected, most
process and can be used without faulting. of the run time of these queries is spent in the iowait
state, waiting for disk I/O. On average, the queries spend
Using one database connection for all queries is a fairly 77% and 79% of their run time in the Base and Xen sys-
simple way to reduce the overhead of virtualization. In- tems, respectively, waiting for disk I/O. In the warm case,
deed, many applications do use one connection for all their query run time did not have an iowait component.
queries, so these experiments do not suggest a new way of What is surprising and rather counter-intuitive in the re-
writing database applications. However, they do show that sults is that some queries run faster in Xen than in the BaseBase Xen Abs Rel it. In particular, prefetching requests made by the DomU
Runtime Runtime SlwDwn SlwDwn
(secs) (secs) (secs) (%) file system cause larger amounts of data to be prefetched in
Q1 22.12 22.09 -0.04 -0.17 Dom0. If we turn the Linux prefetching mechanism off in
Q2 2.14 2.25 0.11 5.17 DomU, the amount of data read is very close to the actual
Q3 26.48 29.88 3.39 12.81 data required by the queries and the queries no longer run
Q4 59.62 46.07 -13.55 -22.73 faster inside Xen. More details are available in [9].
Q5 24.24 27.89 3.66 15.08
Q6 19.86 22.57 2.71 13.62
Q7 25.28 28.89 3.61 14.28 The point of this experiment is not to suggest using vir-
Q8 171.19 178.42 7.23 4.22
tualization to implement prefetching. Instead, the experi-
Q9 798.9 776.21 -22.69 -2.84
Q10 24.00 28.14 4.14 17.25 ment is meant to illustrate that virtualization does not cost
Q11 3.11 3.81 0.70 22.35 much even for the cold case. The queries that are slower in
Q12 51.46 43.92 -7.54 -14.65 Xen experience an average slowdown of 12.2%, and those
Q13 17.10 18.01 0.91 5.35 that are faster in Xen experience an average “slowdown” of
Q14 20.18 24.06 3.89 19.27
-9.6%. Overall, the average slowdown for all 22 TPC-H
Q15 20.09 22.94 2.85 14.17
Q16 6.94 7.83 0.89 12.81 queries is 6.2%. As in the warm case, these numbers are for
Q17 29.45 31.83 2.38 8.08 a simple system that is not highly optimized. Optimizations
Q18 26.88 31.46 4.58 17.03 such as using raw disk in Dom0 for the DomU virtual disk
Q19 20.67 23.13 2.45 11.87 can improve performance, so this overhead can be viewed
Q20 277.16 280.71 3.56 1.28
Q21 623.30 612.61 -10.69 -1.71
as a worst case overhead that can likely be further improved.
Q22 26.00 22.03 -3.97 -15.26
Table 5. Overhead for Cold Runs. 5. Conclusion
system. In our final experiment, we try to explain why this There are many advantages to running a database sys-
interesting effect happens. We use the iostat tool to mea- tem in a virtual machine. In this paper, we demonstrate that
sure the amount of data read from the database disk by each these advantages do not come at a high cost in performance.
query. For the Base system, we only need to monitor the Using a TPC-H workload running on Postgres in a Xen vir-
physical disk storing the database. However, for the Xen tual machine environment, we show that Xen does indeed
system we need to monitor both the physical disk accessed introduce overhead for system calls, page fault handling,
by Dom0 and the virtual disk inside DomU. and disk I/O. However, these overheads do not translate to
a high overhead in query execution time. System calls and
Table 6 presents the amount of data read in each case
page faults represent a minor fraction of the run time of a
and the iowait time in the Base system and in DomU. It
query. Disk I/O is a significant fraction of run time in the
is clear that for the queries that run faster inside Xen, the
cold case, but it is not slowed down by much, and it can
I/O wait time is less than the Base system. The speedup of
sometimes be taken off the critical path. Our hope is that
these queries can be entirely attributed to this reduction in
these findings will encourage further research in the area of
I/O wait time. Fortunately, this reduction can be explained
virtualization and self-managing database systems.
easily by looking at the amount of data read by each query.
The Base system and DomU read almost the same amount Possible directions for future work include measur-
of data. This is expected since Postgres is accessing the ing the performance overhead of virtualization for other
same data in both cases. However, if we look at the amount database workloads with different applications and resource
of data read in Dom0, we find that for the faster queries, demands. For example, we could use TPC-C [14] or other
Dom0 reads a lot more data than required by DomU. OLTP workloads. Since OLTP workloads have different
For these queries, Dom0 is aggressively prefetching data characteristics (e.g., more updates), the results may be dif-
based on the disk access pattern of DomU. This causes more ferent. Additionally, we could evaluate different virtual-
data than necessary to be read from disk, but it helps perfor- ization environments such as OpenVZ, VMWare, and User
mance by removing I/O from the critical path of query ex- Mode Linux specifically for database workloads. We could
ecution and hence reducing I/O wait times. To explain the also evaluate different database systems such as MySQL,
cause of this prefetching, we note that the Dom0 file sys- Oracle, and DB2. A very interesting direction for future
tem sees the DomU disk as one large file. Reads in DomU work is to conduct a study with multiple workloads running
due to Postgres read requests and prefetching requests from concurrently on different VMs sharing the same physical
the DomU file system are all translated to reads on this one machine. This would allow us to investigate the effect of in-
file in Dom0. This causes the file system in Dom0 to see terference among workloads on performance, and to study
many reads on this file, and to prefetch aggressively from how well the VMM isolates the performance of the different
workloads from each other.Base Xen
Data Read IOWait Dom0 Data DomU Data IOWait
(MB) (secs) (MB) (MB) (secs)
Q1 1040 6.27 1045 1040 6.23
Q2 41 1.93 43 41 2.04
Q3 1386 17.73 1392 1385 23.05
Q4 920 56.16 1347 920 44.6
Q5 1311 16.63 1318 1311 18.13
Q6 1056 15.87 1062 1056 20.58
Q7 1342 17.46 1349 1342 23.58
Q8 623 166.99 955 623 174.34
Q9 1512 778.41 2660 1511 759.66
Q10 1308 16.2 1315 1308 17.93
Q11 145 2.15 147 145 2.96
Q12 1302 46.53 1325 1302 40.24
Q13 269 3.60 271 269 1.79
Q14 539 17.81 998 539 23.00
Q15 871 16.68 1047 871 21.09
Q16 205 4.80 207 205 6.36
Q17 90 28.71 162 90 31.15
Q18 1308 15.19 1315 1308 17.58
Q19 1082 13.39 1088 1082 13.22
Q20 541 273.22 1034 542 277.45
Q21 1127 613.49 2175 1129 604.99
Q22 106 24.18 124 106 20.55
Table 6. Disk Activity and I/O Wait: Base vs. Xen.
References [10] OSDL Database Test Suite 3.
http://sourceforge.net/projects/osdldbt.
[1] P. T. Barham, B. Dragovic, K. Fraser, S. Hand, T. L. Harris, [11] P. Padala, K. G. Shin, X. Zhu, M. Uysal, Z. Wang, S. Sing-
A. Ho, R. Neugebauer, I. Pratt, and A. Warfield. Xen and hal, A. Merchant, and K. Salem. Adaptive control of virtu-
the art of virtualization. In Proc. ACM Symp. on Operating alized resources in utility computing environments. In Proc.
Systems Principles (SOSP), 2003. EuroSys Conf., March 2007.
[2] B. Clark, T. Deshane, E. Dow, S. Evanchik, M. Finlayson, [12] P. Padala, X. Zhu, Z. Wang, S. Singhal, and K. G. Shin. Per-
J. Herne, and J. N. Matthews. Xen and the art of repeated formance evaluation of virtualization technologies for server
research. In Proc. USENIX’04, FREENIX Track, June 2004. consolidation. Technical Report HPL-2007-59, HP Labs,
[3] C. Clark, K. Fraser, S. Hand, J. G. Hansen, E. Jul, April 2007.
C. Limpach, I. Pratt, and A. Warfield. Live migration of vir- [13] A. A. Soror, A. Aboulnaga, and K. Salem. Database virtu-
tual machines. In Proc. ACM/USENIX Symp. on Networked alization: A new frontier for database tuning and physical
Systems Design and Implementation (NSDI), May 2005. design. In Proc. Workshop on Self-Managing Database Sys-
[4] R. Figueiredo, P. A. Dinda, and J. Fortes. Resource virtual- tems (SMDB’07), April 2007.
ization renaissance. IEEE Computer, 38(1), May 2005. [14] TPC-C: An On-line Transaction Processing Benchmark.
[5] D. Gupta, L. Cherkasova, R. Gardner, and A. Vahdat. En- http://www.tpc.org/tpcc/.
[15] TPC-H: An Ad-hoc, Decision Support Benchmark.
forcing performance isolation across virtual machines in
http://www.tpc.org/tpch/.
Xen. In Proc. ACM/IFIP/USENIX 7th International Mid-
[16] Virtual Appliances. http://www.virtualappliances.net/.
dleware Conf., November 2006.
[17] VMware. http://www.vmware.com/.
[6] D. Gupta, R. Gardner, and L. Cherkasova. XenMon: Qos
[18] XenSource. http://www.xensource.com/.
monitoring and performance profiling tool. Technical Re-
port HPL-2005-187, HP Labs, 2005.
[7] LMbench: Tools for Performance Analysis.
http://lmbench.sourceforge.net/.
[8] A. Menon, J. R. Santos, Y. Turner, G. J. Janakiraman, and
W. Zwaenepoel. Diagnosing performance overheads in the
Xen virtual machine environment. In Proc. Virtual Execu-
tion Environments (VEE’05), June 2005.
[9] U. F. Minhas. A performance evaluation of database systems
on virtual machines. Master’s thesis, University of Waterloo,
2007. Also available as University of Waterloo Computer
Science Technical Report CS-2008-01, January 2008.You can also read