A Comparative Analysis of Short Sea Import and Export Routes to and from the UK - Conducted by the University of Hull Logistics Institute Funded ...
←
→
Page content transcription
If your browser does not render page correctly, please read the page content below
A Comparative Analysis of Short Sea
Import and Export Routes to and from
                              the UK

    Conducted by the University of Hull Logistics Institute
               Funded by Associated British Ports (ABP)

                                                June 2019
                                               Version 1.0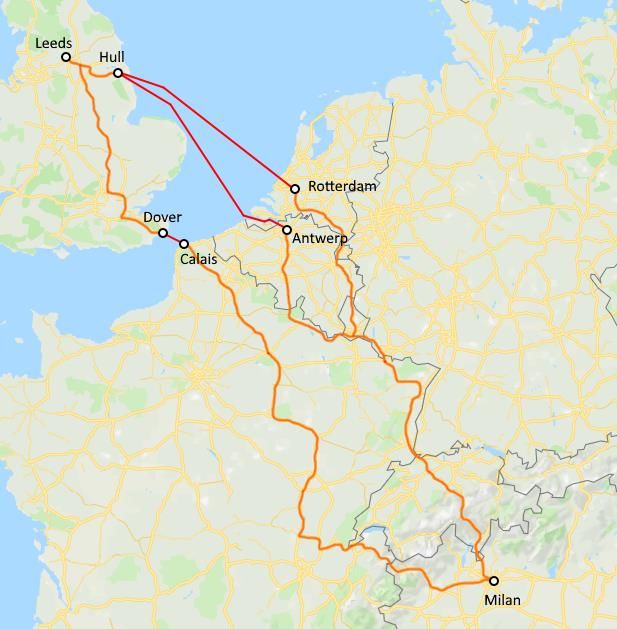
Contents
1.     Introduction .................................................................................................................................... 2
2.     Methodology................................................................................................................................... 3
     2.1      Sites an Routes ........................................................................................................................ 3
     2.2      Calculating Distance, Time and CO2e ..................................................................................... 6
     2.3      CO2e Calculations .................................................................................................................... 7
     2.4      Driver Rest Breaks ................................................................................................................... 8
     2.5      Waiting and Loading/Unloading Times ................................................................................... 8
3.     Route Comparisons ......................................................................................................................... 9
     3.1      Derby to Hanover .................................................................................................................... 9
     3.2      Leeds to Milan ......................................................................................................................... 9
     3.3      Manchester to Warsaw......................................................................................................... 10
4.     Benefits of Humber Ports.............................................................................................................. 12
     4.1      Environmental Benefits......................................................................................................... 12
     4.2      Distance and Time Benefits .................................................................................................. 12
     4.3      Risk and Resilience Benefits .................................................................................................. 13
     4.4      Driver and Asset Utilisation Benefits .................................................................................... 14
5.     Conclusion ..................................................................................................................................... 16
Appendix 1: Distance, Time and CO2e tables: UK Location to UK Port ................................................ 18
Appendix 2: Distance, Time and CO2e Tables: UK Location to Mainland European Locations ............ 19
Appendix 3: Converting CO2e benefits into forest equivalent.............................................................. 20

Version 1.0                                                            Page 1                                                          5 June 2019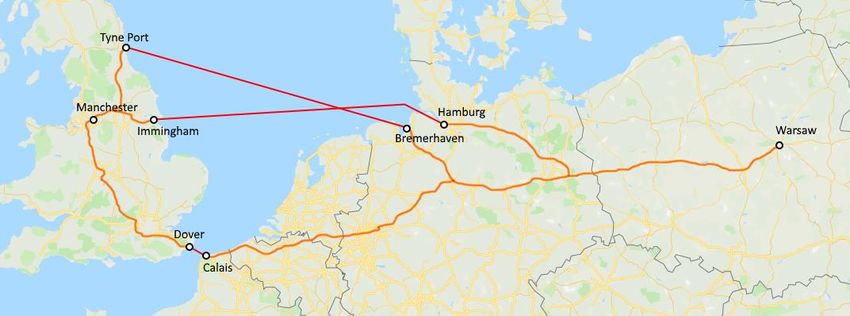
1. Introduction

This report is an analysis of the import and export routes to and from logistics hubs situated in the
central East-West corridor of the UK (roughly North of Derby and South of York) to outline the
advantages of using the ABP Humber ports (specifically Hull and Immingham) in terms of distance,
journey times and CO2 equivalent emissions. Associated British Ports (ABP) commissioned the
Logistics Institute (University of Hull) to compile this report in April 2019.

To transport goods and products between the UK and mainland Europe, short sea services play a
vital role. A number of short sea services are operated between ports located on the East coast of
the UK and mainland ports such as Rotterdam and Amsterdam. These include both Roll On/Roll Off
ferry services (Ro-Ro) and Lift On/Lift Off container vessel services (Lo-Lo).

The report is a comparative analysis of the routes between selected industrial sites in the UK and
Europe for Ro-Ro and Lo-Lo services through the East Coast ports. The routes are compared by
looking at the journey distance (miles), the times taken for the full journey (hrs/mins) and the
carbon dioxide equivalent1 (CO2e) emissions incurred. CO2e (as opposed to CO2) is used as an
emissions measure due to it accounting for all greenhouse gas emissions based on their global
warming potential (GWP). A selected sample of routes are compared and the report concludes with
a comparison of the Humber ports verses other UK ports. A comprehensive comparison of freight
routes between sites, comparing ports and mode of sea transport (accompanied/unaccompanied,
Ro-Ro/Lo-Lo), is contained in the appendixes to this report. A downloadable spreadsheet and an on-
line search feature for these tables can be found at https://lido.hull.ac.uk/routes.

1
    https://www.gov.uk/guidance/calculate-the-carbon-dioxide-equivalent-quantity-of-an-f-gas

Version 1.0                                                     Page 2                         5 June 2019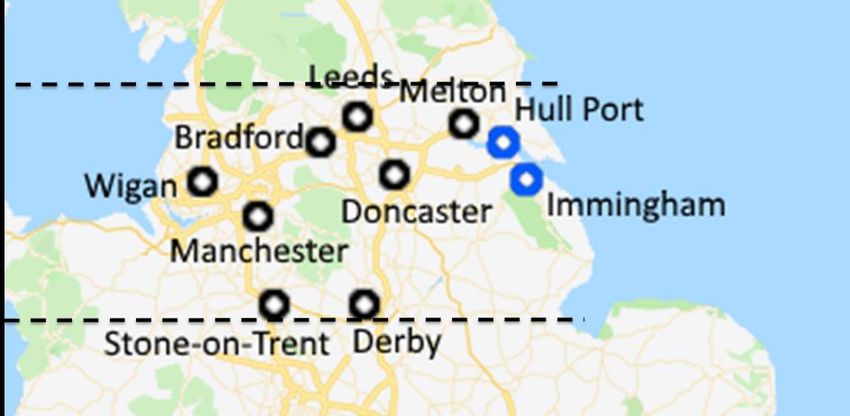
2. Methodology
This section outlines how the data used for the analysis was collected and formatted in order for the
comparisons of the different routes and ports to take place.
For this study we use a sample selection of sites and routes to compare.
All calculations are based on a sample load of an articulated HGV diesel lorry with capacity greater
than 33 tonnes. This is the vehicle weight plus the maximum load. For this study, the average load
weight of 20 tonnes is used, based on data published by Defra2.
2.1 Sites an Routes
To compare the various routes, a representative sample of origin and destination points were
selected. The points in the UK were selected from the areas of high density manufacturing and
warehousing on the northern East-West corridor, in a band bordered by York to the north and Derby
to the south. The industrial locations selected are Melton, Leeds, Doncaster, Bradford, Manchester,
Wigan, Derby and Stoke-on-Trent.
Location Postcode
Armthorpe Industrial Park (Doncaster) DN3 3GW
Euroway Industrial Estate (Bradford) BD4 6SF
Melton Business Park (Melton) HU14 3HB
Waterside Industrial Park (Leeds) LS10 1RW
Trafford Point (Manchester) M17 1SH
Marsh Green (Wigan) WN5 0JL
Sinfin Central Business Park (Derby) DE24 9GJ
Stanley Matthews Way (Stoke-on-Trent) ST4 8GR
Table 1: The locations of UK industrial estates.
Figure 1 maps the UK locations selected and the band in which these locations are.
Figure 1: UK Industrial concentration sites selected for route analysis
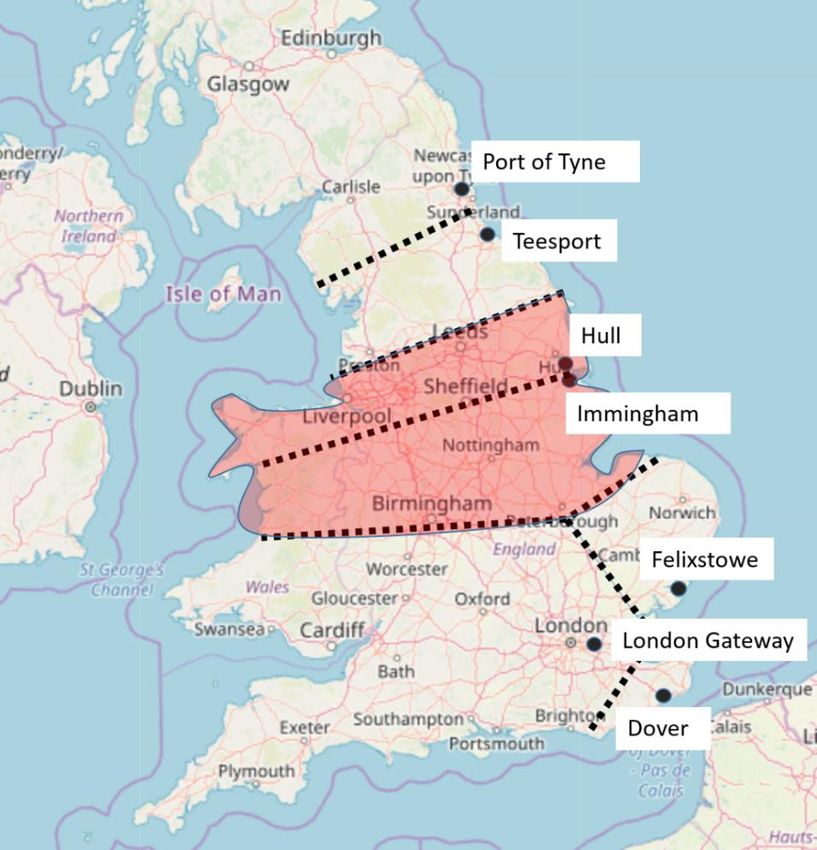
A simplistic Voronoi diagram (Figure 2) illustrates the area for which the Humber ports (Hull or
Immingham) are the closest mainland Europe connected port. The Voronoi indicates the closest
2
https://www.gov.uk/government/publications/greenhouse-gas-reporting-conversion-factors-2018
Version 1.0 Page 3 5 June 2019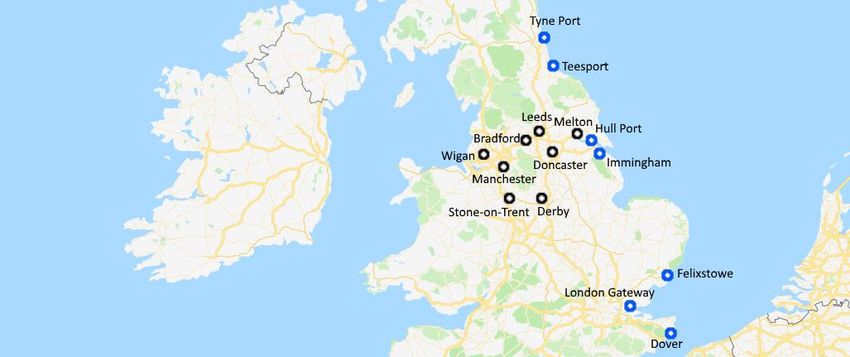
mainland Europe connected port from any point on the map. This does not consider factors such as
physical barriers (e.g. rivers or mountain ranges), historic factors, road conditions and congestion,
logistics service availability and capacity etc. and therefore does not necessarily indicate the “best”
port to ship through, but is a good indicator as a starting position. All the UK sites we selected are
within the central coloured band where Hull or Immingham are closest. It is worth noting that the
indicated area represents 29.3% of the national Gross Value Added (GVA), based on income
generated.

Figure 2: Voronoi diagram segmenting the UK according to the closest mainland Europe (short sea) trading port

The locations in Europe were selected from a publication by Savills Investment Management called
‘European Logistics: Warehousing the Future’3. This document looks at industrial and logistics
corridors in Europe and categorizes locations based on warehouse capacity. These are broken down
into tiers defined by volume in square metres (sqm).

3
    https://www.ons.gov.uk/economy/grossvalueaddedgva/datasets/regionalgvanuts3
4
    http://www.savillsim.com/documents/2017-sim-european-logistics-warehousing-the-future-final.pdf

Version 1.0                                                    Page 4                                           5 June 2019
Tier 1                   Tier 2                    Tier 3                      Tier 4                Tier 5
 > 5 million m2           4 - 5 million m2          2.75 - 4 million m2         2 - 2.75 million m2

2.2 Calculating Distance, Time and CO2e

Land Journeys

In order to calculate the land journey distances and times we cross-referenced a number of route
planners including Freight Journey Planner4, Google Maps5, The AA6, The RAC7 and Impargo8 to
validate the results. Having done so it was concluded that the most accurate results were provided
by Freight Journey Planner for the UK, which is a UK only tool, and Impargo for Europe. The fact that
these are logistics specific route planners ensures that the route calculations are appropriate for
freight vehicles. Based on calibration tests between Impargo and Freight Journey Planner on UK
routes, a correction factor was applied to the European journey times calculated by Impargo. As an
example, using the 3 journey planners for the trip from Wigan to Hull were as follows:

    Wigan WN5 0JL to Hull HU9 5NS
    Freight Journey Planner                  3h 38m
    Google Maps                              3h 24m
    Impargo                                  2h 28
Table 4: Journey time comparisons for 3 route planners.

The Freight Journey Planner website calculates routes by using Smart Road Routing which is a
dynamic algorithm that considers time and day specific restrictions on the route. These include road
closures due to events, road works and night-time restrictions. For consistency to allow comparison,
all journey times were calculated with a departure time of 10.30am on 13/05/2019.

Figure 2: Sample UK industrial/warehouse locations and mainland Europe connected ports

Sea Journey

4
    www.freightjourneyplanner.co.uk
5
    https://maps.google.com
6
    http://www.theaa.com/route-planner/index.jsp
7
    https://www.rac.co.uk/route-planner/
8
    apps.impargo.de

Version 1.0                                                   Page 6                     5 June 2019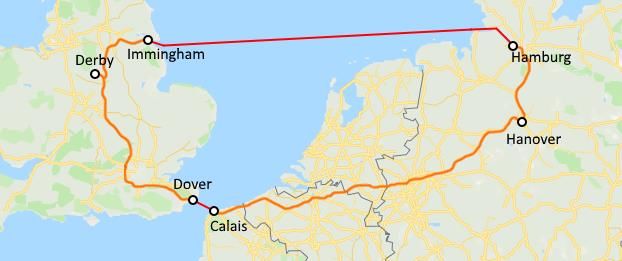
For the sea journeys we used a route planner designed specifically for maritime traffic9. This website
returns distance values in Nautical Miles which were converted to miles so that a total journey could
be calculated in one unit of measure. Ro-Ro services cover both accompanied and unaccompanied
trailers. The CO2e data is based on Ro-Ro ferries with a capacity of 2000+ Lane Metres and container
ships built to carry 0-999 Twenty-Foot Equivalent Units (TEUs)10. All routes were calculated on an
average speed of 17 knots.

Below is a table of postcodes of ports that were used to calculate both the sea and land routes:

    Location                                                                                       Postcode
    The Port of Hull                                                                               HU9 5NS
    The Port of Immingham                                                                          DN40 2LZ
    The Port of Dover                                                                              CT16 1JA
    Teesport                                                                                       TS6 6UD
    The Port of Tyne                                                                               NE34 0PT
    London Gateway                                                                                 SS17 9NA
    The Port of Felixstowe                                                                         IP11 3TA
    The Port of Rotterdam                                                                          3029 AP
    The Port of Calais                                                                             62100
    The Port of Zeebrugge                                                                          8380
    The Port of Hamburg                                                                            20457
    The Port of Lisbon                                                                             1900-264
    The Port of Amsterdam                                                                          1011
    The Port of Bremerhaven                                                                        27568
    The Port of Antwerp                                                                            2000
Table 5: The locations of ports across Europe used.

2.3 CO2e Calculations
All the CO2e values were calculated by using the Defra Conversion Factors 201811. The road
calculation was based on an articulated HGV (>33t). The Defra Conversion Factors are different
depending on the exact mode of transport.

The following Defra conversion factors were used for calculations:

    Transport mode              Defra classification                                     CO2e tonne.km
    Road                        Articulated (>33t) – Average Laden                       0.08348 kg
    Sea (Ro-Ro)                 RoRo-Ferry - 2000+ LM                                    0.05019 kg
    Sea (Lo-Lo)                 Container ship - 0–999 TEU                               0.03681 kg
Table 6: Defra conversion factors used for CO2e calculations

The classifications used are representative of the type of vehicles and vessels used for unitised
freight movement between the UK and mainland Europe.

9
    www.searoutes.com
10
     https://dedola.com/2011/10/what-is-a-teu/
11
     https://www.gov.uk/government/publications/greenhouse-gas-reporting-conversion-factors-2018

Version 1.0                                                    Page 7                                         5 June 2019
During road legs, for each tonne travelling a kilometre, 0.08348 kg of CO2e were emitted. For the sea
legs two options were calculated to cover both Ro-Ro and Lo-Lo ferries. For Ro-Ro, a ferry with a
capacity of 2000 plus Lane Metres (LM) emits 0.05 kg of CO2e for each tonne carried per kilometre.
For Lo-Lo, a container ship 0-1999 TEU emits 0.03 kg of CO2e for each tonne carried per kilometre.

2.4 Driver Rest Breaks
The total journey times we calculated do not include driver rest breaks or overnight stops. This is
due to the legislation being complex and the variables involved having an extremely wide range of
scenarios. These variables include previous working patterns of drivers, weather, road works and
accidents. Due to there being so many variables, it doesn’t make sense for the purposes of this study
to include them in the calculations.

The basic driver rest break regulations12 dictate that a mandatory 45 minute break must be taken
every 4 hours and 30 minutes. These regulations allow for a certain amount of flexibility based on
the driver’s recent working pattern. Although the times in the report don’t include rest breaks, it
must be taken into consideration that for every road journey that exceeds 9 hours (this can be
extended to 10 hours twice a week), the driver must take at least 11 hours rest every day – this can
be reduced to 9 hours rest 3 times between any 2 weekly rest periods.

2.5 Waiting and Loading/Unloading Times
The data includes the vessel loading and unloading times for each sea journey. This has been
included to show the variations with the different types of vessels and how it impacts on the total
journey time. The data was arrived at after a number of discussions with various hauliers about their
experience of loading and unloading times. For this report it is assumed all the ports have the same
loading and unloading times.

 Type                                            Unload    Load     Total
                                                  time     time     time
                                                  (hrs)    (hrs)    (hrs)
 Ro-Ro Unaccompanied                                 1.5     3       4.5
 Ro-Ro Accompanied                                   1.5    1.5       3
 Lo-Lo Containers                                     2      4        6
Table 6: Loading and Unloading for different ship types.

Note that we have not included any waiting time where trucks arrive early to wait for a vessel. Do
consider though that at ports where there are more frequent services (e.g. hourly), the waiting times
are likely to be less where there are less frequent services (e.g. daily) because drivers will plan their
arrival times more conservative for infrequent services to avoid the consequences of missing it.

12
     www.gov.uk/drivers-hours/eu-rules

Version 1.0                                                Page 8                           5 June 2019
3. Route Comparisons
Here we highlight 3 example route comparisons. Note that there are not necessarily current direct
LO-LO and RO-RO services active on all the calculated routes. The time and CO2 calculations are
theoretical values assuming the types of vessels and speeds that would be used on these routes if
there were active direct Ro-Ro or Lo-Lo services.
3.1 Derby to Hanover
The map and data below show that for Hanover to Derby the most efficient route for both mileage
and CO2e is shipping from Immingham to Hamburg. There is a 27% saving on CO2e for the Humber
route. The total distances are very similar, but the Immingham route takes 10 hours longer due to
the longer sea journey.
Sea Leg Total Road Sea Time Total Kg Road Kg Sea Kg
Miles Miles Miles (hh:mm) CO2e CO2e CO2e
Dover – Calais (Ro-Ro) 634 609 25 22:34 1677 1637 40
Immingham –Hamburg (Ro-Ro) 626 193 433 32:42 1217 518 699
Table 7: Breakdown of journey from Derby to Hanover.
3.2 Leeds to Milan
The map and data below compared a journey between Leeds and Milan. There are two possible
Humber routes considered in this example, one via Rotterdam (Ro-Ro) and one via Antwerp (Lo-Lo).
There is a 13% saving on CO2e for the Humber-Antwerp route compared to the Calais-Dover route.
Notably the road journey between Milan and the port is not much different between the port
options, which is contrary to what may be expected. On the Rotterdam route, the travel time is
actually less than the Dover route due to the shorter road journey from Milan.
Version 1.0 Page 9 5 June 2019Sea Leg Total Road Sea Time Total Kg Road Kg Sea Kg
Miles Miles Miles (hh:mm) CO2e CO2e CO2e
Dover-Calais (Ro-Ro) 936 911 25 32:56 2,487 2,447 40
Hull – Antwerp (Lo-Lo) 957 680 277 40:47 2,156 1,709 447
Hull – Rotterdam (Ro-Ro) 946 704 242 29:35 2,282 1,891 391
Table 8: Breakdown of journey from Leeds to Milan.
3.3 Manchester to Warsaw
The map and data below show that for a journey between Manchester and Warsaw, the
Immingham-Hamburg route is the best route for mileage and CO2e. For CO2e there is a 25% saving if
using the Immingham-Hamburg route instead of the Dover-Calais and it only takes an extra 6 hours
on journey time.
Sea Leg Total Road Sea Total Total Kg Road Kg Sea Kg
Accompanied Miles Miles Miles Time CO2e CO2e CO2e
(hh:mm)
Version 1.0 Page 10 5 June 2019Dover – Calais (Ro-Ro) 1,229 1,204 25 40:25 3,273 3,233 40 Immingham – Hamburg (Ro-Ro) 1,091 658 433 46:39 2,466 1,766 699 Tyne – Bremerhaven (Ro-Ro) 1,202 770 432 49:05 2,765 2,067 698 Table 9: Breakdown of journey from Manchester to Warsaw. Version 1.0 Page 11 5 June 2019
4. Benefits of Humber Ports
4.1 Environmental Benefits

There is a clear environmental benefit in reducing land-based miles for goods shipped between the
UK and mainland Europe. This is because the CO2e emissions for water-based transport is
significantly lower per mile per tonne, than land-based transport using HGVs. It is therefore to be
expected that, for the UK sites we evaluated in this study, the shipping routes through the northern
ports will have lower emission values resulting from the larger percentage water-based transport
legs.

Comparing the current share of unitised freight attracted by the Humber ports (12.7%)14 with the
GVA generated by the region that has the Humber as closest port (as per the Voronoi diagram in
Figure 2), 29.3%, it is clear that this potential for being environmentally efficient has not been fully
harnessed. As an example, we know that there are currently 2.6 million HGV loads per year that
moves through Dover, on Ro-Ro ferries, representing 15.7%14 of all unitised freight imports and
exports. We have calculated that for every 1% percent of the 2.6 million HGV loads that can be
rerouted to use a Humber port instead, there will be a reduction of 10,407 tonnes of CO2e, which is
equivalent to the CO2 absorbed by 1,868 acres of woodland or more than twice the size of Central
Park in New York. If 10% of the annual loads are rerouted via the Humber ports, this equates to a
CO2 reduction equivalent of trees covering more than 20 times the size of Central Park, and this is
only for Dover. (If you are interested these calculations are explained in Appendix 3 of this report)

Research done as part of the Innovate UK funded LHOFT (Liverpool Humber Optimisation of Freight
Transport) project indicates a full potential for rerouting 4,000,000 units of unitised freight per
annum from ports in the south to ports in the north (including the Humber ports), with a realistic
target in the medium term of 165,000 units.

4.2 Distance and Time Benefits
For all the UK sites that we have selected the Humber ports are closer than any of the other east
coast ports. For example, compared to Dover, the average reduction in distance for the sample 6 UK
locations is 178 miles, average journey time is cut by 5 hours and 10 minutes and also for CO2e,
there is an average saving of 458Kg per load.

Table 17 shows the miles, travel time and Kg of CO2e emissions per load that are incurred when
travelling between the 6 industrial sites in the UK and the Humber and Dover and the reductions in
distance, time and Kg CO2e when using Humber ports as opposed to Dover.

Version 1.0                                     Page 12                                      5 June 2019
Miles                             Time (h:mm)                         Kg CO2e

                          Hull        Dover         Diff         Hull        Dover      Diff        Hull       Dover        Diff
 Doncaster                  43          240         197         01:21        06:58      5:37         116         644        528
 Bradford                   67          271         204         02:02        07:52      5:50         181         728        547
 Melton                     11          255         244         00:25        07:39      7:14         29          685        656
 Leeds                      60          263         203         01:48        07:37      5:49         160         707        547
 Manchester                104          285         181         03:03        08:23      5:20         278         764        486
 Wigan                     118          288         170         03:35        08:28      4:53         316         773        457
 Derby                      99          211         112         02:59        06:19      3:20         266         567        300
 Stoke-on-Trent            129          241         112         03:51        4.01       3:19         346         648        302
Table 10: Comparison of the statistics between the Humber ports and Dover.

The data shows on average the Humber is 5 hours and 10 minutes nearer to the 8 UK industrial
locations than Dover. The closest location to Dover is Stoke-on-Trent which is still 112 mile further
than travelling to the Humber. This illustrates that any industrial location on the Northern East-West
corridor (as per figure 1) will always be closer in miles and time travelled than Dover. Also, on a CO2e
perspective, the Humber ports are more environmentally friendly with an average saving of 478Kg of
CO2e for the 6 industrial sites.

4.3 Risk and Resilience Benefits

Within logistics, minimising risk is important to make sure there is reliability in the supply chain. For
the period between July 2017 and June 2018, 3.5 million roads goods vehicles travelled from Great
Britain to the continent. 56% of these went through the Dover Strait (this includes Dover,
Folkestone, Ramsgate and the Channel Tunnel). Only 938,000 went through the North Sea routes
(everything North of and including the Thames). This is 26.8% and shows that Great Britain is heavily
reliant on the Dover Strait for Ro-Ro freight13. However, according to ‘EEF The Manufacturers’
Organisation’14, their latest 2018/2019 statistics of industrial output shows that 49% of all
manufacturing (and therefore laden exports as an approximation) originate from the locations
nearer the Humber ports than the Dover Strait in miles. This shows although nearly 50% of
manufacturing originates nearer to the Humber ports, there is 26.8% of road goods vehicles
exploiting the North Sea routes.

For any supply chain to only have one route between the UK and Europe means that if there are any
problems and delays on that route, the supply chain could face considerable disruption. To have a
supply chain that is resilient and to minimise risk, there should be a number of different routes using
different ports on either side of the sea crossings. By using multiple ports in a supply chain, the risk

13
   https://assets.publishing.service.gov.uk/government/uploads/system/uploads/attachment_data/file/756077/roro-july-2017-to-june-
2018.pdf
14
   https://cms.eef.co.uk/campaigning/campaigns-and-issues/manufacturing-facts-and-figures

Version 1.0                                                   Page 13                                               5 June 2019
of a major disruption at one port is mitigated. For example, if a company shipping to the UK from the
EU needs to ship 300 trailers a day, ideally 3 routes with 3 different combinations of ports should be
used, with 100 trailers on each route. This would mean if there was disruption on one of the routes
then at least part of the shipment would be unaffected. Disruption is not only limited to the ports,
the road networks can have disruptions like an accident so by using multiple ports and roads the risk
of one single disruption on the roads is minimised due to a number of routes being used.
An example of the port of Dover being severely disrupted was in June 2015 when French ferry
workers took strike action. The disruption lasted 4 days, caused a 30-mile queue of 4,600 lorries on
the M20 and cost the UK economy £1 billion15,16.
A second example of disruption at Dover is in July 2016 when understaffing at French border posts
led to delays of up to 14 hours through Kent and queues of up to 12 miles17.
Brexit could also add lots of delays to the heavily used ports for European freight such as Dover.
By using the Humber ports instead of Dover, the distance travelled by road, which is the most
expensive mode of travel, is reduced. According to the latest Department for Transport figures,
HGVs represent 5.2% of total miles travelled per annum in Great Britain18 and 2% of road traffic
accidents involve an HGV19. However, 15% of fatalities caused by road traffic accidents in the UK
involved an HGV20. This shows there is a disproportionate number of deaths involving an HGV.. This
demonstrates that if the number of miles travelled by HGVs are reduced, the number of deaths on
roads in Great Britain should also reduce.
4.4 Driver and Asset Utilisation Benefits
With a worsening HGV driver shortage in the UK26 hauliers are under increased pressure to maximise
the efficient use of drivers and improve working conditions for drivers. Maximum utilisation of
tractor units (as the most significant capital investment) is also key for profitability. In this regard we
see some advantages to using the Humber ports for our selected industrial areas. The higher
percentage of unaccompanied freight on the Humber routes results in HGV drivers not spending
unproductive time on the ferries. Drivers can do more, shorter shuttle type routes between
customers and the port and is more likely to end the day at home. The utilisation of the tractor unit
can also be very high in this case.
15
https://www.bbc.co.uk/news/uk-england-kent-33359337
16
https://www.cips.org/en/supply-management/news/2015/july/calais-disruption-cost-uk-1-billion-says-dover-port-chief/
17
https://www.bbc.co.uk/news/uk-england-kent-36873632
18
https://www.gov.uk/government/statistical-data-sets/road-traffic-statistics-tra#traffic-volume-in-miles-tra01
19
https://www.gov.uk/government/statistical-data-sets/ras40-reported-accidents-vehicles-and-casualties
20
https://www.gov.uk/government/statistical-data-sets/ras40-reported-accidents-vehicles-and-casualties
26
https://fta.co.uk/getattachment/Compliance-and-Advice/Economy/Skills-Shortage/Skills-Shortage/Skills-Shortage-report-
2018.pdf?lang=en-GB
Version 1.0 Page 14 5 June 2019The table below indicate the number of shuttle trips a HGV driver can complete from the location to
the port in a working day.
UK Industrial Time for round Number of Time for round Number of trips
Location trip to Humber trips per day trip to Port of per day (9hours)
Ports (9 hours) Dover
(Hull/Immingham)
Doncaster 3:42 2 14:565. Conclusion Reducing freight related greenhouse gasses (GHG)21 and increasing driver utilisation22 and supply chain resilience23 are increasingly important consideration factors in logistics planning and we expect the future development of freight services and infrastructure to reflect this. For industrial sites that are located roughly north of Derby and south of York, the use of the Humber ports (Hull and Immingham) for unitised freight trade with mainland Europe is an attractive option. The road journeys are generally significantly shorter due to the closer distance on the UK side, with a resulting very significant reduction in CO2 and related greenhouse gasses (GHGs). For the routes we analysed, the Humber ports, on average, delivers a 15.3% better CO2e performance compared to the southern port routes. It also provides good opportunities for better truck and driver utilisation, especially using unaccompanied freight options. On the import and export routes via the Humber ports, the sea journeys are longer and road journeys are shorter (at least on the UK side) compared to route via the ports in the South (e.g. London Gateway or Dover). This mostly results in a longer total journey time, given that trucks on land move significantly faster than ships. For the journeys we analysed, on average, it results in less than three hours longer journey times compared to the total journey times through the southern ports, on an average 34 hours total journey time. This is 6.4% additional time. In certain special cases this time difference may be significant, but for most freight journeys this will not be considered significant, with time reliability probably more important. Where unaccompanied or container freight options are used, the longer total journey time should not have any negative impact on driver or asset utilisation as the driver and tractor is only used for the shorter road journeys. For accompanied freight options, if the timing is right, the longer sea journey can be coordinated with the driver mandatory rest periods, although admittedly this is not always easy to achieve. While total journey times between UK industrial to European industrial site may be longer, the shorter journeys between UK industrial site to UK port has the advantage of shorter lead times from production to sailing for export or vessel arrival to warehouse for imports). This is an advantage where the UK party is responsible for this leg. It has to be added though that the higher frequency of sailings from the Dover Strait ports possibly cancels out this advantage to some degree as it provides more flexibility for sailing time. In the time of Brexit uncertainty, there is a great awareness of the importance of resilience in supply chains. The unbalanced high reliance on the southern Dover Strait routes is a vulnerability for supply chains exclusively using these routes. Disturbances or delays on this route can (and have on several occasions in the past) result in problems for time critical and low inventory supply chains. A better balance between the northern and southern ports will result in more resilient supply chains for the UK in general or for individual organisations that split their volume between the routes. 21 https://www.eea.europa.eu/data-and-maps/indicators/transport-emissions-of-greenhouse-gases/transport-emissions-of-greenhouse- gases-11 22 https://fta.co.uk/campaigns/driver-shortage 23 Meriton, R and Graham, G, International Supply Chain Resilience: a Big Data Perspective. In: Proceedings of the 21st Cambridge International Manufacturing Symposium. 21st Cambridge International Manufacturing Symposium - Globalisation 2.0, 28-29 Sep 2017, Cambridge, UK. Institute for Manufacturing, University of Cambridge, pp. 158-164. Version 1.0 Page 16 5 June 2019
Environmental, resilience and utilisation benefits can be gained from using the Humber ports for the
analysed UK industrial locations. This for a relatively small price in total journey times and resulting
in fewer freight miles on UK roads. Cost comparisons are difficult to make because there are so
many factors contributing to the negotiated prices of freight services. However, at price parity or
near price parity, there is a convincing case to consider the Humber ports as a favourable alternative
to other routes, especially in a world where environmental and resilience factors are of increasing
importance.

Version 1.0                                     Page 17                                     5 June 2019
PORTS
                                                                  Hull                Immingham                  Dover                  Teesport                  Tyne              London Gateway             Felixstowe
                                                                Time                    Time                    Time                    Time                    Time                    Time                    Time
              UK Site Name                              Miles (hh:mm)   Kg CO2e Miles (hh:mm)   Kg CO2e Miles (hh:mm)   Kg CO2e Miles (hh:mm)   Kg CO2e Miles (hh:mm)   Kg CO2e Miles (hh:mm)   Kg CO2e Miles (hh:mm)    Kg CO2e

Version 1.0
              Doncaster - (Armthorpe Industrial Park)      44      1:21      117   43      1:21      116 240       6:58      644   98      2:44      264 124       3:29      332 184       5:29      494 189        5:25      509
              Bradford - (Euroway Industrial Estate)       67      2:02      181   80      2:23      215 271       7:52      728   87      2:28      224 112       3:14      301 215       6:23      578 221        6:18      593
              Hull - (Melton Business Park)                11      0:25       29   26      0:54       70 255       7:39      685 109       3:00      279 134       3:46      359 199       6:10      535 205        6:06      550
              Leeds - (Waterside Industrial Park)          60      1:48      160   72      2:10      194 263       7:37      707   74      2:05      190   99      3:49      266 208       6:08      557 213        6:04      572
              Manchester - (Trafford Point)              104       3:03      278 117       3:26      313 285       8:23      764 123       3:31      317 149       4:17      399 229       6:54      614 249        7:17      669
              Wigan - (Marsh Green)                      118       3:35      316 131       3:57      351 288       8:28      773 137       4:03      353 163       4:47      437 232       6:59      624 253        7:19      679
              Derby - (Sinfin Central Business Park)       99      2:59      266   99      3:00      266 211       6:19      567 140       4:00      360 165       4:45      444 155       4:48      417 176        5:07      471
              Stoke-on-Trent - (Stanley Matthews Way)    129       3:51      347 129       3:51      346 241       7:10      648 171       4:51      441 197       5:41      528 185       5:40      498 206        6:04      553

Page 18
                                                                                                                                                                                                                                    Appendix 1: Distance, Time and CO2e tables: UK Location to UK Port

5 June 2019
Appendix 2: Distance, Time and CO2e Tables: UK Location to Mainland European Locations A spreadsheet containing the detailed tables per route (UK site to Mainland Europe site) and freight format (e.g. Ro-Ro, Accompanied) can be downloaded from the site https://lido.hull.ac.uk/routes This site also contains a search tool where you can enter an UK and mainland Europe site and the alternative route options will be displayed for information and comparison. Version 1.0 Page 19 5 June 2019
Appendix 3: Converting CO2e benefits into forest equivalent

For every 1,000 HGV journeys split equally between the 6 EU locations (Paris, Frankfurt, Warsaw,
Munich, Hanover and Milan) travelling from Manchester that use the Humber instead of the Dover
ferry routes, there is a resultant 400.26 tonnes of CO2e reduction.

There are 2.6 million HGV loads travelling through Dover each year27. If 1% of those (26,000) were
diverted through the Humber ports, based on the above calculation, 10,407 tonnes (10.4 million kg)
of CO2e would be saved each year.

A mature tree absorbs on average 22Kg of CO2 per annum24. According to Welsh Woodland
Organisation25, an acre of woodland with trees spaced at 4 metres apart would contain
approximately 253 trees. Taking this into consideration, if the 1% of HGVs using Dover annually were
not diverted through the Humber ports, it would take a woodland the size of 1,868 acres to absorb
the same amount of CO2. This is the same area of 1,245 football pitches26, or more than two Central
Parks in New York27.

The tables below are a breakdown of the CO2e savings by journey from Manchester to each of the 6
EU locations. These are the parameters used to arrive at the total CO2e savings.

The below numbers are based on accompanied Ro-Ro services. This was chosen due to Dover only
handling accompanied Ro-Ro services at present and to give the current scenario. For the first
section below, 1,000 HGVs have been divide between the six EU industrial locations. It was decided
to divide 1,000 HGV journeys over the 6 EU locations to show no bias to a particular location that
heavily favoured the Humber ports. The second section will show the CO2e savings in 1,000 HGV
journeys per EU location. The data below is based on Manchester being the UK industrial location.

 EU Industrial                   Kg CO2e Savings            Tonnes of              Equivalent            Acres of
 location                                                  CO2e Savings          number of trees        woodland
                                                                                needed to absorb
                                                                                      CO2
 Frankfurt                             66,038                       66.04               3,002              12
 Paris                                 18,370                       18.37                835                3
 Warsaw                                134,769                     134.77               6,126              24
 Munich                                47,595                       47.60               2,163               9
 Hanover                               102,037                     102.04               4,638              18
 Milan                                 31,416                       31.42               1,428               6
                       Total           400,225                     400.26              18,192              72
Table 11: A summary of CO2e savings per 1000 loads between Manchester and Mainland Europe.

27
     http://www.urbanforestrynetwork.org/benefits/air%20quality.htm
28
     www.coed.cymru/index.html
29
     https://www.woodlands.co.uk/blog/woodland-activities/how-big-is-an-acre-measuring-your-woodland/
30
     https://www.britannica.com/place/Central-Park-New-York-City

Version 1.0                                                  Page 20                                      5 June 2019
Manchester to Frankfurt
UK Port EU Port Miles Time (hh:mm) Kg CO2e Kg CO2e for
167 HGVs
Hull Rotterdam 635 28:36 1,413 235,731
Dover Calais 683 24:00 1,807 301,769
Saving in CO2e 66,038
Table 12: Breakdown of Manchester to Frankfurt using either Hull or Dover.
Manchester to Paris
UK Port EU Port Miles Time (hh:mm) Kg CO2e Kg CO2e for
167 HGVs
Hull Zeebrugge 538 28:30 1,189 198,563
Dover Calais 494 18:27 1,299 216,933
Saving in CO2e 18,370
Table 13: Breakdown of Manchester to Paris using either Hull or Dover.
Manchester to Warsaw
UK Port EU Port Miles Time (hh:mm) Kg CO2e Kg CO2e for
167 HGVs
Immingham Hamburg 1,091 46:39 2,466 411,822
Dover Calais 1,229 40:20 3,273 546,591
Saving in CO2e 134,769
Table 14: Breakdown of Manchester to Warsaw using either Hull or Dover.
Manchester to Munich
UK Port EU Port Miles Time (hh:mm) Kg CO2e Kg CO2e for
167 HGVs
Hull Zeebrugge 866 33:33 2,070 345,690
Dover Calais 887 30:18 2,355 393,285
Saving in CO2e 47,595
Table 15: Breakdown of Manchester to Munich using either Hull or Dover.
Manchester to Hanover
UK Port EU Port Miles Time (hh:mm) Kg CO2e Kg CO2e for
167 HGVs
Immingham Hamburg 643 33:08 1,264 211,088
Dover Calais 708 24:38 1,875 313,125
Saving in CO2e 102,037
Table 16: Breakdown of Manchester to Hanover using either Hull or Dover.
Manchester to Milan
UK Port EU Port Miles Time (hh:mm) Kg CO2e Kg CO2e for
168 HGVs
Hull Zeebrugge 972 36:48 2,357 395,976
Dover Calais 957 33:42 2,544 427,392
Saving in CO2e 31,416
Table 17: Breakdown of Manchester to Milan using either Hull or Dover.
Version 1.0 Page 21 5 June 2019You can also read