Trends Winter 2021 Taranaki Facts & Figures - Venture Taranaki

Page created by Jeremy Davidson
 
CONTINUE READING
Trends Winter 2021 Taranaki Facts & Figures - Venture Taranaki
Trends
Winter 2021
Taranaki Facts & Figures

                  An initiative of
                  New Plymouth
                  District Council.

                                      1
Trends Winter 2021 Taranaki Facts & Figures - Venture Taranaki
Median house                                                           Youth NEET rates
                    Taranaki is back in                                    Unemployment is
                                           price in New                                                            have dropped
                     the #1 spot for                                         up to 6.3% in
                                          Plymouth tops                                                            down to the
                     GDP per capita                                            Taranaki
                                             $600,000                                                           lowest since 2017

                                                      Welcome
                                                      Taranaki Trends is produced by Venture Taranaki as a 6-monthly economic
                                                      snapshot of our region. As such, it provides a range of metrics, represented as
                                                      digestible charts and graphs, to help inform the region’s leadership, enterprises and
                                                      investors.
                                                      The key focus of this publication lies with tracking our regional economy as
                                                      we move past the immediacy and lockdown impacts of 2020 and into the
                                                      possibilities of 2021 and beyond.
                                                      This edition also explores some of the medium-term impacts from the COVID-19
                                                      pandemic, a year on from the Level 4 lockdown in 2020; particularly around
                                                      employment, industry growth, mobility and living standards.
                                                      This latest edition of Taranaki Trends places a spotlight on our regional GDP
                                                      and continues our series of township profiles from around the maunga. While our
                                                      region has the highest GDP per capita in Aotearoa, we also have significant inequity
                                                      issues, with high child poverty rates and significant disparities among our
                                                      communities.
                                                      Justine Gilliland
                                                      Chief Executive

Photo credit: Laura Warren                                                                                                                    2
Trends Winter 2021 Taranaki Facts & Figures - Venture Taranaki
Contents
Welcome                     2
Population trends           4
Migration trends            5
Economy                     6
Growth industries           7
Regional spotlights         8
COVID-19 regional impacts   11
Employment                  12
Construction sector         19
Housing trends              23
Retail sector               28
Visitor sector              35
Traffic Movements           40
Enterprise trends           44
Looking ahead               47
Notes                       48

                                 3
Trends Winter 2021 Taranaki Facts & Figures - Venture Taranaki
Population

   New Zealand population 1 :    Taranaki population:          Taranaki Māori population:
          5,107,700                   124,600                           25,700

                     Males: 62,200                    Females: 62,400

    New Plymouth District            Stratford District           South Taranaki District
     population: 86,100              population: 9,880             population: 28,700

                                                            Numbers relate to supporting notes at end of this document
                                                            Source: Population - Stats NZ estimate 2020
                                                                    Māori population - Infometrics 2020            4
Trends Winter 2021 Taranaki Facts & Figures - Venture Taranaki
Permanent and long-term migration to Taranaki

          Comparison Across Years of International Permanent                                   This graph indicates permanent and long-
                        Migration to Taranaki                                                  term international arrivals into Taranaki.
 180
 160
                                                                                               To be counted in this data set people must
                    2020 Level 4 Lockdown                                                      be arriving for a stay of 12 months or more,
 140
                                                                                               or be New Zealanders returning after an
 120                                                                                           absence of 12 months or more.
 100                                                                            2019
  80
  60                                                                            2020

  40
  20
   0
        Jan   Feb   Mar    Apr    May       Jun   Jul   Aug   Sep   Oct   Nov    Dec

 During the April 2020 COVID-19 level lockdown there was a sharp decline in permanent
 migration to Taranaki, mostly felt in the New Plymouth District. These numbers began
 recovering around June 2020.

 Migration into Taranaki is yet to see permanent migration numbers that hit the highs of
 2019 and early 2020. Taranaki and the rest of New Zealand are feeling the impact of this
 decrease in international migration through labour shortages in industries such as nursing,
 food production/farming and construction. As COVID-19 vaccines begin to roll out globally
 in 2021, we expect the number of permanent international arrivals to continue to recover.

                                                                                                                          Source: Statistics NZ   5
Trends Winter 2021 Taranaki Facts & Figures - Venture Taranaki
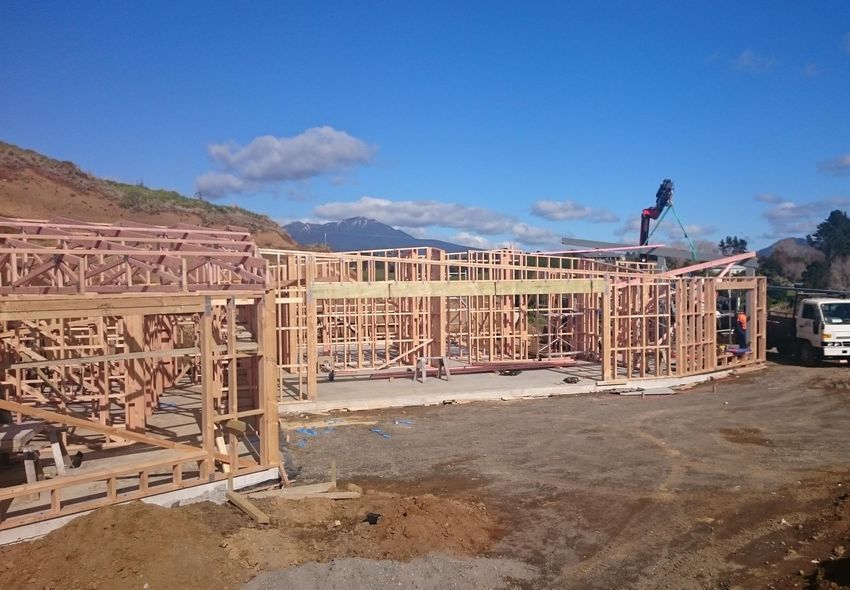
Economy – Gross Domestic Product                                                                                               Taranaki’s
                                                                                                                                 Top 3 GDP
                                                                     In 2020, Taranaki’s GDP increased 5.1
                                                                                                                                 Industries:
                                                                     percent, which was slightly below the
                                                                   national average of 5.4 percent. This was
   New Zealand GDP: Taranaki GDP:                                  mainly driven by food and fibre production
    $323B (+5.4%)   $9.5B (+5.1%)                                 and processing, and the energy sector. The
                                                                  increase was partially offset by a slowdown
                                                                          in primary manufacturing. 2
                                                                                                                                    Forestry, Fishing,
                                                                                                                                      and Mining:
                                                                                                                                       $1,750M
              Taranaki businesses:
                    15,540                                   GDP per capita (YE March 2020)
                                             Taranaki                                                           $76,715.00

 In 2020, Taranaki once again              Wellington

 experienced the highest GDP                Auckland

per capita in New Zealand. This          Marlborough                                                                                   Primary
      is driven by our high-                Southland                                                                                Manufacturing:
                                           Canterbury
    productivity energy and                                                                                                             $980M
                                               Otago
  food/agriculture industries.
                                           West Coast
    Taranaki has claimed the
                                             Waikato
 number one spot for GDP per
                                         Bay of Plenty
  capita in New Zealand since
                                       Tasman/Nelson
  2001, with the exception of
                                          Hawke's Bay
 only four years (2004-2006 &
                                  Manawatu-Whanganui
 2017) when Wellington took
                                             Gisborne
                                                                                                                                        Agriculture:
     the number one spot.                   Northland                                                                                     $817M
                                                     $0.00           $25,000.00       $50,000.00       $75,000.00
                                                                                                                             Source: Statistics NZ 2020   6
Trends Winter 2021 Taranaki Facts & Figures - Venture Taranaki
Taranaki export GDP:
                                                                                                               $2.8B (+5.8%)
               Taranaki’s fastest growing industries:
Taranaki's beverage manufacturing sector took a huge leap forward in 2020, growing from a $2 Million          Taranaki’s
industry in 2019 to a $10 Million industry in 2020 (GDP). This growth can be credited to the hard work of
many local operators such as Mike's Brewery, Forgotten 43, Shining Peak and the Three Sisters brewery. 2        Top 3
                                                                                                               exports:
               330%                                 19%                                15%
              Annual                               Annual                             Annual
              Growth                               Growth                             Growth
      Beverage                                                                                                      Mining:
                                            Central                       Telecoms, Internet
    Manufacturing                         Government                      & Library Services                       $750.7M

Taranaki’s largest industry categories by business units:                                                           Dairy:
                                                                                                                   $716.2M

    Agriculture,                      Rental, Hiring &                      Construction:                           Meat:
 Forestry & Fishing:                    Real Estate:                        1,443 business                         $357.5M
   3,957 business                      2,919 business                           units
        units                              units
                                                                                                             Source: Infometrics, 2020   7
Trends Winter 2021 Taranaki Facts & Figures - Venture Taranaki
Regional Spotlight:                                                                   Population: 1,539
                                                                                      Median age: 41.7
Ōakura                                                                              Māori median age: 21.4

                                                                       Most popular occupation: Professionals
                                                                             Median income*: $40,400
                                                                            Employed full-time: 49.7%
                                                                               Unemployed: 2.1%

                                                                                 Born in New Zealand: 75.8%
                                                                                  Māori ethnic group: 10.3%
                                                                                 Te reo Māori speakers: 2.3%
                                                                                   NZ Sign Language: 0.2%

                                                                              No qualifications held**: 12.4%
                                                                                Studying full-time: 24.8%
                                                                                 Studying part-time: 5.1%

                                                                        Occupied private dwellings: 82.3%
                                                                   Live in owned or partly owned home: 53.2%
                                                                            Median weekly rent: $390
                      * Median income received is the total before-tax income of a person (aged 15 years and over), in the 12 months ended 31 March 2018.
                      ** This data set only includes those aged 15 years and over
                                                                                                           Source: Statistics NZ, Census 2018 8
Trends Winter 2021 Taranaki Facts & Figures - Venture Taranaki
Regional Spotlight:                                                                                                                              Population: 2,061
 Stratford Central                                                                                                                                Median age: 42
                                                                                                                                               Māori median age: 21.1

                                                                                                                                          Most popular occupation: Labourers
                                                                                                                                              Median income*: $26,100
                                                                                                                                              Employed full-time: 43.9%
                                                                                                                                                  Unemployed: 3.6%

                                                                                                                                             Born in New Zealand: 88.3%
                                                                                                                                              Māori ethnic group: 16.2%
                                                                                                                                             Te reo Māori speakers: 2.2%
                                                                                                                                               NZ Sign Language: 0.2%

                                                                                                                                           No qualifications held**: 33.4%
                                                                                                                                              Studying full-time: 18.3%
                                                                                                                                              Studying part-time: 3.1%

                                                                                                                                           Occupied private dwellings: 92.7
                                                                                                                                      Live in owned or partly owned home: 59.5%
                                                                                                                                               Median weekly rent: $240

* Median income received is the total before-tax income of a person (aged 15 years and over), in the 12 months ended 31 March 2018.
** This data set only includes those aged 15 years and over                                                                                                Source: Statistics NZ, Census 2018 9
Trends Winter 2021 Taranaki Facts & Figures - Venture Taranaki
Regional Spotlight:                                                                                                                           Population: 1,1191

Pātea                                                                                                                                         Median age: 46.7
                                                                                                                                            Māori median age: 31.7

                                                                                                                                       Most popular occupation: Labourers
                                                                                                                                           Median income*: $19,500
                                                                                                                                           Employed full-time: 31.5%
                                                                                                                                               Unemployed: 7.1%

                                                                                                                                          Born in New Zealand: 92.1%
                                                                                                                                           Māori ethnic group: 49.1%
                                                                                                                                          Te reo Māori speakers: 14.1%
                                                                                                                                            NZ Sign Language: 1.3%

                                                                                                                                         No qualifications held**: 39%
                                                                                                                                           Studying full-time: 16.9%
                                                                                                                                           Studying part-time: 1.8%

                                                                                                                                       Occupied private dwellings: 88.4%
                                                                                                                                 Live in owned or partly owned home: 55.4%
                                                                                                                                          Median weekly rent: $150

 * Median income received is the total before-tax income of a person (aged 15 years and over), in the 12 months ended 31 March 2018.                                                      1
 ** This data set only includes those aged 15 years and over                                                                                            Source: Statistics NZ, Census 2018 0
COVID-19
regional
impacts
Employment

             12
36% of
                                Jobs filled in Taranaki                                                                                                      Jobs in
                                                                                                                                                            Taranaki
                                  54
                                                                                                                                                           are highly
                                 53.5                                                                     There were on average 51,948 filled
                                                                                                          jobs in Taranaki in 2020. Taranaki                 skilled
Number of Jobs Filled (1000s)

                                  53
                                                                                                          experienced its lowest level of
                                 52.5                                                                     employment in April due to the level
                                                                                               52.63
                                                                                                          4 COVID-19 lockdown at 51,059
                                  52                                                                      jobs.
                                 51.5
                                                                                                          Taranaki has responded to COVID-19                16.3% of
                                  51                                                                      well in terms of keeping levels of                workers
                                                                                                          employment high. During the peak of
                                 50.5                                                                     the holiday season in December                   are Māori
                                  50
                                                                                                          2020 there were 952 more jobs filled
                                                                                                          than in December 2019. 3
                                 49.5
                                        Nov Dec Jan Feb Mar Apr May Jun Jul Aug Sep Oct Nov Dec Jan
                                               2020                                            2021

                                                  Top Employers in Taranaki:                                                                                47% of
                                                                                                                                                           workers
                                                                                                                                                          are female

                                                                   Cheese & Dairy
                                  Dairy Farming                    Manufacturing                       Grocery Stores
                                        3,221                            1,796                             1,624
                                         Jobs                             Jobs                              Jobs                                 Source: Stats NZ   13
Taranaki NEET Rates
Youth (15-24 years) not in                                                      Youth NEET rates (YE-Dec 2020)
employment, education or                               18   14.9   14
                                                                               15.3 14.5
                                                       16               13.3                13.1 13.9                       12.8           13.6          12.9
                                                       14
training                                               12                                                  10.6 10.5 10.1          10.3           10.8
                                                       10
                                                        8
                                                        6
                                                        4
Taranaki experienced a peak in NEET rates during        2
                                                        0
2019, however this dropped back down over 2020,
and is now in line with the national average.

NEET rates changes each year as those at the top
turn 25 and a fresh cohort turn 15 and join the
demographic. It is likely that more young people
chose to stay in education due to the uncertain
                                                                                  Taranaki vs NZ NEET rates
economic climate over 2020.
                                                                    Taranaki and National NEET Rate (YE-Dec 2020)
Another reason for the drop in NEETs for Taranaki      20
may be an increase in availability of apprenticeship
schemes.                                               15

The Taranaki NEET rate for people aged 15-19 years     10
is 8.8% and those 20-24 years is 18.1%.
                                                        5
*Not in Education, Employment or Training 4
                                                        0
                                                            2010    2011       2012     2013    2014       2015   2016      2017    2018      2019       2020

                                                                                      Taranaki NEET rate          National NEET rate

                                                                                                                                          Source: Statistics NZ   14
Taranaki Jobseeker support

There were 1,188 more people on Jobseeker
support in February 2021 (5154 people),                        Taranaki Jobseeker and COVID-19 Income Relief Payment
compared to February 2020 (3966 people). This                                      (CIRP) Recipients
represents a 30% increase.                          6000

The number of people on CIRP support                5000
decreased steadily since its peak in August
                                                    4000
2020, and this programme is now complete.
                                                    3000
Whilst the CIRP payments provided important
                                                    2000
relief for people losing their jobs due to COVID-
19, most have now transferred to Jobseeker          1000
support. Jobseeker numbers remain
significantly higher than in the 12 months prior       0
                                                           Apr-19   Jul 19     Oct 19      Jan 20      Apr 20        Jul 20   Oct 20     Jan 21
to the pandemic.
                                                                                 Sum of Jobseeker Support       Sum of CIRP

       In February 2021,
       there were 5,154                              COVID-19 Income Relief Payment (CIRP) - People who lost their job between 1 March 2020 and 30
                                                     October 2020 were able to apply for CIRP from 8 June until 13 November 2020 and receive payments
       people in Taranaki                            for up to 12 weeks. The numbers reported are of those eligible, aged 16 years and older. These
          on Jobseeker                               payments are now complete, and this benefit is no longer available.
            support

                                                                                                            Source: Ministry of Social Development      15
Taranaki Jobseeker support – by district
                                                                                                                        New Plymouth District
                                                                                         3,000
In Taranaki, 7.2% of the working-age population received this
support in February 2021, compared to an average of 6.9% across all                      2,500
regions in New Zealand.
                                                                                         2,000

Throughout the region, the number of people on Jobseeker support                         1,500
is up 39% in the New Plymouth district, 25% in Stratford district and
                                                                                         1,000
30% in the South Taranaki district, compared to February 2020. This
excludes those on the CIRP.                                                               500

                                                                                            0
                                                                                                 Aug 19       Nov 19       Feb 20       May 20       Aug 20        Nov-20        Feb-21

                                                                                                          New Plymouth District Jobseeker        New Plymouth District CIRP

                               Stratford District                                                                        South Taranaki District
 350                                                                                     1,200

 300                                                                                     1,000

 250                                                                                      800
 200
                                                                                          600
 150
                                                                                          400
 100
                                                                                          200
  50

   0                                                                                         0
       Aug 19   Nov 19       Feb 20        May 20        Aug 20        Nov-20   Feb-21           Aug 19        Nov 19       Feb 20       May 20        Aug 20        Nov-20       Feb-21

                  Stratford District Jobseeker      Stratford District CIRP                               South Taranaki District Jobseeker       South Taranaki District CIRP

                                                                                                                                     Source: Ministry of Social Development 16
Unemployment within Taranaki                                                                                                        Taranaki’s
Regional unemployment rates (quarter ending December 2020)                                                                         unemployment
                                                                                                                                       rate at
                                                                                                                                   December 2020
                                                       Regional Unemployment rate
                                                                                                                                      was 6.3%
             7                                          6.3
                 5.6                  5.6     5.7
             6         5.3                                                                                  5.2
                             4.8                                            4.6                                            4.9
                                                                   4.5
Percentage

             5                                                                          4.3
                                                                                              3.9                  3.9
             4                                                                    3.1               3.3
             3
             2
             1
             0

                                   Unemployment rates in Taranaki
     7.5
       7
                                                                                                          At the end of June 2020, unemployment in
     6.5
       6                                                                                                  Taranaki was at 4.4%, and this had increased to
     5.5                                                                                                  6.3% for the year ending December 2020. The
       5
     4.5
                                                                                                          national unemployment rate for the year ending
       4                                                                                                  June 2020 was 3.9% and was up to 4.9% for the
     3.5                                                                                                  year ending December 2020. 5
       3

                                            Taranaki          New Zealand
                                                                                                                                 Source: Statistics NZ      17
Unemployment within Taranaki
 Regional unemployment rates (quarter ending December 2020)
                     Unemployment by gender - Taranaki vs. NZ                                                         Unemployment rates
         10
                                                                                                                     for women and Māori
          9                                                                                                          have increased steeply
          8                                                                                                          over the 12 months to
          7                                                                                                            year end December
Percentage

          6
          5
                                                                                                                              2020
          4
          3
          2
          1
          0
                   2016             2017            2018          2019       2020       Unemployment rates for women have traditionally been higher
                    Male Taranaki          Female Taranaki      Male NZ     Female NZ   than for men, however in 2019 the rate for women in Taranaki
                                                                                        dropped to a low of 2.4% (compared to 5.9% for men). It has
                      Unemployment by ethnicity - Taranaki vs. NZ                       risen sharply since December 2019 and now sits at 6.1%
                                                                                        (compared to 6.5% for men).
              20

                                                                                        Unemployment for women across New Zealand remains
              15                                                                        consistently higher than the rate for men.
Percentage

              10                                                                        Unemployment levels for Māori in Taranaki fell steadily
                                                                                        between 2015-2018 but rose again from 2018 and are currently
               5                                                                        at 12.4%, compared to 9% for Māori nationally.

               0                                                                        Unemployment rates for men and people of European descent
                     2016             2017             2018          2019       2020
                                                                                        generally remain steady, and relatively low. 5
                                      European Taranaki       European NZ
                                      Māori Taranaki          Maori NZ                                                       Source: Statistics NZ     18
Construction

               19
Construction in Taranaki
Total value of building consents issued in Taranaki: $375,470,362 YE Feb 2021
   400,000,000
   350,000,000
   300,000,000
   250,000,000
   200,000,000
   150,000,000
   100,000,000
    50,000,000
            0
                 2001 2002 2003 2004 2005 2006 2007 2008 2009 2010 2011 2012 2013 2014 2015 2016 2017 2018 2019 2020 2021

                                          New Plymouth District        Stratford District    South Taranaki District

Percentage change in total consents value YE February 2021 vs February 2020
   12.00%                                 10.78%
                            9.72%                                                           The total value of all building consents processed in
   10.00%
                                                                                            Taranaki in the 12 months ending July 2020 ($375,470,362)
    8.00%                                                                                   is up 1.25% compared to the 12 months ending February
    6.00%                                                                                   2020 ($370,826,479).
    4.00%
                                                                            1.91%           Consents in New Plymouth district were down slightly,
    2.00%                                                 1.25%
                                                                                            while South Taranaki and Stratford both recorded significant
    0.00%                                                                                   increases in consents issued.
   -2.00%      -1.18%
            New Plymouth   Stratford   South Taranaki Total Taranaki      Total NZ          Total value of consents for the whole of New Zealand
               District     District      District                                          increased by 1.9% over the same period.

                                                                                                                                             Source: Statistics NZ   20
Value of building consents in Taranaki
Taranaki region: $ 375,470,362 YE Feb 2021

                        Total building consents, monthly value
    40,000,000
                                                                                                                      New Plymouth district accounts
                                                                                                                      for 77% of all building consents
    35,000,000
                                                                                                                      processed in the region, Stratford
                                                                                                                      district accounts for 6% and the
    30,000,000                                                                                                        remaining 17% were processed in
                                                                                                                      the South Taranaki district.
    25,000,000

    20,000,000

    15,000,000

    10,000,000

     5,000,000

            0
                 Feb-20 Mar-20 Apr-20 May-20 Jun-20   Jul-20   Aug-20 Sep-20 Oct-20 Nov-20 Dec-20   Jan-21   Feb-21

                                      New Plymouth        Stratford       South Taranaki

                                                                                                                                     Source: Statistics NZ   21
Value of residential vs all construction YE February 2021
By Territorial Authority

              New Plymouth Building Consents                                   Stratford Building Consents
 40,000,000                                                 4,000,000
 35,000,000                                                 3,500,000
 30,000,000                                                 3,000,000
 25,000,000                                                 2,500,000
 20,000,000                                                 2,000,000
 15,000,000                                                 1,500,000
 10,000,000                                                 1,000,000
  5,000,000                                                  500,000
         0                                                         0

                 All construction   Residential buildings                        All construction   Residential buildings

              South Taranaki Building Consents
 9,000,000
                                                             New Plymouth district experienced a lull in consents towards
 8,000,000                                                   the middle of 2020, followed by an increase. All consents were
 7,000,000                                                   down in the early part of 2021, but residential slightly up.
 6,000,000
 5,000,000                                                   Stratford district experienced a notable dip in consents over
 4,000,000                                                   September 2020, with another dip in activity during January,
 3,000,000                                                   which may simply be a slowdown over the holiday period.
 2,000,000
 1,000,000
         0
                                                             South Taranaki building consents have been fairly steady but
                                                             trending downward over the year.
                                                                                                                  Source: Statistics NZ
                 All construction   Residential buildings                                                                        22
Housing

          23
Interest rates & housing value

    Date        House prices %                             House prices                               Date                           Floating rate                2 year fixed rate
                   change                                    % change
                 (NZ wide) 6                                (Taranaki) 6                              Jan 2020                       5.5%                         4.4%
    2019                              7.8%                          2.8%                              June 2020                      4.6%                         3.7%
    2020                             12.9%                          4.2%                              December 2020                  4.5%                         3.5%
    2021*                            22.8%                      26.2%                                 February 2021                  4.5%                         3.5%

                                                           Comparison of Mortgage Rates and House Values in 2019-2020
                                   7.00%                                                                                                                           14.00%

                                   6.00%                                                                                                                           12.00%

                                                                                                                                                                             House Value % growth
                                   5.00%                                                                                                                           10.00%
                Interest rates %

                                   4.00%                                                                                                                           8.00%

                                   3.00%                                                                                                                           6.00%

                                   2.00%                                                                                                                           4.00%

                                   1.00%                                                                                                                           2.00%

                                   0.00%                                                                                                                           0.00%
                                            Jan Feb Mar Apr May Jun Jul Aug Sep Oct Nov Dec Jan Feb Mar Apr May Jun Jul Aug Sep Oct Nov Dec
                                           2019

                                           Floating interest rate      2 year fixed interest rate   House value growth in Taranaki       House value growth in New Zealand

*YoY as at Feb 21                                                                                                                    Source – RNBZ 2020 & infometrics 2020                          24
Housing affordability
Despite relatively lower house price to income ratios than the rest of NZ, rental affordability in Taranaki is similar to the NZ mean. Housing
affordability, as indicated in the chart below, is more favourable in Taranaki.

                    Housing affordability index                                                   Rental affordability index
8                                                                          25.0%
7
                                                                           20.0%
6
5                                                                          15.0%
4
3                                                                          10.0%
2
                                                                            5.0%
1
0                                                                           0.0%
      2015        2016         2017        2018       2019      2020                  2015       2016           2017      2018          2019     2020

                         Taranaki Region     New Zealand                                                Taranaki Region   New Zealand

The housing affordability index is the ratio of the average current            The rental affordability index is the ratio of average weekly rent
house value to average household income. A higher ratio, therefore,            to average household income. A higher ratio, therefore, suggests
suggests that median houses cost a greater multiple of typical                 that average rents cost a greater multiple of typical incomes,
incomes, which indicates lower housing affordability. 7                        which indicates lower rental affordability. 7

                                                                                                Source – RNBZ 2020 & infometrics 2020          25
House volumes sold in Taranaki
                                                       Monthly House volume sold
  180
  160
  140
  120
  100
   80
   60
   40
   20
    0

                                        New Plymouth District    South Taranaki District   Stratford District

 Median house prices in Taranaki region increased 26.2% annually in February 2021 to $520,000, a record equal with January 2021.

 The number of properties sold in February increased 31.4% from the same time last year. There are plenty of purchasers in the market looking
 for quality properties, including investors, and open homes have continued to be busy across the region.

 Listings for the region were up 0.5% annually, but high sales volumes and low listings have resulted in a -29.4% decrease in available stock for
 the region. This shortage of available properties has placed upward pressure on prices and meant that properties are selling quickly when they
 do reach the market. Median days to sell are at their lowest level for a February month since records began, at 21 days.

 - Bindi Norwell REINZ CEO

                                                                                                                       Source: Infometrics (REINZ)   26
Median price of houses sold in Taranaki                                                                                 The national
                                                                                                                       median house
                                                                                                                    price for the month
                                                                                                                     of February was
House prices have also
                                                                                                                       $780,000 – up
remained buoyant. The region                                  Median price – February 2021
saw median house prices reach                                                                                            22.8% on
                                   $1,400,000
$520,000 with Stratford district   $1,200,000                                                                          February 2020
achieving a median price of        $1,000,000
                                     $800,000                                  $600,000
$460,000.                                                                                     $460,000
                                     $600,000                                                                $397,000
                                     $400,000
The value of houses in Taranaki      $200,000
increased across the board.                $0

House prices increased by
35.3% in Stratford, 34.6%
in South Taranaki and 14.3% in
New Plymouth district.

               Median price per region - February 2021                        Median price percentage change - Feb 2021 vs.
  $1,200,000                                                                                    Feb 2020
  $1,000,000                                                            40%
    $800,000                                                            35%
                                                                        30%                              26.0%
    $600,000                                       $520,000             25%
                                                                        20%
    $400,000                                                            15%
    $200,000                                                            10%
                                                                         5%
         $0                                                              0%

                                                                                                                            Source: REINZ   27
Retail

         28
Retail: Taranaki regional barometer

                                                                                     Taranaki-wide
 Due to stores being closed during the COVID-19 lockdowns and the uncertainty     consumer spending
 surrounding the pandemic, the consumer spend of Taranaki’s districts was           was higher than
 especially volatile throughout 2020. Throughout 2021 so far, we have seen          pre-covid levels
 Taranaki’s consumer spend continue to grow for most of the year, with slightly
 larger dips in Stratford spending being an exception. It has not grown
                                                                                   from May 2020 -
 particularly well in comparison to 2019 numbers, but in comparison to               January 2021
 Auckland the spend has been far less impacted by recent changes in COVID-19
 alert levels. 8

                                                                                  Source: MarketView   29
Retail: Online Spending

        While some brick-and-mortar retail stores have struggled due to the impacts of COVID-19, online spending in
        New Zealand hit an all-time high with a 30% increase in spending between January and June 2020 when
        compared to the same period in 2019. After an initial peak during the level 3 lockdown online spending levels
        remained strong throughout the rest of 2020. The October – December quarter finished the year off strong
        with a $1.5 Billion increase of online spending from 2019. Online spending in November was specifically high
        due to big sales numbers on Singles Day, Black Friday and Cyber Monday.

                                                                                            Source: NZ Post eCommerce Spotlight Hub   30
Retail: Taranaki regional barometer
12 months ending December 2020 compared to December 2019
                                                                                                                                                Total retail spend
                               Total Regional Spend YE December 2020                                                                            within Taranaki for
$600,000,000
                                                                                          $563,157,730                                           the year ending
$500,000,000                                                                                                                                       December:
$400,000,000
$300,000,000                                                            $210,745,848                                                             $1,411,221,275
                                              $161,075,125 $181,059,407                                  $159,193,322
$200,000,000
                 $41,992,940    $66,492,500                                                                               $27,504,402
                                                                                                                                                      +1.4%
$100,000,000
          $0

Percentage change in regional spend YE December 2020
                                             Cafes,
                                          Restaurants,                                                     Home,
                           Apparel &         bars &        Department         Fuel &     Groceries &     Hardware &     Other Customer
          Accommodation    Personal        takeaways     stores & Leisure   Automotive     liquor         Electrical       Spending
 15.00%                                                                                    10.8%
                                                                                                            8.5%
 10.00%
  5.00%                                                       1.2%
  0.00%                                                                                                                                  NB: total spend includes a COVID
 -5.00%                                                                                                                                  aggregation which is not reflected
-10.00%                                       -4.9%                                                                                      in the categories analysed.2
               -8.2%           -9.2%                                          -7.5%
-15.00%
-20.00%
-25.00%
-30.00%
-35.00%
-40.00%                                                                                                                    -34.6%

                                                                                                                                                         Source: MarketView   31
Retail: New Plymouth district barometer
12 months ending December 2020 compared to December 2019

       New Plymouth district percentage change in district spend year-ending December2020
                                             Cafes, Restaurants, Department stores &                                          Home, Hardware &   Other Customer
        Accommodation   Apparel & Personal    bars & takeaways         Leisure       Fuel & Automotive   Groceries & liquor      Electrical         Spending
 20%
                                                                                                              10.5%
 10%                                                                                                                               6.2%
                                                                       1.3%
 0%

-10%                                               -4.4%
                              -7.9%                                                       -7.7%
           -11.4%
-20%

-30%

-40%
                                                                                                                                                    -39.7%
-50%

                                          Retail spend                        +0.6%: Change in spend
                                                                              -5.2%: Change in number of transactions
                                         within district:                     +6.1%: Change in average transaction value
                                        $1,057,744,782                        $45.30: Average transaction value

                                                                                                                                                     Source: MarketView   32
Retail: Stratford district barometer
12 months ending December 2020 compared to December 2019

              Stratford district percentage change in spend year-ending December 2020
                                            Cafes, Restaurants,   Department stores &                                            Home, Hardware &   Other Customer
       Accommodation   Apparel & Personal    bars & takeaways           Leisure         Fuel & Automotive   Groceries & liquor      Electrical         Spending
10%                                                                                                                                    8.9%
                                                                                                                  8.1%

                                                                         5.3%
 5%

 0%

-5%        -4.0%                                                                                                                                        -3.5%

-10%                                              -8.3%
                                                                                             -9.5%
                            -12.1%
-15%

                                         Retail spend                      +1.1%: Change in spend
                                                                           -6.4%: Change in number of transactions
                                        within district:                   8.0%: Change in average transaction value
                                        $110,943,852                       $45.89: Average transaction value

                                                                                                                                                      Source: MarketView 33
Retail: South Taranaki district barometer
12 months ending December 2020 compared to December 2019

        South Taranaki district percentage change in district spend year-ending December 2020

                                             Cafes, Restaurants,   Department stores &                                            Home, Hardware &     Other Customer
        Accommodation   Apparel & Personal    bars & takeaways           Leisure         Fuel & Automotive   Groceries & liquor      Electrical           Spending
 25%                                                                                                                                   20.6%
 20%
 15%                                                                                                              13.2%
            11.3%
 10%
  5%
  0%
  -5%                                                                    -0.6%

 -10%                                              -6.5%                                      -5.9%
 -15%
 -20%                                                                                                                                                     -15.3%

 -25%                        -20.8%

                                                                           4.8%: Change in spend
                                       Retail spend                        -4.0%: Change in number of transactions
                                      within district:                     9.2%: Change in average transaction value
                                      $242,532,641                         $41.73: Average transaction value

                                                                                                                                                     Source: MarketView   34
Visitor

          35
Visitor spend by region
Percentage change in total spend – YE December 2020

  5%

                                                                                                                 1%
                                                                                                            0%
  0%

                                                                                                  -1%
                                                                                           -2%
 -5%

                                                                                  -6%
                                                                            -7%
                                                                      -8%
 -10%                                                           -9%
                                                         -10%
                                                  -12%
                                           -13%
 -15%
                                    -15%
                             -17%
 -20%                 -19%
                                                                                             Average
               -23%                                                                     nights stayed per
 -25%
                                                                                              guest
                                                                                           in Taranaki
 -30%   -29%                                                                                   2.2

 -35%

                                                                                                        Source: MBIE TECT, ADP   36
Visitor spend by district
Annual visitor spend in Taranaki 2018-2020
$250m

$200m
                                                                             The Tourism Electronic Card Transactions (TECTs) have been established by MBIE as
                                                                             an interim replacement for the MRTEs. Due to complications from COVID-19, the
$150m                                                                        MRTEs are no longer useable.

$100m                                                                        The TECTs instead aim to present the measured electronic card transactions (ECT)
                                                                             attributable to tourism. The TECT data is provided by Marketview, who use a base of
                                                                             ECT spending from the Paymark network (approximately 70 per cent of total ECT
$50m
                                                                             spend) to estimate total ECT spend.

 $0m                                                                         For more information about TECT and the methodology used, click here. 9
              2018                        2019                        2020

               New Plymouth         South Taranaki        Stratford

Visitor spend percentage change – year ending Dec 2020
  4.00%                           2.88%

  2.00%
                                                                               Visitor spend increased by 2.9% in South Taranaki, while decreasing in other parts
  0.00%                                                                        of the region, most notably in Stratford by 8.26%.
 -2.00%
                                                               -1.84%          The smaller sample size in Stratford, particularly with the switch to TECT
                     -2.33%
 -4.00%                                                                        measures, means this percentage change should be interpreted with caution.
 -6.00%                                                                        Raw figures show Stratford has lost approximately $1m in tourism dollars,
                                                                               compared with a loss of $4m in New Plymouth and a gain of $1m in South
 -8.00%                                                                        Taranaki.
                                                 -8.26%
-10.00%

          New Plymouth        South Taranaki       Stratford     Taranaki
                                                                                                                                                                    37
                                                                                                                                           Source: MBIE TECT
Visitor spend by product
Domestic and Other visitor spend 2018-2020

            Visitor spend in Taranaki ($millions)
  $215m                                                                      Despite borders being closed for most of 2020, there is still
  $210m                                                                      a notable international visitor spend (noted in the data as
  $205m                                                                      ‘other’). This is because the spend is based on card
  $200m                                                                      transactions from cards issued outside New Zealand. This is
                                    $29m                      $19m
  $195m    $26m
                                                                             likely to include long-term visitors, migrant workers,
  $190m                                                                      international students and other non-residents based in
  $185m                                                                      New Zealand during 2020.
  $180m
  $175m                                                       $188m
           $183m                    $183m                                    As can be seen in the breakdown of international vs
  $170m
                                                                             domestic spend, the loss of international spend has been
  $165m
            2018                      2019                     2020          mitigated to a large extend in Taranaki by increases in
                                                                             domestic spend.
                           Domestic      Other

           Total visitor spend by region ($millions)
$3,000m

$2,500m

$2,000m
                                                                                               Total guest nights in
$1,500m
                                                                                                   commercial
$1,000m
                                                                                                accommodation in
 $500m                                                                                           Taranaki during
   $0m                                                                                            January 2021
            2018                        2019                          2020
                                                                                                     121,300
              Taranaki   Auckland      Bay of Plenty   Whanganui

                                                                                                                     Source: MBIE TECT, ADP   38
Visitor spend by product
International and domestic visitor spend 2018-2020

                            Domestic visitor spend in Taranaki by product
                               Retail sales - other
Retail sales - fuel and other automotive products
       Retail sales - alcohol, food, and beverages                                                                                         $183m
                                                                                                                         $188m
                         Other tourism products
                      Other passenger transport
             Food and beverage serving services
      Cultural, recreation, and gambling services
                        Accommodation services

                                                      $0m     $10m          $20m     $30m      $40m    $50m       $60m           2019   2020
                                                            2020     2019

                              Other visitor spend in Taranaki by product 9
                               Retail sales - other
Retail sales - fuel and other automotive products
                                                                                                                         $19m
       Retail sales - alcohol, food, and beverages
                         Other tourism products                                                                                                $29m
                      Other passenger transport
             Food and beverage serving services
      Cultural, recreation, and gambling services
                        Accommodation services

                                                      $0m   $1m    $2m      $3m    $4m   $5m   $6m    $7m   $8m   $9m            2019   2020
                                                            2020     2019                                                           Source: MBIE TECT   39
Transport Movements

                      40
New Plymouth Airport
                                                                                Monthly passenger movements through New
                                                                                            Plymouth Airport
                                                                      35000
Traffic through the New Plymouth Airport has not quite
                                                                      30000
reached the pre COVID-19 numbers, however from October
onwards there has been a consistent number of passengers.             25000
                                                                      20000
With travel increasingly becoming safer and a Trans-Tasman            15000
travel bubble approved for late April, the number of
                                                                      10000
passenger movements through New Plymouth Airport is
forecasted to remain at a healthy level.                               5000
                                                                            0

           Where travellers through New Plymouth Airport are
            going / coming from (June 2020 – March 2021)
  60.00%
                                                                                      With very little international travel being feasible in
                                                                                      2020, New Zealanders have been encouraged to visit
  50.00%                                                                              our own back yard. The majority of travelers outbound
  40.00%                                                                              from New Plymouth went to Auckland (50.3%),
  30.00%
                                                                                      followed by Wellington (28.3%) and lastly Christchurch
                                                                                      (21.4%).
  20.00%

  10.00%

   0.00%
                 Auckland                 Wellington         Christchurch

                                Inbound      Outbound

                                                                                                       Source: New Plymouth Airport, Statistics NZ   41
Heavy traffic flows – Taranaki region
 160

 140

 120

 100

  80

  60

  40

  20

    0
  1 Jan 2020        1 Mar 2020        1 May 2020          1 Jul 2020        1 Sep 2020         1 Nov 2020         1 Jan 2021       1 Mar 2021

       Heavy Traffic flows have increased towards the tail end of 2020. Before September 2020, the heavy traffic flow rating hadn’t surpassed
       the 100 mark since March 2020. However, after this date we have only been below this benchmark during the Christmas and New Years
       periods.

                                               Heavy traffic flows source: NZTA and Infometrics: an index of heavy traffic flows passing monitored
                                               sites within a defined location/area, averaged over 7 days and indexed to 1 February 2020.            42
Electric Vehicle registrations in Taranaki
               350
                                                                                                                       315

               300

               250

               200

               150

               100

                50

                 0
                     Jan     Apr      Jul      Oct   Jan    Apr     Jul     Oct     Jan     Apr     Jul      Oct     Jan
                                    2018                          2019                            2020              2021

   As advised by many global experts and New Zealand’s own Climate Change Commission, electric vehicles (EVs) are very quickly
   becoming the new normal in the car world. The Climate Change Commission draft advice predicts that in 2035 petrol and diesel
   prices will increase by up to 30 cents and the total cost of travel, including petrol and vehicle maintenance will continue to rise
   for an average household. Its draft advice estimates that by 2035, 40% of the entire light vehicle passenger fleet will need to be
   electric to meet New Zealand’s climate change targets.

   In Taranaki there has been a steady growth in EV and Hybrid registrations with 315 as of February 2021, however this is
   approximately only 0.3% of the total light vehicle fleet in Taranaki*.

  *Based on MoT total fleet numbers for 2019
                                                                                                                                          43
                                                                                                          Source: Ministry of Transport
Enterprise

             44
New Businesses registered in Taranaki

            New Businesses Added to Company Register
                                                                                 •   Entrepreneurship remained healthy in Taranaki
120
                                                                                     throughout 2020, with 245 new businesses added to
100                                                                                  the company register in the December quarter. For
                                                                                     the year as a whole, Taranaki had 948 new
 80                                                                                  businesses, an increase of over 100 businesses when
 60                                                                                  comparing to 2019.
 40                                                                              •   Between October and December 2020 new
 20                                                                                  businesses came in a range of different industries,
                                                                                     with most being Rental, Hiring and Real Estate
  0                                                                                  Services (14.8%), followed by Financial and Insurance
      Jan    Feb   Mar   Apr   May    Jun    Jul   Aug   Sep   Oct   Nov   Dec       Services (13.9%) and Construction Businesses
                                                                                     (13.5%).
                                     2019   2020

                                                                                 •   Flow on impacts from COVID-19 caused 2020 to be
            Businesses Removed from Company Register                                 a more difficult year than anticipated for many of
                                                                                     Taranaki’s Businesses. However, while overall in
180                                                                                  2020, Taranaki saw the closure of 462 businesses,
                                                         162
160                                                                                  this was only 24 more than the 438 businesses
140
                                                                                     removed from the companies register in 2019. The
                                                                                     number of businesses that closed in Taranaki was
120                                                                                  lower than the New Zealand average.
100
 80
                                                                                 •   As had been anticipated, business deaths spiked to
                                                                                     their highest in September (162 closures)
 60                                                                                  immediately following the end of some aspects of
 40                                                                                  the government’s extraordinary support, including
 20                                                                                  ‘safe harbour’ protection for directors of businesses
                                                                                     facing liquidity problems.
  0
      Jan    Feb   Mar   Apr   May    Jun    Jul   Aug   Sep   Oct   Nov   Dec

                                     2019   2020                                       Source: Benje Patterson – People and Places 45
Venture Taranaki startup clinics
                                                                                                                                                                                                                                                                                                                                                              Startup clinic
 Attendance at Venture Taranaki’s free startup clinics increased by 48% for the quarter ending March 2021                                                                                                                                                                                                                                                    attendance up
 compared to the same period in 2020.                                                                                                                                                                                                                                                                                                                        48% on March
                                                                                                                                                                                                                                                                                                                                                                  2020
 Attendance reached an all-time high in July 2020, with 35 people attending clinics throughout the region
 (compared to 19 in July 2019).

 Clinics continued throughout 2020, including during Level 4 lockdown. These were conducted remotely by
 advisers working from home.
                                                                                                Startup clinic attendees in Taranaki 2018-2021
 40

 35

 30

 25

 20

 15

 10

  5

  0
                                                                     Aug-18
                                                                              Sep-18

                                                                                                                                                                                 Aug-19
                                                                                                                                                                                          Sep-19

                                                                                                                                                                                                                                                                                             Aug-20
                                                                                                                                                                                                                                                                                                      Sep-20
               Feb-18

                                                                                                                           Feb-19

                                                                                                                                                                                                                                       Feb-20

                                                                                                                                                                                                                                                                                                                                                   Feb-21
      Jan-18

                                                            Jul-18

                                                                                       Oct-18

                                                                                                                  Jan-19

                                                                                                                                                                        Jul-19

                                                                                                                                                                                                   Oct-19

                                                                                                                                                                                                                              Jan-20

                                                                                                                                                                                                                                                                                    Jul-20

                                                                                                                                                                                                                                                                                                               Oct-20

                                                                                                                                                                                                                                                                                                                                          Jan-21
                        Mar-18

                                                                                                                                    Mar-19

                                                                                                                                                                                                                                                Mar-20

                                                                                                                                                                                                                                                                                                                                                            Mar-21
                                 Apr-18

                                                   Jun-18

                                                                                                                                             Apr-19

                                                                                                                                                               Jun-19

                                                                                                                                                                                                                                                         Apr-20

                                                                                                                                                                                                                                                                           Jun-20
                                          May-18

                                                                                                         Dec-18

                                                                                                                                                      May-19

                                                                                                                                                                                                                     Dec-19

                                                                                                                                                                                                                                                                  May-20

                                                                                                                                                                                                                                                                                                                                 Dec-20
                                                                                                Nov-18

                                                                                                                                                                                                            Nov-19

                                                                                                                                                                                                                                                                                                                        Nov-20
                                                                                                                  New Plymouth                                 Stratford District                                South Taranaki

                                                                                                                                                                                                                                                                                                               Source: Venture Taranaki                                   46
Looking ahead
We have been fortunate in that we have not suffered the extremes of
some other regional economies, due to the strength of our
agriculture and food production industry and because our visitor
sector is less exposed to the international market.
Retail spend is rebounding as people support local, and the
construction industry is now busy. Our housing market, like others
nationally, is running hot. The regional job market, whilst not
experiencing the significant levels of unemployment initially feared, is
proving a mixed bag. Job seeker registrations remain at heightened
levels, and the unemployment rate is up, yet at the same time the job
market shows increases in employment and skill shortages in certain
industries, such as construction.
As we look ahead, whilst we have strong reasons for positivity,
beneath the surface COVID-19 has further extended the inequality
gap for our lower socioeconomic communities and families and has
compounded impacts on health and housing. Furthermore, as
economic activity rekindles, growth is becoming increasingly
hampered by global supply chain and logistical disruption, which in
turn is disrupting access to products and parts.
With the opening of the Trans-Tasman travel bubble, the visitor
market will gradually build. However, beyond COVID-19 there are
important broader policy and economic challenges that will come to
the fore. These include the shift towards a low-emissions economy,
and the Government’s response to the final advice due from the
Climate Change Commission in May 2021. There are many moving
parts which affect our region as we continue to respond in the face of
change.
                                                                                47
                                                                           Photo credit: Rob Tucker
Notes
1.   As census surveys are only undertaken every 5 years, population estimates are forecasts made by Statistics
     New Zealand based on Census data.

2.   GDP captures all production within an economy. This includes consumption spending, government spending,
     investment and exports. All Infometrics GDP and sector statistics are estimates derived from official Statistics
     New Zealand data.

3.   Filled jobs include paid employees measured by business employment data. The difference between the
     count of filled jobs and paid employees can be attributed to factors like additional jobs held by multiple job
     holders and jobs filled by employees not within the usual resident population. Total employed persons also
     include some people who aren’t included in the filled job counts, such as employers, self-employed people
     without employees, and unpaid family workers.

4.   NEET Rates account for young people aged 15–24 years who are unemployed (part of the labour force) and
     not engaged in education or training, and those not in the labour force and not engaged in education or
     training for many reasons, as a proportion of the total youth working-age population. School leavers and
     students on long breaks can add to this statistic.

5.   Unemployment rates record all people in the working-age population who were without a paid job, available
     for work, and had either actively sought work in the past four weeks ending with the reference week or had a
     new job to start within the next four weeks. If someone is without work but no seeking employment, they do
     not count towards the unemployment rate.

6.   Housing values are provided by Infometrics who sources their data from QVNZ. Values given are the average
     (mean) value of all developed residential properties in the area based on the latest house value index from
     QVNZ. It is not an average or median sales price, as both of those figures only measure what happens to have
     sold in the period. These average current values are affected by the underlying value of houses (including
     those not on the market) and are quality adjusted based on the growth in each house’s price between sales.

7.   Housing Affordability uses a different scale to rental affordability as rental affordability is showing average
     weekly rental payments as a proportion of average weekly income while housing affordability shows the
     ratio of the average current house value to average household income.

8.   Retail data reflects spend by EFTPOS and credit cards in Taranaki retail outlets. Retail outlets reflect the
     defined categories displayed in these charts. The analysis, commissioned by Venture Taranaki, excludes cash
     and non-retail outlets.

9.   The Tourism Electronic Card Transactions (TECTs) aim to present the measured electronic card transactions
     (ECT) attributable to tourism but without any attempt to represent the total spend. This method is
     considered to be the best way to provide spend data to the industry while travel is severely affected by
     COVID-19 border restrictions. But users need to be aware of the limitations of this approach as this does not
     account for cash spend or pre-purchase spending. International visitor numbers include anyone who makes
     ECTs with an international card. This is noted in the data as “Other”. This estimated total ECT spend is then
     filtered for tourism spend by visitors in New Zealand. Domestic tourism spend is classified as spend that is
     more than 40km outside their usual place of residence.

                                                                                                                        48
Taranaki’s Regional Development Agency

25 Dawson Street
New Plymouth 4310 New Zealand
T: +64 6 759 5150
E: info@venture.org.nz

www.taranaki.info
You can also read