Investment Themes Capital Markets Strategy Group - Borthwick Associates, Inc

 
CONTINUE READING
Investment Themes Capital Markets Strategy Group - Borthwick Associates, Inc
Investment Themes
       Capital Markets Strategy Group

 Not FDIC Insured  May Lose Value  No Bank Guarantee

For Investors
Investment Themes Capital Markets Strategy Group - Borthwick Associates, Inc
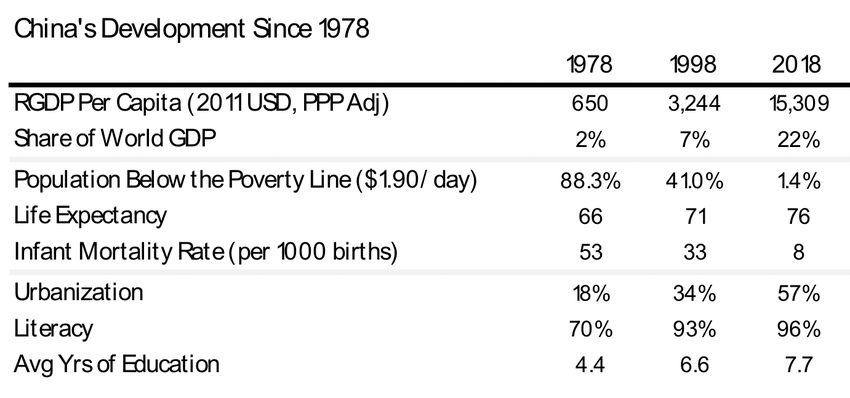
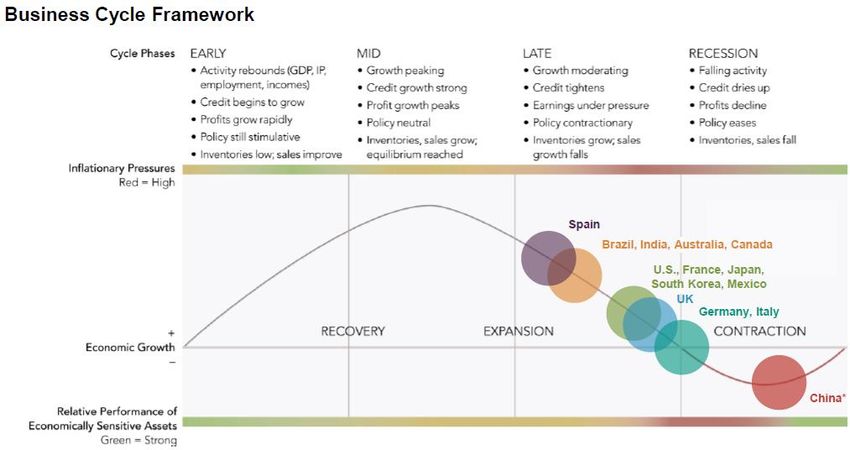
Mature U.S. and Global Business Cycles

    Note: The diagram above is a hypothetical illustration of the business cycle. There is not always a chronological, linear progression among the
    phases of the business cycle, and there have been cycles when the economy has skipped a phase or retraced an earlier one. * A growth
    recession is a significant decline in activity relative to a country’s long-term economic potential. We use the “growth cycle” definition for most
    developing economies, such as China, because they tend to exhibit strong trend performance driven by rapid factor accumulation and
    increases in productivity, and the deviation from the trend tends to matter most for asset returns. We use the classic definition of recession,
    involving an outright contraction in economic activity, for developed economies. Source: Fidelity Investments (AART), as of 9/30/19.

2    For Investors
Investment Themes Capital Markets Strategy Group - Borthwick Associates, Inc
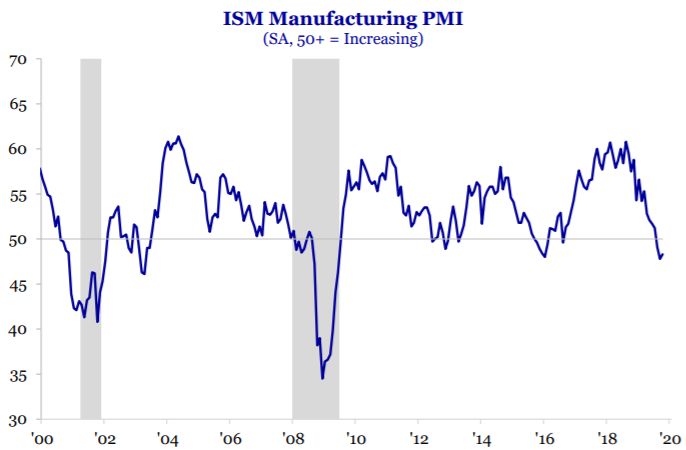
How these trade uncertainties could play out could be critical to
    what is next            S&P 500 Performance
                                                                                                                                                               Trade truce
                                                                                    (1/1/17 – 11/07/19)
                                                                                                                                                         (growth reacceleration)

                                          Trump Davos
                                                                                                                                                    Trade Uncertainty continues
                                             Speech
                                                                                                    S&P 500                                            (Economies muddle through)

                                                                                                                                                                Trade war
                                                                                                                                                    (More tariffs & possible recession)

                                                                                           US Govt 10 Yr Yield

     Synchronized Global                                                           Trade Uncertainties
          Recovery                                                                 (Negotiations continue)

    Past performance is no guarantee of future results. It is not possible to invest directly in an index. All market indices are unmanaged. Index performance is not meant to
    represent that of any Fidelity mutual fund.
    Source: Factset, as of 11/07/2019

3   For Investors
Investment Themes Capital Markets Strategy Group - Borthwick Associates, Inc
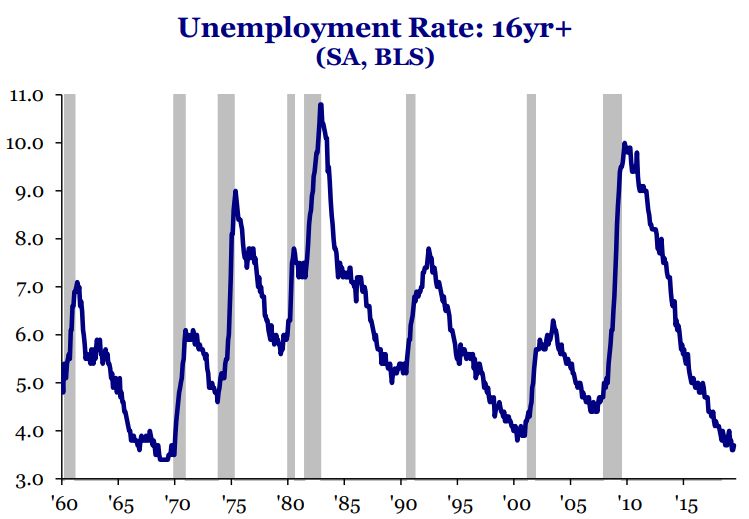
What does late cycle imply from a Macro & Asset market
perspective?

                                            Fed cuts rates/
                                          Yield curve flattens

    Source: Fidelity Investments (AART)

4   For Investors
Investment Themes Capital Markets Strategy Group - Borthwick Associates, Inc
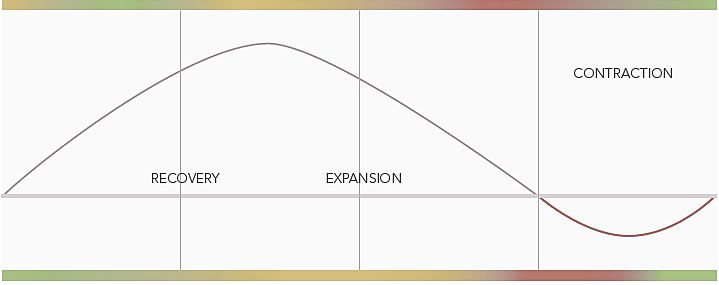
Late Cycle: Less Favorable Risk-Return Profile but still
    potentially positive!
    Asset Class Performance in Mid- and Late-Cycle Phases (1950–2010)
     Stocks         High Yield         Commodities           Investment-Grade Bonds

    20%

    10%

     0%
                                                    Mid                                                                                    Late

            Mid Cycle: Strong Asset Class Performance                                               Late Cycle: Mixed Asset Class Performance
            • Consider economically sensitive assets                                                • Consider inflation-resistant assets
            • Broad-based gains                                                                     • Gains more muted

     TIPS: Treasury Inflation-Protected Securities. Past performance is no guarantee of future results. Asset class total returns are represented
     by indexes from the following sources: Fidelity Investments, Morningstar, and Bloomberg Barclays. Fidelity Investments source: a proprietary
     analysis of historical asset class performance, which is not indicative of future performance.
5   For Investors
Normal volatility means…..

    Equity market corrections occurring at a normal frequency:
       • Three corrections per year greater than 5%.
       • One correction per year greater than 10%.
       • One correction every three years greater than 20%.

    Fixed income returns may likely be modest and potentially positive.

    Fixed income securities may provide diversification benefits and act as a cushion
    against equity market volatility.

    Diversification does not ensure a profit or guarantee against a loss

6    For Investors
But for now, to fit both dynamics into your portfolio construction
   a "Barbell" approach may be worth considering

                                           Risk –Off – A full blown
             Risk On - A resolution of
                                           trade war or prolonged
             the uncertainties
                                           uncertainties could lead to
             regarding future trade
                                           an economic slowdown or
             policy could lead to a
                                           even a recession (other
             resumption of global
                                           issues to worry: Fed
             economic expansion.
                                           Policy, China slowdown)

7 For Investors
ASSET MARKETS
    Stocks’ Return Profile Less Favorable During Late Cycle
    Historically, this phase of the business cycle has had implications for asset market forward returns. When the
    U.S. economy has been in the mid-cycle phase, forward 12-month real returns have been generally positive,
    displaying a favorable distribution skewed to above-average returns. But as expansion matures into late cycle,
    the forward distribution of real equity returns has typically displayed a less favorable, more negative skew.

    Subsequent Stock Market Returns Given Business Cycle Phase (1952–2018)
        Late     Mid
    Frequency

    4

    3

    2

    1

    0
    -48% -43% -38% -33% -29% -24% -19% -14% -10%                                       -5%       0%       5%       9%      14%      19%      24%          28%   33%   38%   43%
                                                                              Total Return over the Next 12 Months

    Past performance is no guarantee of future results. The above charts are density plots generated from the 12-month forward returns of a U.S. Equity
8   Index sourced from Fidelity Investments. Source: Standard & Poor’s, Fidelity Investments (AART), as of 9/30/19.
With trade truce (our base case), business cycle could elongate
as the U.S. consumer trends are still in very good shape
          Unemployment is historically low…                    …U.S. Consumers will likely benefit from lower oil prices and…

                                                                           Source: Factset , as of 11/07/19
    Source: Strategas, 08/01/2019

       …housing is improving due to a reprieve in interest rates                              Personal savings has improved
                                                                                   Personal saving as % of disposable personal income

                                                                   12.0
                                                                   10.0
                                                                     8.0
                                                                     6.0
                                                                     4.0
                                                                     2.0
                                                                     0.0
                                                                           2000Q1
                                                                           2000Q4
                                                                           2001Q3
                                                                           2002Q2
                                                                           2003Q1
                                                                           2003Q4
                                                                           2004Q3
                                                                           2005Q2
                                                                           2006Q1
                                                                           2006Q4
                                                                           2007Q3
                                                                           2008Q2
                                                                           2009Q1
                                                                           2009Q4
                                                                           2010Q3
                                                                           2011Q2
                                                                           2012Q1
                                                                           2012Q4
                                                                           2013Q3
                                                                           2014Q2
                                                                           2015Q1
                                                                           2015Q4
                                                                           2016Q3
                                                                           2017Q2
                                                                           2018Q1
                                                                           2018Q4
                                                                   Source: U.S. Bureau of Economic Analysis (2000 Q1 – 2019 Q2)
    Source: Strategas,11/04/2019
9
    For Investors
But if trade uncertainties linger, the weakness currently seen
     on the business side could spill over to the consumer
             Manufacturing remains under pressure...             …while Business sentiment softened…

     Source: Strategas, 11/01/2019                      Source: Strategas, 11/04/2019

                     …Capex plummeted…                           …& Non-residential construction restrained

                                                       Source: Strategas, 11/04/2019
     Source: Strategas, 07/26/2019
10
     For Investors
Yield Curve Inversion Typical During Late Cycle

                                                                                                                                                                                     ECONOMY
    Ten-year Treasury bond yields remained below 3-month Treasuries, keeping the yield curve inverted. Curve
    inversions have preceded the past seven recessions and may be interpreted as the market signaling weaker
    expectations relative to current conditions. The time between inversion and recession has varied considerably,
    however, and the curve also has flashed two “head fakes” in which expansion lasted for at least two more years.

    U.S. Treasury Yield Curve
          10-Year Minus 3-Month Yield
    Yield Spread
    6%

    5%                                                                                                                                              Yield Curve Inversions
    4%                                                                                                                                              • Occurred before the last 7
                                                                                                                                                      recessions
    3%
                                                                                                                                                    • Occurred twice without a
    2%                                                                                                                                                recession (1966,1998)
    1%                                                                                                                                              • Recessions started 4 to 21
                                                                                                                                                      months after inversion
    0%
                                                                                                                                                    • Un-inversions often occurred
   -1%                                                                                                                                                prior to recession
   -2%

   -3%

   -4%                                                                                                                                        0.1
         1965

                1968

                       1971

                              1974

                                     1977

                                            1980

                                                   1983

                                                          1986

                                                                 1989

                                                                        1992

                                                                               1995

                                                                                      1998

                                                                                             2001

                                                                                                    2004

                                                                                                           2007

                                                                                                                  2010

                                                                                                                         2013

                                                                                                                                2016

                                                                                                                                       2019

   Shading represents U.S. economic recession as defined by the National Bureau of Economic Research (NBER). Source: Bloomberg
11 Financial L.P., NBER, Fidelity Investments (AART), as of 9/30/19.
Equities and Sector Opportunities

12   For Investors
Corporate Earnings

   Source: Factset
13 For Investors
Valuations
                                             CURRENT P/E VS. 20-YEAR AVERAGE P/E
                                             (Below 100% Undervalued Relative To Long Term Average)

                                                               Value                              Blend                           Growth

                            Large-Cap                          108%                                114%                             123%

                            Mid-Cap                            104%                                108%                             125%

                            Small-Cap                           95%                                111%                             152%

   Source: Current - FactSet Market Aggregates, Russell Investments. 20yr- FactSet Market Aggregates historical data, P/E ratios are calculated
   based on FMA consensus estimates of earnings over the next twelve months (NTM). P/E (price/earning) Ratio: A valuation ratio of a company’s
   current share price compared to its per-share earnings. As of 10/31/19.

14 For Investors
Long term we are still in a secular bull market that started in
   2013
                DJ Industrial Average
                                                                                                                                                              Peak to Next
     100,000                                                                                                                                                  Secular Bull
                                                                                                                                                              2001–2013?

      10,000                                                                                                    Peak to Next
                                                                                                                Secular Bull
                                                                                                                1969–1982

                                                       Peak to Next
       1,000
                                                       Secular Bull
                                                        1929–1942

         100

           10
                1900   1905   1910    1916   1921    1927    1932    1937    1943    1948   1953    1959     1964   1970   1975   1980   1986   1991   1996   2002   2007   2012   2018

   Source: Factset as of 12/31/2018
   Past performance is no guarantee of future results. It is not possible to invest directly in an index..

15 For Investors
ASSET MARKETS
    Business-Cycle Approach to Equity Sectors
    A disciplined business-cycle approach to sector allocation can generate active returns by favoring industries
    that may benefit from cyclical trends. Economically sensitive sectors historically have performed better in the
    early and mid-cycle phases of an economic expansion. Meanwhile, companies in defensive sectors that have
    more stable earnings have tended to outperform late in the cycle and particularly during recessions.

    Business-Cycle Approach to Sectors
                                                    EARLY CYCLE                           MID CYCLE                       LATE CYCLE                         RECESSION
      Sector
                                                      Rebounds                              Peaks                          Moderates                          Contracts

           Financials                                      +
           Real Estate                                    ++                                                                                                     --
           Consumer Discretionary                         ++                                   -                                 --
           Information Technology                          +                                   +                                 --                              --
           Industrials                                    ++                                                                                                     --
           Materials                                       +                                   --                               ++
           Consumer Staples                                                                                                     ++                              ++
           Health Care                                     --                                                                   ++                              ++
           Energy                                          --                                                                   ++
           Communication Services                                                              +                                                                 -
           Utilities                                       --                                  -                                 +                              ++
                                              Economically sensitive sectors         Making marginal portfolio        Defensive and inflation-     Since performance is generally
                                              may tend to outperform, while       allocation changes to manage       resistance sectors tend to        negative in recessions,
                                               more defensive sectors have          drawdown risk with sectors       perform better, while more     investors should focus on the
                                                tended to underperform.             may enhance risk-adjusted              cyclical sectors           most defensive, historically
                                                                                     returns during this cycle.            underperform.                    stable sectors.

   Past performance is no guarantee of future results. Sectors as defined by GICS. White line is a theoretical representation of the business cycle as it
   moves through early, mid, late, and recession phases. Green and red shaded portions above respectively represent over- or underperformance
   relative to the broader market; unshaded (white) portions suggest no clear pattern of over- or underperformance. Double +/– signs indicate that the
   sector is showing a consistent signal across all three metrics: full-phase average performance, median monthly difference, and cycle hit rate. A single
   +/– indicates a mixed or less consistent signal. Returns data from 1962 to 2016. Source: Fidelity Investments (AART), as of 6/30/19.
16 For Investors
Healthcare – Favorable Demographics
     Aging demographics is a global phenomenon…in the U.S., approximately 10,000
     people turn 65 every day

     Source: Top & Bottom left: JP Morgan, Center for Medicare and Medicaid Services, Census Bureau as of 11/30/17;
     Right chart: World Bank as of 12/31/15.

17   For Investors
A trade resolution could be much more beneficial to the
rest of the world
                                                              EXPORTS AS A SHARE OF GDP
                                                            GOODS & SERVICES EXPORTS, 2017

                                            Canada                                       Exports to U.S.
                                                                                         Exports to EU
                                                UK
                                                                                         Exports to EM ex. China
                                         Euro Area                                       Exports to China
                                                                                         Exports to Other
                                              Japan

                                               U.S.

                                            Taiwan

                                         South Africa

                                             Korea

                                            Mexico

                                             Russia

                                              China

                                               India

                                              Brazil

                                                       0%              20%         40%                     60%

     Source: Strategas / International Monetary Fund (IMF) DOTS As of 09/30/2018

18   For Investors
China’s Policies Could Be Supportive of Global Growth for 2019
        KEY: ⚫ U.S. ⚫ China

                   Cycle Phases       EARLY                  MID                  LATE                 RECESSION
          Inflationary Pressures                                                                                                                             China Stimulus % GDP
                      Red = High                                     Q1        Q3
                                                                                    Q4 Q1
                                                                                                                                                                2019:    3.0% e
                                                                      Q2                                                                  3.5
                                                                                              March 2019                                                                            More Than 2016!
                                                                       Q4–Q3                                                                          Tax    Spending
                                                                                                                                          3.0
                            +
              Economic Growth                                                                                                             2.5
                            –
     Relative Performance of                                                                                                              2.0
Economically Sensitive Assets
               Green = Strong                                       2016-2017 2018 2019
                                                                                                                                          1.5

                  Cycle Phases       EARLY                  MID                 LATE                  RECESSION                           1.0
         Inflationary Pressures                     Q3–Q4 2017
                     Red = High                                                Q1 2018
                                                 Q2 2017                                                                                  0.5
                                            Q1
                                                                                           Q2–Q3 2018
                                                                                                                                          0.0
                                                                                                  Q4 2018
                                                                                                         CONTRACTION
                           +                                                                                                             -0.5
             Economic Growth                                                                                                                          15         16                   18        19
                                      Q4                                                       Q1 2019                                                                      17
                           –
     Relative Performance of                                                                Q1–Q2 2016                  March 2019
Economically Sensitive Assets
               Green = Strong                              2017                     2018              2019       2016

        Note: The diagram above is a hypothetical illustration of the business cycle. There is not always a chronological, linear progression among the phases of the business cycle, and
        there have been cycles when the economy has skipped a phase or retraced an earlier one. * A growth recession is a significant decline in activity relative to a country’s long-term
        economic potential. We use the “growth cycle” definition for most developing economies, such as China, because they tend to exhibit strong trend performance driven by rapid
        factor accumulation and increases in productivity, and the deviation from the trend tends to matter most for asset returns. W e use the classic definition of recession, involving an
        outright contraction in economic activity, for developed economies.
        The diagram above is a hypothetical illustration of the business cycle. There is not always a chronological, linear progression among the phases of the business cycle, and there
        have been cycles when the economy has skipped a phase or retraced an earlier one. Source: Fidelity Investments (AART) using quarter business cycles from Q1 2016 – Q1
        2019. Source for right Chart: Factset, National Bureau of Statistics of China, Caixin, Cornerstone Macro as of 12/31/18.
        For Investors
   19
International Equities – Valuations look attractive
     U.S. Equities open unprecedented gap with Non-U.S.

     $1,200,000

     $1,000,000

      $800,000

      $600,000

      $400,000

      $200,000

              $-
                      12/1972
                      02/1974
                      04/1975
                      06/1976
                      08/1977
                      10/1978
                      12/1979
                      02/1981
                      04/1982
                      06/1983
                      08/1984
                      10/1985
                      12/1986
                      02/1988
                      04/1989
                      06/1990
                      08/1991
                      10/1992
                      12/1993
                      02/1995
                      04/1996
                      06/1997
                      08/1998
                      10/1999
                      12/2000
                      02/2002
                      04/2003
                      06/2004
                      08/2005
                      10/2006
                      12/2007
                      02/2009
                      04/2010
                      06/2011
                      08/2012
                      10/2013
                      12/2014
                      02/2016
                      04/2017
                      06/2018
                      08/2019
                                                                           S&P 500               MSCI World ex US

     Source: Morningstar as of 10/31/19. Past performance is no guarantee of future results. It is not possible to invest directly in an index. Index
     performance is not meant to represent that of any Fidelity mutual fund. US equities are represented by the S&P500. Global equities ex-US is a
     custom Global Financial Data World Index.
20
      For Investors
ASSET MARKETS
    Equity Valuations Mixed Relative to History
    Continued rising stock prices in the U.S. moved equity valuations higher during Q3, pushing them further
    above their long-term historical average. Price-to-earnings (P/E) ratios for Non-U.S. developed and emerging
    markets remained below their long-term averages.

    Global Market P/E Ratios
          DM Trailing P/E            EM Trailing P/E            U.S. Trailing P/E          Forward P/E

    Ratio

    30

    25

                                                                                                                                                                       Forward
                                                                                                                                                                         P/E
    20                                                                       DM Long-Term Average

                                                                             U.S. Long-Term Average
                                                                                                                                                                           U.S.
                                                                             EM Long-Term Average
    15
                                                                                                                                                                           DM
                                                                                                                                                                           EM
    10

      5
       2004       2005       2006      2007       2008       2009       2010       2011      2012       2013       2014       2015       2016      2017      2018   2019

   DM: Developed Markets. EM: Emerging Markets. Past performance is no guarantee of future results. It is not possible to invest directly in an index. All
   indexes are unmanaged. See Appendix for important index information. Price-to-earnings ratio (P/E): stock price divided by earnings per share. Also
   known as the multiple, P/E gives investors an idea of how much they are paying for a company’s earnings power. Long-term average P/E for Emerging
   Markets includes data for 1988–2017. Long-term average P/E for Developed Markets includes data for 1973–2016, U.S. 1926–2017. Foreign
21 Developed—MSCI EAFE Index, Emerging Markets—MSCI EM Index. Source: Bloomberg Financial L.P., Fidelity Investments (AART) as of 9/30/19.
Secular Forecast: Slower Global Growth, EMs to Lead
   Slowing labor force growth and aging demographics are expected to tamp down global growth over the next
   two decades. We expect GDP growth of emerging countries to outpace that of developed markets over the
   long term, providing a relatively favorable secular backdrop for emerging-market equity returns.

    Real GDP 20-Year Growth Forecasts vs. History
       Developed Markets                      Emerging Markets                               Last 20 Years

   Annualized Rate

  10%
                                               Global Real GDP Growth
    9%
                                    Last 20 years                                  20-year forecast
    8%
                                              2.7%                                           2.1%
    7%

    6%

    5%

    4%

    3%

    2%

    1%

    0%
                    Spain

                            Japan

                                                                                    Canada

                                                                                                                                                                        Mexico
                                                                                                    Sweden

                                                                                                                                                                                 Colombia
                                                                                                             U.S.

                                                                                                                                                                                            Peru
                                                                                                                                                    Brazil
                                    Germany

                                                Netherlands

                                                                                                                                           Turkey

                                                                                                                                                                                                   South Africa
                                                                       Australia

                                                                                              UK

                                                                                                                    South Korea
            Italy

                                                              France

                                                                                                                                                                                                                  China

                                                                                                                                                                                                                                                   Indonesia
                                                                                                                                  Russia

                                                                                                                                                             Thailand

                                                                                                                                                                                                                          Malaysia

                                                                                                                                                                                                                                                               India
                                                                                                                                                                                                                                     Philippines
   EM: Emerging Markets. GDP: Gross Domestic Product. Source: OECD, Fidelity Investments (AART), as of 5/31/18.
22 For Investors
Growth in “Middle Class” Households

                                                       NUMBER OF MIDDLE CLASS                                                                                   GROWTH OF MIDDLE CLASS
                                  450
                                                            HOUSEHOLDS                                                                                              HOUSEHOLDS
                                                       USA                        India                          China
                                                                                                                                                                         1991-2030E
                                  400
                                                       Japan                      Brazil                         Indonesia                        16%

                                                                                                                                                                                                       14.2%
                                  350
                                                                                                                                                  14%

                                  300
                                                                                                                                                  12%
 No. of Households in Millions

                                                                                                                                                                                               11.4%

                                                                                                                                                                                    10.4%
                                  250
                                                                                                                                                  10%

                                  200
                                                                                                                                                  8%

                                  150
                                                                                                                                                  6%
                                                                                                                                                                          4.7%
                                  100
                                                                                                                                                  4%

                                   50
                                                                                                                                                  2%
                                                                                                                                                                  1.1%
                                    0                                                                                                                   0.4%
                                        1991

                                               1994

                                                      1997

                                                             2000

                                                                    2003

                                                                           2006

                                                                                  2009

                                                                                           2012

                                                                                                  2015

                                                                                                         2018E

                                                                                                                  2021E

                                                                                                                          2024E

                                                                                                                                  2027E

                                                                                                                                          2030E

                                                                                                                                                  0%
                                                                                                                                                        Japan      USA    Brazil   Indonesia   India   China

   Source: Used with permission, Morgan Stanley Asia/GEMs Equity Strategy Team, 12/31/15.
23 For Investors
Chinese and India’s Middle Income Household Growth
        Provides Multiple Opportunities

      CHINA IS THE WORLD’S LARGEST AUTO MARKET AND                                                                                                                                                    INDIA IS SMALL TODAY, BUT HAS THE BEST LONG-
      IS STILL GROWING                                                                                                                                                                                TERM GROWTH POTENTIAL
                                                                                                                                                                                                            R² = 0.79
                                        25 23.6                                                                                                                                                   900
                                                                                                                                                                                                                                                                                        USA Iceland

                                                                                                                                                                                                  800
                                                                                                                                                                                                                                                  Italy                         Australia
                                        20                                                                                                                                                        700                                                               Canada
     2016 PV Sales Volume (mn) Units)

                                                                                                                                                                                                                           Poland

                                                                                                                                                                       Vehicles per 1000 people
                                                                                                                                                                                                                                 Estonia                              Finland
                                                                                                                                                                                                                                            Spain           Japan
                                                     16.0                                                                                                                                                                                                         Germany
                                                                                                                                                                                                  600                          Greece                                          Sweden
                                                                                                                                                                                                                 Bulgaria      Czech Slovenia      France      Belgium
                                        15
                                                                                                                                                                                                                                     Portugal                        Netherlands
                                                                                                                                                                                                  500                                         S Korea
                                                                                                                                                                                                                                                                                   Denmark

                                                                                                                                                                                                                 RomaniaArgentinaSlovakia
                                        10                                                                                                                                                        400                          Latvia
                                                                                                                                                                                                                Russia      Hungary
                                                                                                                                                                                                                  Brazil
                                                                                                                                                                                                  300        Serbia       Croatia
                                                                                                                                                                                                                      Malaysia Uruguay
                                                                                                                                                                                                                  Mexico
                                                                                                                                                                                                        Iran                  Chile
                                         5                  4.1
                                                                    3.4
                                                                              2.8 2.7
                                                                                                                                                                                                  200 Venezuela
                                                                                           2.0 1.9 1.8 1.8 1.5 1.5                                                                                      Morocco Ecuador Turkey
                                                                                                                   1.3 1.2 1.1                                                                            Ukraine        China
                                                                                                                                                                                                  100
                                                                                                                                                                                                               Indonesia
                                         0                                                                                                                                                        India
                                                                                                                                                        Iran
                                                            Japan

                                                                                                                                               Russia
                                                                              India

                                                                                           France

                                                                                                                                      Mexico
                                                      USA

                                                                    Germany

                                                                                      UK

                                                                                                    Brazil
                                                                                                             Italy
                                             China

                                                                                                                     Canada

                                                                                                                                                               Spain
                                                                                                                              Korea

                                                                                                                                                                                                    0
                                                                                                                                                                                                        0          10000            20000      30000        40000          50000            60000

                                                                                                                                                                                                                                       GDP per Capita (USD)

         Source: Euromonitor as of 12/31/ 2016.
24        For Investors
Long-Term Opportunity in Emerging Markets

                                       FOOD SPENDING VS. GDP PER CAPITA

                                       $7,000
  Food & Bevg Spend per capita (US$)

                                       $6,000

                                       $5,000                                                                      Japan

                                                                                                                                      U.S.A.
                                       $4,000                                                                               Germany

                                       $3,000
                                                                         Russia

                                                                Brazil
                                       $2,000

                                                            China
                                       $1,000
                                                    India

                                          $0
                                                0            10000        20000                30000                40000     50000       60000   70000
                                                                                            GDP per capita (US$)

                    Source: World Bank, USDA, Global Social Change Research Project, 2013
25 For Investors
Fixed Income

26 For Investors
Interest rate increase has been gradual
                  Interest rates are high in the U.S.

                  The rise in rates is self regulating in itself.

   Source: Top: Factset as of 11/26/19. Bottom: Factset as of 11/26/19.
27 For Investors
Unintended Consequences of Extraordinary Monetary Policy

                                                                                                                                                                                             LONG-TERM
    Starting in 2014, five major central banks, including the BOJ and ECB, enacted negative policy rates in an effort
    to boost inflation, bank lending, and economic growth. In fact, the impact of negative rates in Europe and Japan
    has run counter to the intended goals. Aging consumers raised savings rates amid lower interest income, bank
    lending stayed weak as low loan rates pressured banks’ profit margins, and inflation remained well below target.

    Negative Policy Rate Considerations                                                             Global Bank Stocks
        Intended Central                            Unintended                                              U.S.              Japan                  Europe
           Bank Goals                              Consequences                                     Price Index: June 30, 2014 = 100
                                                                                                    170
                                                    Stimulates savings                              160
               Stimulates
              consumption                            (German consumers
                                                   increased savings rate)                          150

                                                                                                    140
                                                   Hurts bank margins,
              Incentivizes                         reduces loan supply                              130
              bank lending                         (European/Japan banks
                                                        in doldrums)                                120

                                                                                                    110

             Reduces debt                       Keeping weak firms alive,                           100
             service burden                         low productivity
                                                                                                      90

                                                                                                      80

                Weakens                        Limited impact in a world of                           70
                currency                             low policy rates
                                                                                                                     Mar-15

                                                                                                                                                                  Mar-18
                                                                                                                                 Dec-15

                                                                                                                                                                           Dec-18
                                                                                                           Jun-14

                                                                                                                                            Sep-16

                                                                                                                                                         Jun-17

                                                                                                                                                                                    Sep-19
   Bank stocks represented by MSCI Financials Index at regional level in local currency. Source: Bloomberg Finance L.P., Fidelity Investments
28 (AART), as of 9/30/19.
Nominal GDP and 10- Year U.S. Treasury
   Highly Correlated

                     10-Year U.S. Treasury    GDP
               16

               14

               12

                                                                     10-Year U.S. Treasury
               10
         (%)

                8
                                                             GDP

                6

                4

                2

                0
                 6/68           6/73         6/78           6/83           6/88              6/93         6/98           6/03            6/08           6/13   6/18

   Source: Bloomberg as of 6/30/2018. GDP as of 03/31/2018. GDP data represents annualized 20-quarter percent change. Past performance is no guarantee of
   future results.

29 For Investors
Consider maintaining a core holding in investment grade
    bonds
                                   When Stocks Fall, Bonds Tend to Stabilize Portfolio Returns
                                                   Bond Returns in Years when Stocks Were Down, 1926–2018

         Stocks    Investment-Grade Bonds                 CALENDAR YEAR TOTAL RETURN (%)
         20

         10

          0

        -10

        -20

        -30

        -40

        -50
              1929 1930 1931 1932 1934 1937 1939 1940 1941 1946 1953 1957 1962 1966 1969 1973 1974 1977 1981 1990 2000 2001 2002 2008 2018

   Source: Morningstar EnCorr and Fidelity Asset Allocation Research Team (AART), as of 12/31/18. Investment-grade bond returns are represented by
   the Bloomberg Barclays (BBgBarc) U.S. Aggregate Bond Index from January 1976 and by a composite of the IA SBBI U.S. Intermediate-Term
   Government Bond Index (67%) and the IA SBBI U.S. Long-Term Corporate Bond Index (33%) from January 1926 through December 1975. Stock
   returns are represented by the performance of the S&P 500® Index. Past performance is no guarantee of future results. It is not possible to invest
   directly in an index. All market indices are unmanaged. Not intended to represent the performance of any Fidelity fund.
30 For Investors
Why Bonds Now? The Durability of Bond Returns
   Incepted in 1976, the Bloomberg Barclays U.S. Aggregate Bond Index (AGG) has had only 3 years of
   negative returns—all during a falling rate environment. Fidelity created a synthetic AGG back to 1940 that
   covers the 40-year period of rising rates from the 1940s to the 1980s. During the entire period, the worst loss
   was 3.2%.

    AVERAGE ANNUAL RETURN:                                           5.3%
                                              Annual
                                 Positive Annual      Return
                                                 Return              10-Year Treasury Yield                Negative Annual Return

                                35%

                                30%

                                25%
    Average Annual Return (%)

                                20%

                                15%

                                10%

                                5%

                                0%
                                                    -0.2% -0.6%-0.3%    -1.6%
                                                                              -0.6%
                                                                                           -1.0%                                                          -0.8%
                                                                    -2.6%                       -3.2%                                          -2.9%                              -2.0%
                                -5%
                                      1940   1944     1948   1952   1956    1960    1964      1968      1972   1976   1980    1984   1988   1992   1996     2000   2004   2008   2012     2016

       Source: Bloomberg, as of 12/31/18. Bond returns from 1940 to 1975 are based on Fidelity Investments’ “Synthetic Aggregate” represented by 67% intermediate government bonds and
       33% long-term corporate bonds. Investment-grade bond returns are represented by the Bloomberg Barclays (BBgBarc) U.S. Aggregate Bond Index from January 1976 and by a
       composite of the IA SBBI U.S. Intermediate-Term Government Bond Index (67%) and the IA SBBI U.S. Long-Term Corporate Bond Index (33%) from January 1926 through December
       1975. Past performance is no guarantee of future results. It is not possible to invest directly in an index. All market indices are unmanaged.
       Not intended to represent the performance of any Fidelity fund.

31 For Investors
Appendix -

32 For Investors
China growth dynamics over the last 40 years

    Source: https://www.linkedin.com/pulse/looking-back-last-40-years-reforms-china-ray-dalio/

   Past performance is no guarantee of future results.
33 For Investors
Important Information

   Information provided in this document is for informational and educational purposes only. To the extent any investment information in this material is deemed to
   be a recommendation, it is not meant to be impartial investment advice or advice in a fiduciary capacity and is not intended to be used as a primary basis for
   you or your client’s investment decisions. Fidelity and its representatives may have a conflict of interest in the products or services mentioned in this material
   because they have a financial interest in them, and receive compensation, directly or indirectly, in connection with the management, distribution, and/or
   servicing of these products or services, including Fidelity funds, certain third-party funds and products, and certain investment services.

   Views expressed are as of the date indicated, based on the information available at that time, and may change based on market and other conditions. Unless
   otherwise noted, the opinions provided are those of the authors and not necessarily those of Fidelity Investments or its affiliates. Fidelity does not assume any
   duty to update any of the information.

   Investment decisions should be based on an individual’s own goals, time horizon, and tolerance for risk.

   These materials are provided for informational purposes only and should not be used or construed as a recommendation of any security, sector, or investment
   strategy.

   In general the bond market is volatile, and fixed income securities carry interest rate risk. (As interest rates rise, bond prices usually fall, and vice versa. This
   effect is usually more pronounced for longer-term securities.) Fixed income securities also carry inflation, credit, and default risks for both issuers and
   counterparties. (Unlike individual bonds, most bond funds do not have a maturity date, so holding them until maturity to avoid losses caused by price volatility is
   not possible.)
   Stock markets, especially foreign markets, are volatile and can decline significantly in response to adverse issuer, political, regulatory, market, or economic
   developments.
   Foreign securities are subject to interest rate, currency exchange rate, economic, and political risks.
   Lower-quality bonds can be more volatile and have greater risk of default than higher-quality bonds.

34 For Investors
Important Information
     All indices are unmanaged and performance of the indices include reinvestment of dividends and interest income, unless otherwise noted, are not illustrative of any
     particular investment and an investment cannot be made in any index.
     S&P 500 Index is a market capitalization-weighted index of 500 widely held U.S. stocks and includes reinvestment of dividends. S&P 500 is a registered service mark
     of Standard & Poor's Financial Services LLC.
     Dow Jones Industrial Average, published by Dow Jones & Company, is a price–weighted index that serves as a measure of the entire U.S. market. The index
     comprises 30 actively traded stocks, covering such diverse industries as financial services, retail, entertainment, and consumer goods.
     MSCI EAFE Index is a market capitalization-weighted index that is designed to measure the investable equity market performance for global investors in developed
     markets, excluding the U.S. & Canada.
     MSCI Emerging Markets Index is a market capitalization-weighted index that is designed to measure the investable equity market performance for global investors in
     emerging markets.
     MSCI ACWI (All Country World Index) ex USA Index is a market capitalization-weighted index designed to measure the investable equity market performance for
     global investors of large and mid-cap stocks in developed and emerging markets, excluding the United States.
     Bloomberg Barclays U.S. Aggregate Bond is a broad-based, market-value-weighted benchmark that measures the performance of the investment grade, U.S. dollar-
     denominated, fixed-rate taxable bond market; sectors in the index include Treasuries, government-related and corporate securities, MBS (agency fixed-rate and
     hybrid ARM pass-throughs), ABS, and CMBS.
     IA SBBI U.S. Intermediate-Term Government Bond Index is an unweighted index that measures the performance of five-year maturity U.S. Treasury bonds. Each
     year, a one-bond portfolio containing the shortest non-callable bond having a maturity of not less than five years is constructed.
     IA SBBI U.S. Long-Term Corporate Bond Index is a custom index designed to measure the performance of long-term U.S. corporate bonds.

      The health care industries are subject to government regulation and reimbursement rates, as well as government approval of products and services, which could
      have a significant effect on price and availability, and can be significantly affected by rapid obsolescence and patent expirations.
      © Morningstar, Inc. All rights reserved. The information contained herein: (1) is proprietary to Morningstar and/or its affiliates; (2) may not be copied or distributed;
      (3) is not warranted to be accurate, complete, or timely. Neither Morningstar nor its content providers are responsible for any damages or losses arising from any
      use of this information. Fidelity does not review the Morningstar data. For mutual fund performance information, you should check the fund’s current prospectus for
      the most up-to-date information concerning applicable loads, fees, and expenses.

35    For Investors
Past performance is no guarantee of future results.
     Investing involves risk, including risk of loss.

      For Investors

      Not FDIC Insured. May lose value. No Bank Guarantee.

      Not NCUA or NCUSIF insured. May Lose Value. No Credit union guarantee

     Third-party trademarks and service marks are the property of their respective owners. All other trademarks and service marks are
     the property of FMR LLC or an affiliated company.

                        FIDELITY INVESTMENTS INSTITUTIONAL SERVICES COMPANY, INC., 500 SALEM STREET, SMITHFIELD, RI 02917
36    700916.28.0
You can also read