PROPOSED MERGER BUILDING A LEADER FOR A NEW ERA IN SUSTAINABLE MOBILITY - FCA Group

Page created by Richard Moody
 
CONTINUE READING
PROPOSED MERGER BUILDING A LEADER FOR A NEW ERA IN SUSTAINABLE MOBILITY - FCA Group
P RO P O S E D M E RG E R
BUILDING A LEADER FOR A NEW ERA IN SUSTAINABLE MOBILITY

                   DECEMBER 18, 2019
PROPOSED MERGER BUILDING A LEADER FOR A NEW ERA IN SUSTAINABLE MOBILITY - FCA Group
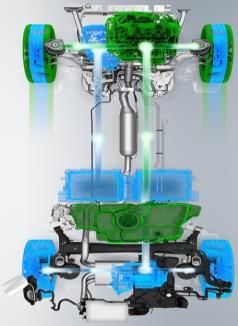
I M P O R TA N T N O T I C E

 By reading the following document, you agree to be bound by the following              An offer of securities in the United States pursuant to a business combination
 limitations and qualifications:                                                        transaction will only be made, as may be required, through a prospectus which
                                                                                        is part of an effective registration statement filed with the U.S. Securities and
 This document is for informational purposes only and is not intended to and            Exchange Commission (“SEC”). Shareholders of Peugeot S.A. (“PSA”) and Fiat
 does not constitute an offer or invitation to exchange or sell or solicitation of an   Chrysler Automobiles N.V. (“FCA”) who are U.S. persons or are located in the
 offer to subscribe for or buy, or an invitation to exchange, purchase or               United States are advised to read the registration statement when and if it is
 subscribe for, any securities, any part of the business or assets described            declared effective by the SEC because it will contain important information
 herein, or any other interests or the solicitation of any vote or approval in any      relating to the proposed transaction. You may obtain copies of all documents
 jurisdiction in connection with the proposed transaction or otherwise, nor shall       filed with the SEC regarding the proposed transaction, documents incorporated
 there be any sale, issuance or transfer of securities in any jurisdiction in           by reference, and FCA’s SEC filings at the SEC’s website at
 contravention of applicable law. This document should not be construed in any          http://www.sec.gov. In addition, the effective registration statement will be
 manner as a recommendation to any reader of this document.                             made available for free to shareholders in the United States.

 This communication is not a prospectus, product disclosure statement or other
 offering document for the purposes of Regulation (EU) 2017/1129 of the
 European Parliament and of the Council of June 14th 2017.

                                                             PSA AND FCA PROPOSED MERGER – December 18, 2019                                                           2
S A F E H A R B O R S TAT E M E N T
 This document contains forward-looking statements. In particular, these forward-looking       exposure to shortfalls in the funding of the Parties’ defined benefit pension plans; the
 statements include statements regarding future financial performance and the                  ability to provide or arrange for access to adequate financing for dealers and retail
 expectations of FCA and PSA (the “Parties”) as to the achievement of certain targeted         customers and associated risks related to the establishment and operations of financial
 metrics at any future date or for any future period are forward-looking statements.           services companies; the ability to access funding to execute the Companies’ business
 These statements may include terms such as “may”, “will”, “expect”, “could”, “should”,        plans and improve their businesses, financial condition and results of operations; a
 “intend”, “estimate”, “anticipate”, “believe”, “remain”, “on track”, “design”, “target”,      significant malfunction, disruption or security breach compromising information
 “objective”, “goal”, “forecast”, “projection”, “outlook”, “prospects”, “plan”, or similar     technology systems or the electronic control systems contained in the Companies’
 terms. Forward-looking statements are not guarantees of future performance. Rather,           vehicles; the Companies’ ability to realize anticipated benefits from joint venture
 they are based on the Parties’ current state of knowledge, future expectations and            arrangements; disruptions arising from political, social and economic instability; risks
 projections about future events and are by their nature, subject to inherent risks and        associated with our relationships with employees, dealers and suppliers; increases in
 uncertainties. They relate to events and depend on circumstances that may or may not          costs, disruptions of supply or shortages of raw materials; developments in labor and
 occur or exist in the future and, as such, undue reliance should not be placed on them.       industrial relations and developments in applicable labor laws; exchange rate
 Actual results may differ materially from those expressed in forward-looking statements       fluctuations, interest rate changes, credit risk and other market risks; political and civil
 as a result of a variety of factors, including: the ability of PSA and FCA and/or the         unrest; earthquakes or other disasters; uncertainties as to whether the proposed
 combined group resulting from the proposed transaction (together with the Parties, the        business combination discussed in this document will be consummated or as to the
 “Companies”) to launch new products successfully and to maintain vehicle shipment             timing thereof; the risk that the announcement of the proposed business combination
 volumes; changes in the global financial markets, general economic environment and            may make it more difficult for the Parties to establish or maintain relationships with their
 changes in demand for automotive products, which is subject to cyclicality; changes in        employees, suppliers and other business partners or governmental entities; the risk that
 local economic and political conditions, changes in trade policy and the imposition of        the businesses of the Parties will be adversely impacted during the pendency of the
 global and regional tariffs or tariffs targeted to the automotive industry, the enactment     proposed business combination; risks related to the regulatory approvals necessary for
 of tax reforms or other changes in tax laws and regulations; the Companies’ ability to        the combination; the risk that the operations of PSA and FCA will not be integrated
 expand certain of their brands globally; the Companies’ ability to offer innovative,          successfully and other risks and uncertainties.
 attractive products; the Companies’ ability to develop, manufacture and sell vehicles with    Any forward-looking statements contained in this document speak only as of the date of
 advanced features including enhanced electrification, connectivity and autonomous-            this document and the Parties disclaim any obligation to update or revise publicly
 driving characteristics; various types of claims, lawsuits, governmental investigations and   forward-looking statements. Further information concerning the Parties and their
 other contingencies, including product liability and warranty claims and environmental        businesses, including factors that could materially affect the Parties’ financial results, are
 claims, investigations and lawsuits; material operating expenditures in relation to           included in FCA’s reports and filings with the U.S. Securities and Exchange Commission,
 compliance with environmental, health and safety regulations; the intense level of            the AFM and CONSOB and PSA’s filings with the AFM.
 competition in the automotive industry, which may increase due to consolidation;

                                                                  PSA AND FCA PROPOSED MERGER – December 18, 2019                                                                         3
Groupe PSA and FCA aim to create

    A LEADER FOR A NEW ERA IN SUSTAINABLE MOBILITY
•   Developing new, leading and clean mobility solutions
•   Offering best-in-class technologies and services to meet the needs of all customers
•   Leveraging efficiency and agility on larger volumes
•   Combining strengths and core competencies

                          PSA AND FCA PROPOSED MERGER – December 18, 2019                 4
MOBILITY LONG-TERM INDUSTRY TRENDS
CREATES OPPORTUNITIES FOR NEW MOBILITY SOLUTIONS

                                                                                             Industry Trends

                                                                                  COST OF                     CO2
                                                                                  MOBILITY                 CHALLENGE

                                                                                   MARKET                 TECHNOLOGY
                                                                                 DIVERGENCE              BREAKTHROUGH

                               PSA AND FCA PROPOSED MERGER – December 18, 2019                                          5
C O M P E L L I N G S T R AT E G I C R AT I O N A L E
CREATING A MOBILITY CHAMPION

               STRENGTHS                                                                                  STRENGTHS
 • Global class-leading profitability                     Opportunities                      • Margins amongst industry leaders in
 • Solid presence across Europe                                                                North America and Latin America

 • Strong core model strategy                      Balance global footprint                  • Solid presence in Latin America

 • Smartly addressing CO2 emissions                                                          • Strong SUV and pickup truck line-up

 • Successful PSA turnaround and Opel
                                          Optimize platform and engine families              • Premium / luxury brand experience
   Vauxhall integration                                                                      • Successful merging Fiat and Chrysler
                                            Scale for procurement and capex
 • Mobility provider with Free2Move                                                          • Numerous technology partnerships
                                              Accelerate development in all
              CHALLENGES                    technologies and new businesses                              CHALLENGES
 • Limited presence outside Europe                                                           • Operating profit in Europe
 • Addressing long-term industry trends                                                      • Addressing long-term industry trends

                                           PSA AND FCA PROPOSED MERGER – December 18, 2019                                       6
B U I L D I N G A L E A D E R F O R A N E W E R A I N S U S TA I N A B L E M O B I L I T Y
                                               BENEFITS FROM
                                            COMBINING STRENGTHS
                                           AND CORE COMPETENCIES

    • 4th largest OEM by volume, with balanced global footprint
    • Robust combined company margins in North America, Europe and Latin America at inception
    • Solid combined balance sheet
    • Broad and complementary brand portfolio with solid market presence across all segments
    • Extensive and growing capabilities in electrified powertrain, autonomous driving and digital connectivity
    • ~€3.7 billion of estimated annual synergies at steady state, without any plant closures
    • Combined management team recognized for exceptional value creation and success in previous combinations

                                  AT FOREFRONT OF PRODUCTS, SERVICES AND
                                 MOBILITY SOLUTIONS FOR AN EVOLVING MARKET

                                         PSA AND FCA PROPOSED MERGER – December 18, 2019                          7
KEY TERMS
PROPOSED TRANSACTION STRUCTURED AS 50/50 MERGER
   Proposed                 All-stock cross-border merger of Groupe PSA and FCA resulting in a Dutch company (DutchCo)
  Transaction
   Structure                50/50 resulting ownership between Groupe PSA and FCA shareholders (1)

                            To achieve 50/50 ownership:
 Exchange Ratio                o Groupe PSA shareholders would receive 1.742 DutchCo shares for each PSA share
                               o FCA shareholders would hold 1 DutchCo share for each FCA share
   Ordinary                 Each company will distribute a €1.1 billion ordinary dividend in 2020 related to FY 2019 results, subject to approval
   Dividends                by each company’s Board of Directors and shareholders

                            • Prior to transaction completion, shareholders of the respective companies to receive:
 Extraordinary                o Groupe PSA’s 46% stake in Faurecia to PSA shareholders
 Distributions                o €5.5 billion extraordinary dividend to FCA shareholders
                            • Promptly following closing, Comau will be separated for the benefit of the shareholders of DutchCo

                            Ownership in DutchCo based on current shareholdings in respective companies (1):
                              o EXOR N.V.                       ~ 14%
    Major
 Shareholders                 o EPF/FFP                        ~ 6%
                              o Bpifrance Participations SA     ~ 6%
                              o Dongfeng Motor Group (DFG) ~ 6% (2)
         (1) Based on fully diluted shares outstanding at Sep 30 ’19, excluding GM warrants and net of treasury shares, and before a potential acquisition by PSA of 30.7 million shares from DFG
         (2) Prior to completion of the transaction, DFG will sell 30.7 million shares to PSA (in which case they will be cancelled prior to closing) and/or to third parties (including on the market). Following the sale of these 30.7 million shares by
             DFG, ownership by DFG will be reduced to 4.5% of DutchCo.

                                                                                            PSA AND FCA PROPOSED MERGER – December 18, 2019                                                                                                                   8
KEY TERMS
GOVERNANCE STRUCTURE DESIGNED TO ENSURE DUTCHCO SUCCESS
                            •     Chairman:                  John Elkann, with an initial term of 5 years
 Governance
                            •     CEO:                       Carlos Tavares, with an initial term of 5 years
                            •     Board of Directors initially consists of 11 members, majority of non-executive members will be independent
                                   o 5 members to be nominated by Groupe PSA, including a Senior Independent Director and Vice Chairman, comprised of nominees
                                      from Groupe PSA (2 members), Bpifrance Participations SA (1 member), EPF/FFP (1 member) and employees (1 member)
    Board                          o 5 members to be nominated by FCA comprised of nominees from FCA (2 members), EXOR N.V. (2 members, including Chairman) and
 of Directors                         employees (1 member)
                                   o CEO
                            •     Senior Independent Director and Vice Chairman with initial terms of 5 years, other directors will have an initial term of 4 years, with any
                                  additional terms to be in 2 year increments
  Corporate
                            DutchCo headquartered in the Netherlands, with operational headquarters in France, Italy and U.S.
  Structure
                            • No carryover of existing double voting rights
    Voting                  • Double voting rights through loyalty shares available to all shareholders holding shares in DutchCo for 3 years after completion of merger
    Rights                  • Loyalty voting program will not operate to grant voting rights to any single shareholder exceeding 30% (1) of the total votes cast in a
                              shareholders meeting
 Shareholders               • 7-year standstill applied to EXOR N.V., Bpifrance Participations SA, DFG and EPF/FFP (2)
  Restrictions              • 3-year lock-up applied to EXOR N.V., Bpifrance Participations SA and EPF/FFP (3)
 Stock Listings             Euronext Paris, Borsa Italiana (Milan) and New York Stock Exchange
       (1) No blocking minority in a Dutch entity; all the decisions made by simple majority of votes of quorum >50%
       (2) EPF/FFP would be permitted to increase its shareholding by up to 2.5% in DutchCo (or 5% at the PSA level), only by acquiring shares from Bpifrance and DFG and/or on markets (up to 1% of the shares of DutchCo (or 2% at the PSA level) plus the percentage of
           shares sold by Bpifrance other than to EPF/FFP, subject to overall maximum of 2.5% at the DutchCo level and of 5% at the PSA level)
       (3) DFG will be subject to a lock up until the completion of the transaction for the balance of its participation in PSA, resulting in an ownership of 4.5% of DutchCo. Bpifrance will be permitted to reduce its shareholdings by 5% in PSA or 2.5% in DutchCo

                                                                                          PSA AND FCA PROPOSED MERGER – December 18, 2019                                                                                                                             9
CO MB I NI NG T WO G LO BA L AU TOMOT I V E O E M S
CREATION OF 4TH LARGEST AUTOMOTIVE MANUFACTURER BY VOLUME, 3RD LARGEST BY REVENUES

  2018 Calendar year global sales, including JVs
  million units
                                                                     #4
       10.8                10.8                10.6

                                                                     8.7
                                                                                         8.4
                                                                                                       7.4

                                                                                                                     6.0
                                                                                                                                  5.7          5.3
                                                                                                                                                     4.8
                                                                                                                                                                 3.9         3.9

                                                                                                                                                                                   1.2

                                                                                                                                                           (1)         (2)

 (1) FCA sales Include sales primarily by dealers and distributors (including joint ventures)
 (2) Groupe PSA consolidated world sales include assembled vehicles, CKDs and vehicles under license
 Source: Company information, IHS Global Insight

                                                                                             PSA AND FCA PROPOSED MERGER – December 18, 2019                                             10
C O M B I N E D C O M PA N Y F I N A N C I A L S T R E N G T H
COMBINING TWO EFFICIENT AUTOMOTIVE OEMS

                                                                                                                                                                         Adjusted EBIT Margin (3)
                                                          Year Ended December 31, 2018
                                                                                                                                                                                        6.3%       6.1%
                                                                                                                                                                           5.4%
                                                                                                                                                                4.3%
                                                              (Excluding                                                   Aggregated (1)                3.6%
   € billion, except as otherwise stated                    Magneti Marelli)              (Excluding Faurecia)               (Pre-Synergies)

      Sales including JVs (2)                                     4.8                             3.9                             8.7
       (million units)

       Net Revenues                                            110.4                             58.6                           169.0                    2014   2015       2016         2017       2018

      Operating Profit                                            6.7                             4.4                            11.2
                                                              (Adjusted EBIT)         (Recurring Operating Income)                                                     Recurring Operating Margin
                                                                                                                                                                            (excluding Faurecia)
      Operating Profit Margin                                   6.1%                            7.6%                            6.6%                                                               7.6%
                                                          (Adjusted EBIT Margin)       (Recurring Operating Margin)
                                                                                                                                                                           6.1%         6.0%
      Automotive Operational                                                                                                                                    5.0%
                                                                  4.4                             3.1                             7.5
      Free Cash Flow                                   (Industrial Free Cash Flows)          (Free Cash Flow)

   (1) Simple aggregation of FCA (excluding Magneti Marelli) and PSA (excluding Faurecia) FY 2018 results prior to any required accounting adjustments
   (2) FCA sales include sales primarily by dealers and distributors (including joint ventures); Groupe PSA consolidated world sales include assembled   0.6%
       vehicles, CKDs and vehicles under license
   (3) 2016 - 2018 figures exclude Magneti Marelli. All years exclude Ferrari.
   (4) Includes results from Opel/Vauxhall acquisition from Aug 1 ’17                                                                                    2014   2015       2016         2017 (4)   2018
   Figures may not add due to rounding
   Source: Company information

                                                                                            PSA AND FCA PROPOSED MERGER – December 18, 2019                                                               11
FINANCIAL POSITION AND LIQUIDITY
COMBINED COMPANY TO HAVE STRONG BALANCE SHEET PROVIDING FINANCIA L FLEXIBILITY

                                                                             As of June 30, 2019

                                                                                                                                   Aggregated (1)
                                                                       (Excluding                                                  (Pre-Synergies &
   € billion                                                         Magneti Marelli)            (Excluding Faurecia)               Pre-Dividends)

      Automotive Net Cash Position                                          3.3                          10.5                            13.8
                                                                                                                                                                Combined company to have strong
     Cash, Cash Equivalents and                                                                                                                                  balance sheet and high level of liquidity
                                                                          15.8                           15.7                            31.5
     Current Debt Securities (2)
                                                                                                                                                                Ample headroom to execute strategic
     Undrawn Committed Credit Lines                                        7.7                            3.0                            10.7
                                                                                                                                                                 plan and invest in new technologies

                                                                                                                                                                Investment grade credit rating expected
      Total Available Liquidity                                            23.5                          18.7                            42.2

   (1) Simple aggregation of FCA (excluding Magneti Marelli) and PSA (excluding Faurecia) as of Jun 30 ‘19 results prior to any required accounting
       adjustments and is not reflective of €5.5B dividend to be paid to FCA shareholders prior to transaction closing
   (2) Current debt securities are comprised of short term or marketable securities which represent temporary investments that do not satisfy all the
       requirements to be classified as cash equivalents as they may not be readily convertible to cash or they are subject to significant risk of change in
       value (even if they are short-term in nature or marketable)
   Source: Company information

                                                                                              PSA AND FCA PROPOSED MERGER – December 18, 2019                                                                12
I CON I C AU TOMOT I V E B R A NDS
WELL-ESTABLISHED BRANDS WITH NATIONAL ROOTS

                                                                                                                                                                    (2)

                                             (1)

                           (1)                                                 (1)
                                                                                                                                                                             (3)

   Date
Established       1896                     1899                     1903             1906             1910                     1914   1919     1925   1941   2009         2014

     (1) Based on first manufactured car
     (2) Ram separated from Dodge brand in 2009
     (3) The first DS car was manufactured in 1955 as a part of the Citroën brand. DS became an independent premium brand in 2014.

                                                                                             PSA AND FCA PROPOSED MERGER – December 18, 2019                                       13
BROAD-BASED PORTFOLIO OF BRANDS
FULL MARKET COVERAGE WITH SIGNIFICANT PORTFOLIO SYNERGY OPPORTUN ITIES

                                                                                                          Mainstream
                      Luxury                     Premium                                                     Pass Car/                                                     2018 Global Sales (2)
                                                                                   SUV                                                   Truck/LCV
                                                                                                             CUV/MPV

                                                                                                                                                                                  9%
                                                                                                                                                                           11%
                                                                                                                                                                                                  37%
                                                                                                                                                                          8%          8.7M
                                                                                                                                                                                      units

                                                                                                                                                                                 35%

                                                                                                                                                                           Pass Car      UV (1)    MPV (1)

                                                                                                                                                                           LCV           Truck

          (1) Multi-purpose vehicles (MPV) and utility vehicles (UV), which include SUVs and CUVs, are typically considered passenger cars in Europe
          (2) Groupe PSA consolidated world sales include assembled vehicles, CKDs and vehicles under license; FCA includes sales primarily by dealers and distributors
              (including joint ventures)
          Source: Company information

                                                                           PSA AND FCA PROPOSED MERGER – December 18, 2019                                                                                   14
C O M P L E M E N TA R Y P R E S E N C E I N K E Y R E G I O N S
COMBINED COMPANY TO HAVE BETTER GEOGRAPHIC BALANCE

     2018 Global Revenues                                                                        2018 Global Revenues Aggregated (1)                                                       2018 Global Revenues
          (excluding Faurecia)                                                                                        (Pre-Synergies)                                                       (excluding Magneti Marelli)

                                                                                              Other – €19B
               4%                                                                                                                                                                     2%             4%
                                                                                                                     11%                                                                      7%
        4%

                                                                  Europe, Middle East &
              €59B                                             Africa and Eurasia – €77B
                                                                                                        46%              €169B                    43%          North America – €73B   21%          €110B                  66%

                    88%

  Europe                           Eurasia
                                                                                                                                                                                            North America             EMEA
  Middle East & Africa             India & Pacific
  China & SE Asia                  Other                                                                                                                                                    APAC                      LATAM
  Latin America
                                                                                                                                                                                            Maserati & Other (2)
         (1) Simple aggregation of PSA (excluding Faurecia) and FCA (excluding Magneti Marelli) FY 2018 results prior to any required accounting adjustments
         (2) Includes Components business, other activities, unallocated items and eliminations
         Source: Company information

                                                                                        PSA AND FCA PROPOSED MERGER – December 18, 2019                                                                                         15
INVESTMENT SPENDING
SYNERGIES TO OPTIMIZE COMBINED SPENDING AND EFFECTIVELY ADDRESS NEW MOBILITY TRENDS
                                                    Mobility Solutions                               Connected Car                                New Energy Vehicle                        Autonomous Driving
 Year ended Dec 31 ‘18
 € billion
                         27.4

     R&D
  (Capitalized           13.6                          (1)
                                                19.2
  & Expense)

                                                                     ~15.0
                                                 8.0                                         14.0              13.5
                                                                    Normalized
                                                                                                                                     11.0 (1)                 (2)
                                                                                                        (1)                                          ~10.0
                                                                                              6.6               6.9                                                             (1)
                                                                       6.5                                                                                                7.9
                                                                                                                                                   Normalized
                                                                                                                                      6.3                                             6.2
    Capex                13.7                                                                                                                                                                      5.9
                                                11.1                               11.9                                                                                   4.0                                    5.0
                                                                                                                                                      3.5                             3.5          2.1
                                                                                                        (1)
                                                                                              7.4               6.6                                                 6.8                                          3.0
                                                                       5.4                                                            4.7             3.3                 3.9         2.7          3.7
                                                                                                                                                                                                                 2.1

                                                                  (ex. Faurecia)
                                                                                                                                                (ex. Magneti Marelli)                                       (ex. Faurecia)

                                                               (ex. Magneti Marelli)

             (1) Fiscal year filer – figures represent Apr 1 ’18 to Mar 31 ‘19 investment spending
             (2) Represents normalized annual spending due to low spending level in FY 2018 (€6.8B)
             Note: Represents total Company capex and R&D (capitalized and expensed excluding amortization expense)
             Figures translated at the following 2018 YTD average FX rates: USD/Euro = 1.181; Yen/Euro = 130.4; Kwon/Euro = 1299.1
             Figures may not add due to rounding
             Source: Company information
                                                                                            PSA AND FCA PROPOSED MERGER – December 18, 2019                                                                                  16
MERGER SYNERGIES
ANNUAL SYNERGIES OF ~€3.7B EXPECTED TO BE GENERATED AT STEADY ST ATE

      An n ual Syn e rgies a t S t e a dy S t a t e

                                                                                                        •   Convergence of vehicle platforms
     Product Related Expenses                                                                           •   Consolidation~15%
                                                                                                                            of investments on ICE powertrain,
 1                                                                ~40%
                                                                                                            electrification and other technologies
     (Vehicle, Powertrain and Manufacturing)
                                                                                                        •   Manufacturing process and tooling efficiencies

                                                                                                        •   Enhanced volumes unleashing scale economies
 2   Purchasing                                                                 ~40%
                                                                                                        •   Best price alignment and access to new suppliers

                                                                                        ~20%            •   Multiple areas of joint savings, primarily marketing, IT,
 3   Other                                                                                                  logistics and G&A

     Total                                                                              ~€3.7B

          ~80% of synergies expected                          Estimated synergies net cash                               Cumulative implementation
           to be achieved by Year 4                             flow positive from Year 1                                   costs ~€2.8 billion

                                                      PSA AND FCA PROPOSED MERGER – December 18, 2019                                                                   17
P L AT FOR M A N D P OWE RT R AI N CON V E RG E NCE
SYNERGIES AND SCALE FROM CONVERGENCE PLANS, AS WELL AS HIGHER PARTS COMMONIZATION

                                                                                                         P l a tform Vo l u me

  •   Continue to serve all customers needs while
                                                                         FCA + PSA unit volume
      optimizing number of platforms and                                 at steady state

      powertrain families
                                                                                           > 3 million
                                                                                                                                 > 2.6 million
  •   Top 2 platforms will represent ~2/3 of
      combined company’s steady state volumes

  •   Volume for each top 2 platforms to reach
      industry benchmark levels

  •   Improved manufacturing and R&D efficiency
                                                                                     Compact/Mid-size                               Small

  •   Higher level of parts commonization

                                            PSA AND FCA PROPOSED MERGER – December 18, 2019                                                      18
E U RO P E CO 2 CO MP L I A NCE P L A N
BOTH COMPANIES ON TRACK TO ACHIEVE COMPLIANCE IN 2020 WITH SYNERGIES IN FUTURE YEARS

                                             2020                                                                           2 0 2 1 a n d B e yo nd

                                               • 2 multi-energy flexible platforms to
                                                 master market electrification ramp-up
                                               • BEV or PHEV version for each new
                                                 launch beginning in 2019
                                               • 7 PHEV and 7 BEV models in market                • Combined company on track to achieve compliance in 2021
                                               • Fully compliant from Day 1
                                                                                                  • All new vehicles for both companies will offer electrified
                                                                                                    versions

       % C o n tribution t o C O 2 C o m pl iance                                                 • Convergence plan to improve compliance at steady state:
          100                                                                                        o     Fitting “best-of-best” existing powertrain and CO2
                                                                                                           technological solutions in the short/medium-term
                Pooled Credit Deployment
                                               • Launch 1 BEV and 3 PHEV models                      o     Combined company to accelerate development of
                                                                                                           electrification technologies leveraging mutual capabilities and
                                               • Launch 3 12-volt mHEV models
                                                                                                           “centers of excellence”
                     Electrification           • Compliance achieved through
                   (mHEV, PHEV, BEV)
                                                 deployment of conventional
                                                 technology, electrification and
                Conventional Technology
                                                 credit pooling
                 (small turbos, ESS, etc.)
            0

                                                         PSA AND FCA PROPOSED MERGER – December 18, 2019                                                                19
E N H ANCE D I N NOVAT I ON A N D D E V E LOP M E NT C A PA BI L I T I ES
COMBINING INTERNAL EXPERTISE WITH PARTNERSHIPS TO DEVELOP LEADIN G MOBILITY SOLUTIONS

                       Mo b ilit y & Au t o nomous D ri v ing                                              C o n nectiv it y

               • "Autonomous Vehicle for All“ program with focus                    • Strong focus on connectivity; Internet Of Things (IOT) platform
                 on Level 2 and 3 for passenger cars, partnering with                 developed; already 6 million connected cars on CVMP platform
                 APTIV                                                              • Connected services offered by Free2Move mobility brand
               • Various cooperations on advanced engineering on                    • Partnership with Harman on in-vehicle infotainment system
                 Level 4 and 5 (e.g. Vinci, Easymile, AIMotive, Vedecom)

               • Partnering to deploy self-driving technology across the
                 vehicle portfolio, including commercial vehicles                   • FCA’s new global “ecosystem” for connected
                                                                                      vehicles enhanced by partnerships to provide
               • Collaborating with Waymo on development of first                     benefits from a broad array of services
                 significant fully-autonomous system in the market
               • L2+ system available on premium and high-end
                 vehicles starting in 2020

                                             PSA AND FCA PROPOSED MERGER – December 18, 2019                                                      20
S TAT U S A N D N E X T S T E P S
TRANSACTION CLOSING EXPECTED IN 12 – 15 MONTHS

                    • Following unanimous approval of PSA’s Supervisory and Managing Boards, as well as FCA’s Board of
                      Directors, PSA and FCA have signed binding Combination Agreement for 50/50 merger
         Status
                    • Both parties completed due diligence process

                    • Approvals obtained from works councils/labor unions

                    • Both companies to convene Extraordinary General Meetings for their respective shareholders to approve
                      transaction
       Next Steps
                    • Anti-trust and regulatory approvals

                    • Transaction closing expected in 12 – 15 months, subject to customary closing conditions

                                          PSA AND FCA PROPOSED MERGER – December 18, 2019                                     21
Proposed merger would create
        A LEADER FOR A NEW ERA IN SUSTAINABLE MOBILITY
• Well positioned to effectively address new mobility trends
   o   4th largest OEM with robust combined company margins in North America, Europe and Latin America at inception
   o   Broad and complementary brand portfolio
   o   Strong presence in key vehicle segments and key regions
   o   Solid combined balance sheet

• Opportunity to create significant value for all stakeholders
   o   Significant platform and powertrain convergence opportunities
   o   ~€3.7 billion annual estimated synergies at steady state

• Execution risk minimized
   o   Combined management team with successful OEM combination experience
   o   Complementary technology expertise to address global CO2 challenges

                                     PSA AND FCA PROPOSED MERGER – December 18, 2019                                  22
APPENDIX

           PSA AND FCA PROPOSED MERGER – December 18, 2019   23
C O M P L E M E N TA R Y P R E S E N C E I N K E Y R E G I O N S
COMBINED COMPANY TO HAVE BETTER GEOGRAPHIC BALANCE

        2018 Global Unit Sales (1)                                                                   2018 Global Unit Sales Aggregated (2)                          2018 Global Unit Sales (3)

                   4%                                                       North America – 2.5M
            7%                                                              Market share: ~12%                                                                             12%
                                                                                                                 29%                                                 5%
      8%
                                                                                                                                                         Europe,
                   3.9M                                                                                                 8.7M                 Middle East & Africa                4.8M        53%
                     units                                                                                              units     56%         and Eurasia – 4.9M                 units
                                                                                                                                             Market share: ~20%     30%
                                                                                                             9%
                                  80%                                                                              6%

                                                                  Latin America – 0.8M                                                        Asia Pacific – 0.5M
  Europe                            China & SE Asia               Market share: ~17%                                                          Market share: ~1%           North America     EMEA
  Middle East & Africa              Latin America
  India & Pacific                    Eurasia                                                                                                                              APAC              LATAM

           (1) Groupe PSA consolidated world sales include assembled vehicles, CKDs and vehicles under license
           (2) Market share and rank based on IHS light vehicle sales as of Nov ‘19
           (3) FCA sales include sales primarily by dealers and distributors (including joint ventures)
           Source: Company information
                                                                                         PSA AND FCA PROPOSED MERGER – December 18, 2019                                                           24
E U RO P E
ENHANCE PSA’S CLASS LEADING PROFITABILITY WITH VOLUME IN KEY SEG MENTS

                                       FY 2018 Combined Sales (1, 3)                                                                                  Combined Sales History (4, 5)                                                        Key Strengths
Sales (000 units)                                                                                                             Sales (000 units)
                                                                                                                                                                                                                                  PSA and FCA combined are a
                                                                                                                                                                                                                                   leading OEM in Europe by
                                                                                                                                                                                                                                   market share(3)
                   A                                                                                563                                                                                                  4,382
                                                                                                                                                                                                                                  PSA has leading profitability
                                 Citroën C1           Fiat 500
                                                                                                                                                                                                 3,674                             and segment coverage
                                                                                                                                                                                      3,165                             3,152
                   B                                                                                              863                     2,971 2,864
                                                                                                                                                         2,761
                                                                                                                                                                                 2,945                                            Leverage FCA’s existing car
                                                                                                                                                                         2,682
   Passenger Car

                             Opel Vauxhall Corsa   Lancia Ypsilon                                                                                                2,568                                   3,106                     parc (>15M units for A and
                                                                                                                                                                                                 2,379
                       (2)                                                                                                                                                               1,930
                                                                                                                                                                                                                                   B-segments combined)
                                                                                                                                          1,700 1,700                                                                   2,247
                   C                                                                            508                                                      1,781
                                                                                                                                                                                 1,864

                                Peugeot 308         Alfa Romeo
                                                                                                                                                                 1,648 1,725                                                      PSA’s successful and prompt
                                                     Giulietta                                                                                                                                                                     turnaround of Opel/Vauxhall
                    B-
                                                                                                          682                             1,271 1,164
                                                                                                                                                      980         920     957    1,081 1,235 1,295 1,276                 905      100% of PSA’s portfolio to be
                   SUV
                                Peugeot 2008       Jeep Renegade                                                                                                                                                                   electrified in 2025
                                                                                                                                          2010    2011    2012    2013   2014    2015    2016     2017   2018           YTD
                    C-
                                                                                              454
                                                                                                                                                                                                                       Sep ‘19
                                                                                                                                                                                                                                  PSA’s smart approach to be
                   SUV
                             Citroën C5 Aircross   Jeep Compass                                                                                                                                                                    CO2 compliant from Day 1

                                                                                                                 844
   LCV

                               Citroën Jumpy        Fiat Ducato
                                                                             PSA           FCA
                               (1) Does not include all segments
                               (2) Combination of C1, C2 and CDV as per IHS
                               (3) As per IHS light vehicle sales data as of Nov ‘19
                               (4) FCA sales include sales primarily by dealers and distributors (including joint ventures); Groupe PSA consolidated world sales include assembled vehicles, CKDs and vehicles under license
                               (5) PSA includes Opel/ Vauxhall sales from Aug 1 ‘17                       PSA AND FCA PROPOSED MERGER – December 18, 2019                                                                                                    25
                                Figures may not add due to rounding
NORTH AMERICA
  SOLID PRESENCE IN KEY HIGH MARGIN SEGMENTS WITH ACTIONS TO SUSTA IN PROFITABILITY

                        Pickup Growth                                                                 Key Product Actions                                                 N orth America Profitability
                                                                                                            White-space Products                   Renewal

                        All-new                1500              All-new                            3-row           Grand                          Grand
                         1500                 Classic           Heavy Duty                          E-SUV          Wagoneer         Wagoneer      Cherokee
                                                                                                  SOP Q4 ‘20       SOP Q1 ‘21       SOP Q1 ‘21    SOP Q2 ‘21
                                                                      25.7%

                                                                                                                            1,023         1,058                Adjusted EBIT                                      6.2
North America Sales (000 units)                                                  North America Sales (000 units)                                               € billion
                                                                                                                      974
                                                                                                                                    912                        % = Adjusted EBIT Margin
                                                              612                                                                                                                                         5.2
                                                                                                                                                                                                  5.1
                                                  572 590                                                      789                                                                                                       4.6
                                                                                                                                                   767
Total U.S.                          519 532                             531                                                                                                               4.5
Market Share
(LD+HD)                       432
          14.5%                                                                                   538 558                                                                                                               8.8%
                        359                                                                 486                                                                                                                 8.6%
                  310                                                                                                                                             2.4                                   7.9%
           257                                                                        345                                                                                2.2     2.2
                                                                                                                                                                                                 7.4%
  Heavy
                                                                                                                                                                                          6.4%
  Duty                                                                                                                                                           5.6%
                                                                                                                                                                        4.8% 4.2%
  Light
  Duty

                                                                        YTD           2010 2011 2012 2013 2014 2015 2016 2017 2018                 YTD           2012    2013    2014     2015   2016    2017    2018    YTD
           2010 2011 2012 2013 2014 2015 2016 2017 2018                                                                                           Sep ‘19                                                               Sep ‘19
                                                                       Sep ‘19
                  Ram large pickup U.S. average transaction                                                                                                          Effective Jun ‘11, Chrysler Group LLC was fully
                 prices have increased > $10,000 since 2010                                                                                                          consolidated by Fiat S.p.A.. Full year data for
                                                                                                                                                                    North America region not available prior to 2012.
                    Source: Company information

                                                                                 PSA AND FCA PROPOSED MERGER – December 18, 2019                                                                                        26
L AT I N A M E R I C A
 OPPORTUNITY TO FURTHER ENHANCE FCA AND PSA’S POSITIONS IN BRAZIL AND ARGENTINA

                    Brazil Combined Sales History                                                Argentina Combined Sales History                                           FCA’s Sustained Profitability

                                                                                                                                                                 Adjusted EBIT
                                                                                                                                                                 € billion

(000 units)                                                                        (000 units)
                                                                                                                                                                    1.1
                                                                                                                                                                                     Only OEM to sustain
              945 941 984                                                                                                                                                          profitability through cycle
                                  894                                                                              256
                           139
              180    181          123    793
                                                                                                                                           215
                                                                                                       208 199                                                             0.6
                                         87
                                                                                                                   145   172         175         174
                                                                                                 158
                                                                                                       113                     144         110
                                                538                                                          114                                 75                                                                0.4
                           845                  55
                                                                   479                                                   84          96                                                                                     0.4
                                                                          440                    87                            70                                                            Recession
              765    760          771
                                         706           417 428     45                                                                                   75                        0.3
                                                             48            33
                                                       52                               12.5%
                                                                                                                   111                                  30
                                                483
                                                                   434
                                                                                         #5
                                                                                                       95    85          88
                                                                                                                                           105   99                                                        0.2
                                                       365   380          407                    71                            74    79
                                                                                                                                                        45
                                                                                                                                                                                                   0.0
              2010 2011 2012 2013 2014 2015 2016 2017 2018                YTD                    2010 2011 2012 2013 2014 2015 2016 2017 2018           YTD                               (0.1)
                                                                         Sep ‘19                                                                       Sep ‘19
                                                                                                                                                                   2012    2013    2014    2015    2016     2017    2018    YTD
                                                                                                                                                                                                                           Sep ‘19
                                                                                                                                                                       Effective Jun ‘11, Chrysler Group LLC was fully
                                                                                                                                                                       consolidated by Fiat S.p.A.. Full year data for
                                                                                                                                                                      Latin America region not available prior to 2012.

                       Figures may not add due to rounding
                       Source: Company information
                                                                                    PSA AND FCA PROPOSED MERGER – December 18, 2019                                                                                        27
You can also read