MPRA Application of Discounted Cash Flow Model Valuation - Wal-Mart
←
→
Page content transcription
If your browser does not render page correctly, please read the page content below
M PRA
                            Munich Personal RePEc Archive

Application of Discounted Cash Flow
Model Valuation – Wal-Mart

Zekuang Tan

26 December 2016

Online at https://mpra.ub.uni-muenchen.de/83903/
MPRA Paper No. 83903, posted 12 January 2018 13:04 UTC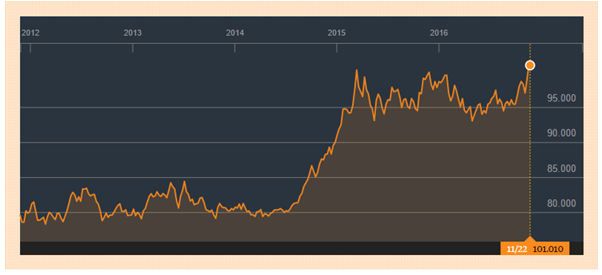
Application of Discounted Cash Flow Model Valuation – Wal-Mart

Zekuang Tan (Tyson)
ABSTRACT

The objective of this research paper is to examine if DCF models offer reliable and accurate valuations of

Wal-Mart. With the purpose of achieving most accurate results, an efficient combination between theory and

practice was implemented throughout the valuation. The DCF valuation of free cash flow to equity holders

was performed and the stock price of Wal-Mart was suggested it to be $81.63. Afterwards, we tracked the

six-month stock price movement of Wal-Mart, (from 2016 Jan to 2017 Jun) and surprisingly found that the

price had climbed from $69.24 to $80.47.

INTRODUCTION

Wal-Mart Stores Inc. (WMT) is the world's largest retailer and grocery chain by sales. Incorporated in 1969,

WMT currently employs 2.3 million global employees to operate 11,528 stores in 28 countries and had

revenues exceeding $485 billion in 2016. The company has focused its establishment on a cost-leadership

strategy; leveraging its large scale and sales numbers to make up for smaller profit margins. The company

operates three separate divisions including Wal-Mart International, Wal-Mart US and Sam's Club. The

company operates supercenters, discount stores, warehouse clubs, neighborhood markets and retail websites,

offers general merchandise and a full line of groceries with the U.S. as its main market. The following

section will analyze the business environment of WMT using a top-down approach.

MACROECONOMIC ANALYSIS

World real GDP is expected to grow by 3.8% in 2017 and the increase in purchasing power of consumers has

a high likelihood of being positive for WMT. Real GDP is further expected to grow by 2.7% in the US,

which is the most important market. Nevertheless, given the global presence of the company, WMT is highly

exposed to exchange rate risks. Fluctuations in currency exchange rates resulted in a net loss of $4.7 billion

for fiscal 2016, and the impact could become even greater due to the current appreciation of the US dollar.

WMT does hedge partially against exchange rate fluctuations to reduce the risk. WMT also hedges a portion

of its interest rate risk due to borrowings by entering into interest rate swaps. The steep yield curve suggests

expectations for the current low rates to rise. The rise is based on Jan 31 2016, a 100-basis point increase

                                                                                                        1 of 16
would cause the annual interest rates for WMT to rise about $79 million and a loss in value of their swaps of
$14 million.
INDUSTRY ANALYSIS
The global retail industry has been growing at a rate of 5% in recent years, and this trend is forecasted to
continue mainly due to an increase in GDP and disposable income in many developing countries
(Marketline, 2016). WMT gets 59% of revenue from the US retail market, where retail sales are expected to
grow by 3% (IBID). These figures suggest that WMT could grow organically in the future. WMT operates
mainly within the Warehouse Clubs and Supercenters industry that is highly concentrated, with a four-firm
concentration of 92.1%; Wal-Mart (68.6%), Costco (17.1%), Meiji Inc. (3.5%), and Target (2.9%) in 2016.
The highly competitive industry is characterized by an oligopolistic market structure. The major players
typically compete with strong brands and successful business models, but they are especially vulnerable to
price wars. Recent trends in food deflation and growth of online retailing with a more flexible cost structure
have contributed to increased competition. WMT’s recent price slashing move, dropping grocery prices by
10%, is expected to threaten a potential collective loss of $35 billion in revenue for the main competitors
(SOURCE). This would imply lower margins for all retailers while a lack of retaliation could further imply
loss of market share to WMT.
The industry is characterized by limited product differentiation and very low switching costs, which to some
extent increases the buyer power. This leads to high buyer mobility, which further forces large retailers to
have attractive pricing schemes (Marketline, 2015). Entry costs are high, as entrants may struggle with the
aggressive marketing and pricing of the current players due to economies of scale. WMT has substantial
bargaining power over suppliers considering the size of the company and the backward integration with its
own line of brands. WMT also makes its suppliers responsible for its Gross Margin Return on Inventory
Investment and underperforming suppliers can easily be replaced.
In terms of substitutes, E-commerce retailing is emerging and traditional retailers are facing increasing
competition from online companies, such as Amazon. WMT invested $296 million in e-commerce initiates
in 2016, and the company currently has 16 websites in 11 countries (Annual report, 2016). However, WMT’s
2 of 16online sales of $13.5 billion in 2016 are way below Amazon’s sales of $82.8 billion. Online sales growth of
WMT is further just 7% in 2016, which is below the 23% online growth rate of Target and even below the
industry average of 15.1% (Wahba, 2016). This is a concern for WMT, as global E-commerce retail sales are
expected to rise 220% from 2015 to 2019 (Statista, 2015).
BUSINESS STRATEGY ANALYSIS
WMT has several competitive advantages that enable the company to be a cost leader. Firstly, their large
scale allows them to enjoy significant cost savings from economies of scale. The company is further able to
keep costs low due to an efficient distribution network. WMT operates 313 distribution facilities globally,
which ensures a large product portfolio that is distributed in the most efficient manner (Marketline, 2016).
Technological knowledge and the utilization of information systems is further a competitive advantage that
increases the efficiency and decreases costs in distribution. WMT's data collection and auto-replenishment
system help WMT and its partner suppliers to more effectively predict customer demand, which help to
maximize store sales productivity at a lower cost (IBID). WMT’s extensive marketing activities such as the
“Everyday Low Prices” campaign, has increased the brand awareness and attracting a large and loyal
customer base. The brand has thus become a very important asset for the company.
ACCOUNTING DISTORTIONS
As a result of the limitations of GAAP, the value of WMT’s brand is not reflected on the Balance Sheet.
Strong brand image and WMT membership-based warehouse club can drive revenue from loyal customers
but these values remain missing from the asset side on Balance Sheet. ROE is thus overstated compared to
the true economic rate of return, with the economic value of brand equity and comprehensive customer
database reflected in Income Statement but the balance sheet remains permanently conservative. The
company also leverages house brands to sell its own products including Sam’s Choice (premium foods with
organic ingredients), Great Value (low-priced household consumables) and many more. The house brands
generate economic value for the company by a form of vertical integration, where it can act as both supplier
and retailer e.g. WMT is able to sell products under its Great Value brand at a lower cost than name-brand
products, yet with better margins, resulting in a higher Revenue/COGS in the income statement. A higher
3 of 16Net Income in the Income Statement reflects this. The assets are however not accounted for in the balance
sheet as almost all of the house brands have been created by WMT and not acquired, in which case some of
the brand value would have been reflected in Goodwill.
One of the main competitive advantages of WMT is their ability to efficiently manage inventory. This is
largely achieved through the use of WMT’s Retail Link, a program that gives suppliers the data they need to
adjust supply after demand as precise as on an hourly basis. Leveraging the use of data this way implies
WMT could tie up less cash in inventories, resulting in less need for financing. From an accounting
perspective, this implies either a lower need for debt and hence lower interest expense, or a lower need for
issuance of common equity. The former would increase ROE by increasing Net Income to Common Equity,
and the latter would do the same through implying less Common Equity on the balance sheet. In either way
ROE is overstated compared to the economic rate of return.
We further identified a nonrecurring item on the Income Statement. In fiscal 2016, WMT purchased the
remaining shares of Yihaodian, its Chinese e-commerce platform, from non-controlling interests. WMT paid
approx. $760 million in cash. No revaluation of the Yihaodian was made in conjunction with this purchase
and hence it had no effect on income, and we did not need to adjust for it.
FINANCIAL RATIO ANALYSIS - DECOMPOSITION OF ROE
Wal-Mart’s ROE fell by 12.6% YOY in 2016 and to analyze the driving factors behind this change, we look
into the advanced Dupont model in eVal. Specifically, RNOA fell by -7.3%; LEV fell by -13.3%; while
spread fell by -11.3%. Change in RNOA is further decomposed into change in Net Operating Asset Turnover
(+2.3%) and Net Operating Margin (-9.5%). The loss in profitability more than offsets the slight gain in asset
efficiency. Upon further analysis of the Income Statement, we find that the 4.16% increase in SG&A is the
most significant driver for the fall in profitability. We then analyze the trend in SG&A/Sales for the past
years and find that the ratio increases consistently from 19.0% in 2013 to 20.3% in 2016. For FY2016, the 91
basis point increase was primarily due to (i) an increase in wage expense at the Wal-Mart U.S. segment and
(ii) $0.9 billion charge for the store closures and (iii) the continued investments in Digital Retail and IT.
4 of 16We believe the higher operating expenses are not necessarily a red flag for WMT. Firstly, WMT has
affirmed their position as a “growth company”, with FY2016 “being another year of foundational
investment” (Annual Report, 2016), The closure of underperforming stores could thus be a sound economic
decision to improve overall cost efficiency going forward rather than an indication of losing market share.
Secondly, the continued investment in digital retail supports WMT plans to increase their market share in e-
commerce. WMT has seen +107% growth in global e-commerce net sales over the past 4 years but the
strong growth of Amazon Prime could pose a threat to WMT in online retailing. Thirdly, the move towards
competitive pay is a reflection of WMT’s commitment to investing in their associates, which could yield
favorable returns in the future due to increase in productivity.
The change in LEV is largely attributed to the -8.9% decrease in Net Financial Obligation (NFO), which
could be broken down into a -10% fall in short term debt, -6% in long-term debt and -33% in Minority
Interest (which is due to WMT completing the purchase of all of the remaining non-controlling interest in
Yihaodian to increase their e-commerce operations in China in July 2015). For FY2016, the increase in net
cash flows provided by short-term borrowings for WMT partially offset a larger $2.0 billion decrease in
long-term debt due within one year. The slight 1.6% increase in Net Borrowing Cost (NBC) suggests WMT
is probably paying down debts with lower interest rate. The interest rate expense is thus expected to be
higher in the coming years.
SUSTAINABILITY OF CURRENT PROFITABILITY
While the evolving competitive environment is likely to put pressure on WMT’s margins, there are good
reasons to be optimistic about WMT’s future profitability considering their large scale, dominant market
position and their general resilience to swings in economic cycles. Their loss in profitability in the current
fiscal year should be interpreted as temporary restructuring costs to enhance future performance as well as
investment required to expand their market share both offline and online. Lower margins due to price
slashing in the short-run could favor WMT’s dominant market leadership going forward. Their healthy
liquidity and solvency ratios (to be discussed later) could provide a buffer for the adverse impact of lower
margins in the short-run. Their conservative accounting, relatively low financial leverage as well as decisions
5 of 16to eliminate less cost-efficient stores and increased investment in human resource do bode well for WMT’s
future. We believe that WMT’s long-term growth and profitability is contingent on their success in
penetrating emerging markets as well as their relative performance against Amazon Inc., as we expect a
blurring of lines between online and offline retailing going forward.
CASHFLOW ANALYSIS
The reformatted CF statement illustrates that Wal-Mart is able to generate cash from its operations. In 2016
WMT generated an impressive $29.1 billion in cash from operations and their positive cash flow from
working capital help ensure WMT can meet short-term debt and upcoming operational expenses. WMT
invested significantly in growth in 2016, with CAPEX of $11.6bn being larger than depreciation expense of
$9.5bn. Increasing capital assets supports WMT’s business strategy to increase market penetration and enter
new emerging markets. The strategy of increasing growth through e-commerce further requires substantial
capital investments. Nevertheless, internally generated cash mainly financed these investments, as WMT is
less dependent on external financing. WMT’s relatively low financial leverage is revealed by their low Debt-
to-Equity ratio of only 0.56. WMT has $18.4bn free cash flow to debt and equity, of which WMT paid
$1.7bn in after tax interest expense and repaid $5.7bn of debt. WMT’s financial strength allowed for
shareholder returns in excess of $10bn through dividends ($6.2bn) and share repurchases ($4.1bn). These
decisions resulted in a net decrease of the cash balance of $430 million. While WMT’s relatively aggressive
share repurchase program may cause their relatively low financial leverage to edge up marginally, we
believe that WMT’s ability to generate consistent strong free cash flows will continue to provide stability to
its credit risk profile. The Funds Flow Coverage Ratio for WMT is 13.6, which further supports our view
that WMT is able to meet its financial obligations comfortably and is less reliant on external financing. This
is also consistent with Moody’s affirmation of stable outlook for WMT, giving Aa2 senior unsecured and
Prime-1 commercial paper ratings (Oct 2015).
COMPETITOR COMPARISON
The three close competitors selected for peer group analysis are: Costco (COS), Target Corp (TGT) and
Amazon (AMZN). COS is an American membership-only warehouse club that provides a wide selection of
6 of 16merchandise and TGT is the second largest discount retailer in U.S. behind WMT. COS and TGT are similar
to WMT in relative size and they too compete on a high volume, low cost strategy selling groceries and non-
grocery consumer items with U.S. as their main market. However, Costco is more similar to WMT Sam’s
Club due to their exclusive focus on membership. TGT is smaller and caters to slightly more affluent
customers, offering more quality brands but with less variety. While AMZN, an American e-commerce and
cloud computing company, has a very different structure compared to the brick-and-mortar discount chain,
WMT’s push into the online market makes AMZN a potentially relevant competitor due to their established
dominance in digital retailing.
Table 2 in the appendices provides an overview of key profitability and risk ratios. While WMT’s negative
sales growth (-0.7%) pale in comparison to AMZN’s impressive 20.2% top line growth, WMT has a
healthier adjusted Net Operating margin of 3.5% compared to the negligible 0.7% margin in AMZN and
2.1% margin in COS. While TGT outperforms in terms of sales growth and net operating margins, they have
the lowest inventory turnover with an average inventory-holding period of about 2 months, compared to
about 1.5 month in WMT. In contrast to the high D/E ratio of TGT, WMT has the least financial leverage
with D/E ratio of only 0.558. This partially contributes to WMT having the lowest ROE of 18.1% among the
offline discount chains, with COS having 20.7% and TGT offering 25%. Another factor is WMT’s lower
asset efficiency of 12.8% RNOA compared to COS’14.2% and TGT’s 14.4%. WMT has an EBITDA
Interest Coverage ratio of 13.6, which is close to 12.1% in TGT. COS has an impressive EBITDA Interest
Coverage of 64.2 and that is due to their much lower interest expense (and lower debt levels). The short-term
liquidity of the three companies can be considered reasonably decent.
VALUATION ASSUMPTIONS
The revenue forecast in eVal suggests a revenue decrease of -0.7%, mimicking fiscal 2016 before trending it
towards the long-term growth rate. However, taking into consideration the significant appreciation of the
USD against foreign currencies, visible in figure 1 in the appendix, it is clear that currency exchange rates
has had an impact on revenue, as 41% of WMT’s revenue comes from outside the US. On a constant
currency basis, WMT sales increased by 2.8%. As the dollar index has remained relatively in line with the
7 of 16previous year during fiscal 2017, we thus expect the impact from foreign exchange on fiscal 2017 overall to
be neutral, allowing for a positive overall revenue growth. To quantify this, revenue has been broken down
into U.S., International, and Sam’s Club segment sales. Growth from increase in of stores and growth from
same-store sales increase was then analyzed separately. For same-store sales (SSS), the Q3 press release
offered estimates guidance for the U.S. and Sam’s Club segments (1.25% each), whilst the International
segment’s SSS growth in Q4 was estimated to follow the past five quarters’ trend. Although still implying a
decrease QoQ, it is becoming less negative each quarter, reaching -3.1% in Q4. See table 3 in appendix for
details. Growth from the opening of new stores was based on the net number of stores WMT has left to open
in Q4 in order to meet its full year guidance on new store openings taking into account how many were
opened Q1-Q3. This guidance was deemed reasonable by comparing how many net stores was opened Q1-
Q3 to the initial guidance, and how store openings had been distributed across the year previous fiscal years.
Notably, Q4 store openings have historically come in larger amounts than those of other quarters, and in
fiscal Q4 fiscal 2017 a net of 150 stores are estimated to be added. The growth will exclusively come from
the U.S, where 170 new stores are anticipated while the International segment is expected to continue to
shrink by 20 stores net. We did not conduct a separate analysis for E-commerce sales due to a lack of
available data, but considering that WMT’s E-commerce sales was less than 1% of total sales in 2016, these
are yet not material enough to call for a separate forecast.
COGS
While the global food deflation may lower COGS for WMT, we believe that this trend is likely to hurt
WMT’s topline to a greater extent, resulting in lower margins. Instead of simply passing cost savings to the
customers, we expect the company to ramp up its aggressive pricing efforts in an attempt to force out less
efficient mega-retailers in a consolidating industry. The ratio of COGS to revenue is expected to rise in the
coming two years as a result of WMT’s strategic move. We anticipate the aggressive slashing of prices to
increase COGS/Revenue the coming two fiscal years before the effects of the campaign bears fruit in
increased market share, lower competition and room to adjust prices to resume the COGS/Revenue to 72.9%
achieved during fiscal 2016.
SG&A
8 of 16SG&A/Revenue has increased during Q2-Q3 fiscal 2017 as part of a 2-year investment in higher U.S. hourly
wages, education and training. The effect is visible in the quarterly statements, and forecasted
SG&A/Revenue for Q4 has thus been adjusted upwards to the average ratio of SG&A to Sales in Q3 and Q4,
resulting in a 1.1% increase.
Effective Tax Rate
The effective tax rate saw a deviation from a neutral trend fiscal 2016, where an item described as “Other,
net” in the tax footnotes had a -2.6% impact on ETR. With no apparent explanation to what exactly caused
this deviation, it is assumed to be a one-time item, which will not affect the ETR going forward. ETR was
thus estimated as the average of the last three years prior to fiscal 2016.
CAPEX
For CAPEX, the fiscal 2016 AR guidance does not look as reliable at a first look. Comparing the first 9
months of the fiscal 2017 with 2016, CAPEX has decreased 9.29%, suggesting a full year CAPEX of
$10.4bn if the trend continues. However, the $11.1bn CAPEX guidance from 2016 AR may very well be
justifiable since we expect a relatively large number of new stores to open in the U.S. segment (170),
compared to the net closures of stores Q4 fiscal 2016 (-57). With this in mind, CAPEX is estimated to be
$11.1bn for the full year.
Depreciation
The last three years has seen depreciation steadily growing while CAPEX has decreased, however, the effect
of lower CAPEX is visible in a slower growth of depreciation. To forecast depreciation, the ratio of
depreciation to CAPEX was thus calculated, and its YoY trend assessed. Assuming that depreciation over
CAPEX would grow in line with the last two years, the full year depreciation for fiscal 2017 was forecasted
at $9962bn, an increase of 5.4%. In practice this is a result of continued high depreciation of capital assets
stemming from the Corporate & support segment, which is seemingly unaffected by decreased CAPEX.
PP&E
PP&E was calculated as PP&E previous year adding CAPEX and less depreciation.
Long-Term Debt
9 of 16During fiscal 2017, $1,519bn of long-term debt will become current, and $135m of new long-term debt has
been issued. No major long-term debt issuance is scheduled for Q4 fiscal 2017, and the long-term debt for
the full year is hence estimated to decrease by $1,384bn.
Financial Leverage
With the acquisition of the remaining shares of Yihaodian, and debt repayments outweighing share buybacks
in the short-term, our forecasts yield just a slightly lower financial leverage (NFO/Common Equity) for the
coming years. However, as share repurchases increase, the trend is expected to turn and move to increasing
leverage to grow more in line with the historical average.
DCF VALUATION OUTCOME
A DCF valuation of free cash flow to equity holders was performed. When determining the cost of equity,
WMT’s raw beta was found to be around 0.55, which despite the positive effect of low correlation with the
market from an investor perspective was deemed too low for market price based valuation purposes. Instead,
the adjusted 2Y Weekly beta one standard error above the estimated mean was chosen. One consideration in
favor of this choice is that the S&P500 the past years may have an unusually low correlation to WMT given
how energy stocks, which have an impact on the index, have been driven by the unusually high volatility in
the price of oil. Using the Damodaran’s latest country-specific equity risk premium, the cost of equity was
determined to be 7.27%, yielding a price per share of $81.63. We therefore recommend buying WMT stock
at today’s (18 Nov) price of $68.54.
Sensitivity Analysis
A sensitivity analysis of the LTGR plotted against the Cost of Equity shows a very wide share price range of
$56.29 - $171.55, allowing for a 1% deviation in the long-term growth initially set at 1.97%, and a 2%
deviation in the cost of equity where our base case is 7.27%. However, the range does favor a buy rather than
sell. Another important driver for the WMT stock price in our model is the SG&A and COGS as a
percentage of revenue. With no R&D costs recorded separately, this is the company’s EBITDA Margin.
From a sensitivity analysis plotting the long-term EBITDA Margin against long-term growth rate, it is
evident that the share price range indeed favors a buy. A long-term EBITDA margin of 7.7% as was the case
10 of 16prior to 2014 yields a share price of $92.62 keeping long-term growth constant at 1.97%. Only in the low-
growth, low-margin scenario does the model yield a stock price lower than that of 18 Nov 2016.
Conclusion & Recommendation
The recommendation for the WMT stock is a simple purchase. Regarding the apparent challenges in
increased competition and lower margins, the advance of E-commerce, and uncertainty about the future of
brick-and-mortar stores, there are few retailers better positioned to adapt such new competitive
environments. With a strategy already in place for such adaptation and attractive stock price DCF-valuation
perspective, WMT stock is a clear buy.
Afterwards, we tracked the six-month stock price movement of Wal-Mart (from 2016 Jan to 2017 Jun) and
surprisingly found that the price climbed from $69.24 to $80.47. It is very close to our prediction ($81.63).
We conclude that DCF models offer reliable valuation of Wal-Mart.
11 of 16BIBLIOGRAPHY
- IBISWorld. (2016, May). Warehouse Clubs & Supercenters in the US (45291). Retrieved November
20, 2016, from http://clients1.ibisworld.com/reports/us/industry/default.aspx?entid=1092
- MARKETLINE 1, (2016, March 25), Wal-Mart Store Inc. [company profile]. Retrieved November
13, 2016, from MarketLine Advantage database.
- MARKETLINE 2. (2016, August). Global Food Retail [industry profile]. Retrieved November 13,
2016, from MarketLine Advantage database.
- PETERSON, H. (2016, October 17), Wal-Mart's price cuts should terrify Target, Dollar General,
and Family Dollar. Retrieved November 24, 2016, from http://uk.businessinsider.com/walmart-
price-cuts-should-terrify-target-2016-10
- STATISTA 1, (2015) Retail e-commerce sales worldwide from 2014 to 2020 (in billion U.S.
dollars), Retrieved November 23, 2016, from:
https://www.statista.com/statistics/379046/worldwide-retail-e-commerce-sales/.
- STATISTA 2, (2016), Wal-Mart's net sales worldwide from 2008 to 2016, by division (in billion
U.S. dollars), Retrieved November 23, 2016, from https://www.statista.com/statistics/269403/net-
sales-of-walmart-worldwide-by-division/.
- WAHBA, P. (2015, November 17), The Big Cloud Hanging Over Walmart’s Improving Sales? Soft
E-commerce Growth. Retrieved November 23, 2016, from http://fortune.com/2015/11/17/walmart-
ecommerce/
- WAHBA, P. (2016, October 18), Walmart’s Price Cuts Could Cost Target Billions of Dollars.
Retrieved November 23, 2016, from http://fortune.com/2016/10/18/walmart-target-price-war/
12 of 16- WAHBA, P. (2016, May 20), The Silver Lining In Walmart’s Slowing E-Commerce Growth.
Retrieved November 23, 2016, from http://fortune.com/2016/05/20/the-silver-lining-in-walmarts-
slowing-e-commerce-growth/
- WAL-MART. (2016). Annual report. Retrieved from
http://s2.q4cdn.com/056532643/files/doc_financials/2016/annual/2016-Annual-Report-PDF.pdf
- WORLDBANK, (2016). Global Outlook. Disappointment, Risks, and Spillovers. Retrieved
November 20, 2016, from: https://www.worldbank.org/content/dam/Worldbank/GEP/GEP2016a-
/Global-Economic-Prospects-January-2016-Global-Outlook.pdf
13 of 16APPENDICES
Table 1 – Reformatted Cash Flow Statement
14 of 16Table 2 – Profitability and Risk Comparison
FY2015 WMT COS TGT AMZN
Sales Growth % -0.7 3.2 1.6 20.2
ROE 0.181 0.207 0.250 0.049
RNOA 0.128 0.142 0.144 0.033
Average Inventory Holding Period 46.5 31.7 59.3 51.3
Debt-to-Equity 0.558 0.580 0.985 0.867
Net Operating Margin (adjusted) 0.035 0.021 0.051 0.007
EBITDA Interest Coverage 13.6 64.2 12.1 19.3
Figure 1 – USD Exchange Rate
15 of 16Table 3 – Revenue Assumptions and Forecast
Revenue
Higher bound Lower bound Average
New stores 2017, guidance from MD&A
405 342 374
Q1 Q2 Q3 Sum
New stores opened Q1-Q3
53 61 70 184
Stores closed Q1-Q3 54 49 16 119
Est. Stores Left to Open in 2017 150
Net new stores per segment Q1-Q3 fiscal US International Sam's Club Sum
2017 113,85% -13,85% 0,00%
Forecasted new stores per segment in Q4 170,58 -20,75 0,00
Forecasted new stores per segment in Q4/2 85,29 -10,37 0,00
Average $ million sales / store in Q4 2016 $17,81 $5,19 $21,59
Forecasted increase in sales from new
store openings $1.519 $-54 $- $1.465
US International Sam's Club Sum
Number of stores end of Q3 fiscal 2017 4648 6289 656
Average $ million sales / store / segment in
Q4 fiscal 2016 $17,81 $5,19 $21,59
Comparable store sales revenue growth
forecast (Q3 press release) 1,25% -3,10% 1,25%
Forecasted sales from current stores in Q4
fiscal 2017 $83.815 $31.618 $14.338 $129.772
Forecasted Q4 Total Sales / Segment $85.334 $31.565 $14.338 $131.237
Full year forecast Q1 Q2 Q3 Q4 Forecast Full year
Revenue from segments in fiscal
2017 Q1-Q3 $114.986 $119.405 $117.176 $131.237 $482.804
Revenue from membership fiscal
2017 Q1-Q3 $918 $1.449 $1.003 $1.255 $4.625
Membership % of revenue 0,80% 1,21% 0,86% 0,96%
Total Forecasted Revenue Fiscal
2017 (000's) $487.428.257
Table 4 – COGS Assumptions and Forecast
COGS
Temp COGS/Revenue
2016 2017 2018 2019 and cont. increase from price
slashing
COGS/Revenue 73,21% 73,21% 73,21% 72,91% 0,30%
16 of 16Table 5 – CAPEX & Depreciation Assumptions and Forecast
CAPEX & Depreciation (Million USD)
Item 2013 2014 2015 2016 2017
CAPEX 12.898 13.115 12.174 11.477 11.100
Change in CAPEX 1,7% -7,2% -5,7% -3,3%
Depreciation 8.478 8.870 9.173 9.454 9.962
Depr % of CAPEX 65,7% 67,6% 75,3% 82,4% 89,7%
Change in Depr % of CAPEX 1,9% 7,7% 7,0% 7,4%
Table 6 – PP&E Assumptions and Forecast
PP&E
Ending 2016 CAPEX Est Depr Est PP&E Forecast
116.516.000 11.100 9.962 116.517.138
Table 7 – Income Tax Expense Assumptions
Income Tax Expense Estimated to stay constant at average of last three years prior to fiscal 2016
where a significat change occurred
Table 8 – SG&A/Sales Assumptions
SG&A/Sales Estmated to stay at average level of Q2-Q3 fiscal 2016 for two years and then
trend back to historical average
17 of 16You can also read