Macro Economic outlook 2019 - International uncertainties Economy is flourishing - Cpb
←
→
Page content transcription
If your browser does not render page correctly, please read the page content below
Economy is International
                                                       flourishing uncertainties
Publisher:

CPB Netherlands Bureau for Economic Policy Analysis
P.O. Box 80510 | 2508 GM The Hague
+31 (070) 3383 380 | info@cpb.nl

September 2018

                                                                   Macro
                                                                   Economic
                                                                   outlook
                                                                   2019
                                                                   MEV 2019,
                                                                   translation of
                                                                   chapter 1
Day of the King’s Speech 2018: the main CPB figures
Economy is flourishing International uncertainties
Netherlands average eurozone
2.8
2018
2.6
2019
2018
2.1
2019
+4.0%
GDP growth, in %
1.9 World trade projected to grow by 4%
in 2019, compared with 2018
GDP growth slightly lower, but remains higher than
the eurozone’s average growth, leading to less Risks are also increasing
unemployment and more favourable public finances
Impact tariff measures still limited to small share
of the world trade; risk of escalation increases
Higher low VAT tariff 9% Inflation
(temporary effect) ↑ 2.5% UK investments are declining in the absence of a Brexit deal.
6% Risk of chaotic ‘cliff-edge’ scenario increases
1.6%
Uncertainty about policies of the new Italian government;
meanwhile, certain companies are able to borrow against
Increasing
a lower interest rate than the national government
labour costs 2018 2019
Purchasing power is improving
due to lower income tax, higher
+1.0%
The budget surplus will be 1.0%
wages and higher child benefits
change in %
in 2019, and 0.9% in 2018 1.5
all households 2019
2018
median: half
1.6 of the group
working population is at 1.5% or
The labour supply is growing and less, the other
unemployment continues to decline 0.8 half at 1.5%
social benefit recipients or more
9.2
2006-2019, in million persons
0.3 1.4
pensioners
8.9
8.4 unemployment 0.6 -2 -1 0 1 2 3 4
7.9
labour force (aged 15-74)
working population
prognosis
39% Downside: 39% of construction companies are faced with staff
shortages, which is a doubling compared to the previous quarter
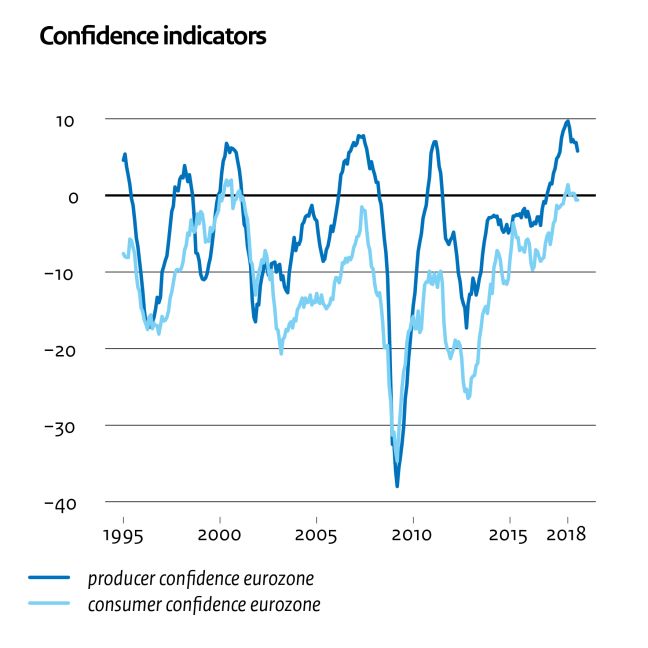
This infographic is based on the MEV 2019. For the original text, graphs and detailed data, see www.cpb.nl © CPB Netherlands Bureau for Economic Policy Analysis, Den Haag 20181 Summary and analysis 1.1 The economy in 2018 and 2019 The global economy is growing steadily, while downward risks are increasing. The global economy is benefiting from accommodating monetary policy in the eurozone, Japan and—to a diminishing degree—the United States. Also contributing to economic growth is the expansionary budgetary policy in both the United States and—to a lesser degree—the eurozone. Although confidence indicators have gone down slightly, they are still high in a historical perspective. Growth in world trade continues to be robust (Figure 1.1, left), but uncertainties are increasing. To date, tariff measures have had only a limited direct impact, but the risk of escalation is increasing. Other current risks to the global economy, such as the uncertainty around Brexit, the Italian budgetary policy, and various geo-political tensions, have increased. The global economy is still growing, across the board. The upturn in the US economy is continuing, partly due to budgetary incentives. In the eurozone, consumption and investments continue to show a positive development. Consumer and producer confidence levels remain high (Figure 1.1, right). European governments are also stimulating the economy. However, the growth rate is slowing down in the eurozone, due to uncertainties about trade policy and higher oil prices. This is also true for Japan. On the other hand, there is a higher growth rate in the oil-exporting countries. Economic growth in the emerging economies in Asia is continuing, while it is slowing down in others, such as Argentina and Turkey. Inflation in the eurozone is going up. European inflation is being pushed up, because of higher oil prices (in 2018) and higher labour costs due to wage increases. Inflation remains below the European Central Bank’s medium-term objective of just under 2%. European monetary policy remains expansionary, despite the booming economy. The ECB has announced a phasing out of its quantitative easing policy. This, however, does not mean an end to uncertainty. In the case of a new recession, there is little scope for the ECB to pursue a stimulating monetary policy, as interest rates are close to zero. There is very little room to continue buying government bonds, within the current framework. Existing risks have increased for the global economy. The economic damage from US trade conflicts with, among others, China and the EU, is still only limited, but the risk of escalation is increasing. Italian interest rates could go up, if confidence in the financial- economic policy of the Italian Government declines, which could get Italian banks into trouble. In turn, this may have a negative impact on confidence in other southern European governments and banks. Furthermore, the risk of a so-called hard Brexit is increasing, by the day. Geopolitical risks and economic setbacks in emerging economies, such as Turkey and Argentina, also may undermine confidence in the economy. 4
Figure 1.1     Favourable international economy slowing down slightly

Source: CPB (link) and European Commission.

In the Netherlands, favourable economic developments are continuing. Household
consumption, public spending and business and housing investments all contribute to the
growing economy (Figure 1.2, left). Despite the declining confidence indicators, both
consumer and producer confidence are still above the multi-annual average. The reduction
in natural gas production will reduce GDP growth by 0.1 percentage point, in both 2018 and
2019. Employment will increase and unemployment will decrease to the second lowest level
of the last four decades. The tight labour market causes upward pressure on wages. Higher
wage costs and the increase in the low VAT tariff will cause inflation to rise.

Economic growth in the Netherlands stronger than in other European countries. This
causes a strong decrease in unemployment, as well as a favourable situation for public
finances. Over the past years, Dutch unemployment continued to be around 4 percentage
points below the eurozone’s average (Figure 1.2, right). Since the economic turnaround, late
2013, unemployment in the Netherlands has halved (from 7.9% to 3.9%), whereas it
decreased by only a third in the rest of the eurozone (from 12.1% to 8.3%). Housing market
developments are having a relatively strong impact on the Dutch economy.

Dutch exports are growing about as strongly as relevant world trade. In particular, re-
exports are continuing to increase, although domestically produced exports are growing less
rapidly compared to the relevant world trade, due to the strong euro. The current-account
balance will decline, gradually, from 10.5% of GDP last year, to 9.9% in the coming year—
which is nevertheless high, from both a historical and an international perspective.

                                                                                               5
Table 1.1 Main data for the Netherlands, 2014–2019
2014 2015 2016 2017 2018 2019
mutations per year, in %
International economy
Relevant world trade volume of goods and services 5.1 4.0 3.6 4.9 3.4 4.0
Competitor prices (a) -0.5 6.1 -3.5 2.1 0.8 1.3
Oil price (in USD per barrel) 99.6 53.1 44.3 55.0 72.5 72.2
Euro exchange rate (USD per euro) 1.33 1.11 1.11 1.13 1.19 1.17
Long-term interest rate the Netherlands (in %) 1.5 0.7 0.3 0.5 0.6 0.7
Volume GDP and spending
Gross Domestic Product (GDP, economic growth) 1.4 2.0 2.2 2.9 2.8 2.6
Household consumption 0.4 2.0 1.1 1.9 2.7 2.3
Public consumption 0.6 -0.1 1.3 1.1 2.0 2.8
Investments (including stocks) -1.3 29.1 -6.7 4.4 4.6 4.1
Exportation of goods and services 4.5 7.4 1.7 5.3 3.0 4.2
Importation of goods and services 3.3 14.5 -2.0 4.9 3.3 4.8
Prices, wages and purchasing power
Price level Gross Domestic Product 0.3 0.8 0.5 1.2 2.0 2.5
Export prices goods and services, excluding energy -0.6 1.6 -1.4 1.9 1.2 1.5
Import price levels -2.6 -5.0 -4.5 4.2 2.2 1.2
Inflation, Harmonised Index of Consumer Prices (HICP) 0.3 0.2 0.1 1.3 1.6 2.5
Wage rate, market sector (per hour) 1.1 -0.2 0.7 1.2 2.8 4.0
Contract wages market sector 1.0 1.2 1.5 1.6 2.0 2.9
Purchasing power, static, median all households 1.2 1.0 2.6 0.3 0.4 1.5
Labour market
Labour force -0.4 0.4 0.4 0.8 1.1 1.0
Working population -0.6 1.0 1.3 2.1 2.1 1.5
Unemployed labour force (x thousand persons) 660 614 538 438 355 320
Unemployed labour force (in % of labour force) 7.4 6.9 6.0 4.9 3.9 3.5
Employment (in hours) 0.7 1.0 2.0 1.9 2.1 1.5
Other
Labour income share (in %) 74.5 72.8 73.6 73.4 73.7 74.3
Labour productivity, market sector (per hour) 0.9 0.8 0.2 0.9 0.8 1.2
Individual saving share (in % of disposable income) (b) 2.9 2.8 3.6 2.9 3.1 2.9
Balance current accounts (in % of GDP) 9.5 6.3 8.1 10.5 10.1 9.9
level in % of GDP
Public sector
EMU balance -2.2 -2.0 0.0 1.2 0.9 1.0
EMU debt (ultimo year) 68.0 64.8 62.0 57.1 53.0 49.1
Public financial burden 37.0 36.9 38.4 38.7 38.7 39.2
Gross public spending 45.9 45.0 44.0 42.9 42.5 42.4
(a) Goods and services, excluding resources and fuels.
(b) Level; the disposable household income includes public saving.
6Favourable income developments lead to strong growth in consumption. The growth in
employment leads to higher incomes and, thus, to more consumption. Rising wage levels, the
overall reduction in the tax burden 1 and the historically high consumer confidence level all
encourage consumption. The increase in real disposable income will peak in 2018, at 2.9%—
the highest level since the late 1990s. A smaller increase in employment in 2019, however,
will lead to slightly less growth in spending.
Figure 1.2 Widespread growth leads to exceptionally low unemployment
(a) The contribution of public spending to GDP growth only concerns direct purchasing power effects of spending through
consumption and public investments. The effects from other public spending, such as income transfers and subsidies, may
contribute to growth via household and business spending. This last point also applies to changes in tax rates.
Source: CBS and Eurostat.
Companies are further expanding their production capacity. The capacity utilisation is
approaching its highest level since the turn of the century (Figure 1.3, left). The positive
outlook, low capital costs and large profits are encouraging business investments. In the
industrial sector, however, producer confidence has been declining since May of this year.
This is partly why a lower growth level is projected for business investments in 2019,
compared to 2018.
Housing investments continue to grow, but at a slower rate than in 2018. The catch-up
growth of previous years will be playing a less important role, next year. In addition, the tight
labour market is forming an increasingly strong hindrance to production levels in
construction (Figure 1.3, right). Housing prices will continue to rise. Nominal transaction
prices will be 1% above the market’s peak in 2008; real prices, however, are still 12% lower.
Price increases in the four largest Dutch cities are substantially larger than in the rest of the
1
Although, in 2019, there will be an increase in the narrowly-defined tax burden with respect to premiums and taxes,
households will nevertheless experience an overall decrease in the broadly defined tax burden when also allowances,
subsidies and child benefits are taken into account.
7country. The number of transactions on the housing market is declining, following a sizeable increase over the 2013–2017 period. Figure 1.3 Economy is booming and is sometimes faced by limitations Source: CBS. It is easy for employment seekers to find a job. Vacancies have reached a record high. One in five companies is currently suffering from staff shortages, which is a doubling of the situation of one year ago. In addition, the government is providing a further impulse to employment growth due to increasing government expenditures. Certain vacancies are being filled by migrants. Workers who had exited the labour market because they could not find a job (discouraged workers) now re-enter the labour market because it is relatively easy to find a job. The rise in labour supply led to a temporary stagnation in the decrease in unemployment during the second quarter, but it has since dropped again. Unemployment is projected to decrease further, to 3.5% in 2019. Long-term unemployment has been declining since early 2015, from 289,000 to 128,000 persons, in the second quarter of this year. Scarce labour becoming more expensive. The tight labour market creates an upward pressure on wages. New collective labour agreements show higher wage rises for 2018 and 2019. Compared to earlier periods of labour market shortages, wage rises to date have been moderate. This may possibly be explained by the lower productivity increases and the recent revival of the permanent employment contract (as an alternative reward system). The pace of further wage rises is an uncertain factor. Many of the collective labour agreements still need to be drafted. A number of negotiation processes are rather arduous, which may mean that strikes will precede wage rises. The public sector is showing an important rise in contract wages. Job changes, bonusses and promotions lead to positive, incidental wage rises. 8
Inflation is in 2019 temporarily pushed up by the increase in the low VAT tariff and
higher energy tax. The higher wage costs will also have an impact on inflation, as will rent
increases.

  Uncertainty risks discussed: Italy and trade war
  Confidence in the economic policy of the Italian Cabinet is waning. The scenario presented here*
  assumes the interest rate on Italian government bonds to increase further and the share price of the banks to
  decline. A strong decrease in the value of Italian bonds will decrease the balance sheet of the Italian banks (a),
  which would jeopardise credit provision in Italy. The Italian crisis, similar to the 2011–2012 debt crisis, may
  spread to other southern European countries and also affect the euro exchange rate. The first scenario
  assumes a 2% increase in long-term interest rates and 10% lower share prices for Italy, Spain and Portugal.
  For the Netherlands and the surrounding countries, a 5% lower share price and 2.5% lower euro exchange rate
  are assumed (b).

  Lower growth levels in southern European countries and increasing uncertainty are affecting the Dutch
  economy. Higher capital costs are slowing down investments in southern Europe. A lower euro exchange rate
  leads to higher inflation via higher import prices, which, in combination with lower share prices, will decrease
  consumption. The lower economic growth in those countries negatively affects the world trade that is relevant
  for the Netherlands. Less demand from abroad is, for Dutch companies, only partly compensated by a better
  competitive position on prices compared to the position of non-European competitors. On balance, this causes
  Dutch exports to decline. A higher inflation in the Netherlands will put pressure on real disposable income, in
  turn leading to a lower growth in consumption. More uncertainty leads to lower investment growth, also in the
  Netherlands. Together, this leads to a lower GDP growth for the Netherlands and a slight increase in
  employment.

  A more widespread US–EU trade war is also bad news for the Dutch economy. The second scenario
  presented assumes five percentage points higher import tariffs between the United States and the European
  Union. This will weaken the competitive position of both US and EU companies on their respective markets,
  disrupt international production chains and increase import prices. The growth in relevant world trade, in such a
  case, would be lower, which in turn would affect economic growth in the Netherlands. This scenario is limited to
  the direct effects of tariffs; it does not take the consequences of the increased uncertainty into account. GDP
  losses are projected to increase further, in the years after 2019 (c).

  Effects of: A: higher interest rates and uncertainty in southern Europe, and B: US–EU trade conflict
                                                                                    A                                         B

                                                                                  Cumulative deviations in 2019 in %

   Relevant world trade, volume                                                  -0.6                                       -0.7
   Import prices, goods                                                           1.8                                        0.9
   Contract wages market sector                                                   0.3                                        0.1
   Consumer price index (CPI)                                                     0.9                                        0.4
   GDP, volume                                                                   -0.5                                       -0.3
   Household consumption, volume                                                 -0.6                                       -0.2
   Business investments, volume                                                  -1.6                                       -0.3
   Export goods, volume                                                          -0.5                                       -0.5
   Employment, hours worked                                                      -0.2                                       -0.1

   (a) Also see CPB’s risk assessment of the financial markets 2018, 29 May 2018, Chapter 4, p.37 (in Dutch) (link).
   (b) External effectsentering Saffier,CPB’s macro-economic model for the Dutch economy have been calculated using NiGEM
   (international macro model). External shocks are assumed to occur from the fourth quarter of 2018 onwards. This scenario is
   not focused on policy and, thus, does not include a policy response by the central banks or any effects of European budgetary
   standards. The analysis does not take a bank run into account, or the impact of lower consumer confidence in Europe, or the
   Italian government applying for ECB support (via OMT).
   (c) Up to 1.1% in 2030. This was calculated using WorldScan, see Bollen J, and H. Rojas-Romagosa, (2018), Trade Wars:
   Economic impacts of US tariff increases and retaliations, An international perspective, CPB Background document (link).

                                                                                                                                   9
Downward risks have increased for the Netherlands. Although there are no clear indications of an economic turning point, international risks are increasing. Should these risks of an Italian banking crisis or trade war indeed take place, they would have a strong impact on the open Dutch economy. In the short term, a 0.5% decline in GDP could be imagined (see text box). In, for example, the construction sector, a tight labour market could hamper growth. A tight labour market also means it is more difficult for the government to realise higher expenditures on health care, defence and education. Another important uncertainty concerns the pace at which wages are increasing. If this should be slower than projected, consumption and production growth will be lower, too. Most household incomes are increasing more rapidly than inflation. In 2019, average purchasing power will improve for all groups. The overall tax burden, on the one hand, is reduced as a result of the implementation of the two-bracket tax system and due to the general tax credits and pensioner credits, and increased, on the other, such as by higher VAT. The policy-induced development of the tax burden will cause inflation to increase for households. This will be included in the wage negotiations. This can be seen in a higher contract wage rise. Households with children will experience more purchasing power because of higher child benefits. The projections of purchasing power are less positive for social benefit recipients than for other groups, as they will benefit to a lesser degree from the reductions in tax burden as described above. The planned steep increase in public spending appears difficult to realise. Due to strong economic growth, the increases in the expenditure on education, defence and health care will not lead to a clear deterioration in the government. The budget balance is projected at 0.9% of GDP in 2018 and 1.0% in 2019, compared with 1.2% in 2017. It appears difficult to realise the additional expenditures this year. The tight labour market means that not only companies but also government is facing staff shortages. The lower natural gas revenues are playing only a limited role in the budget balance. The structural budget balance, central to the EU budgetary regulations, is projected to decrease in 2019 to -0.4%, which is just above the medium-term objective (MTO) of -0.5% of GDP. 10
1.2 Good investment climate without tax avoidance
As a trading nation and the seat of multinationals, the Netherlands is pursuing
national and international policy, in order to remain a relevant economic player.
Traditionally, the Netherlands collaborates on an international level to facilitate and secure
international trade. This started as early as in the Golden Age, where Hugo de Groot
presented his book Mare Liberum (Freedom of the Seas). At the same time, the Netherlands
is also pursuing national policy to appeal to the international business community. This
policy is effective, seeing the high ranking of the Netherlands on international lists. This is
due to the highly educated labour force, the good infrastructure, macroeconomic and
political stability and an attractive climate for business and innovation. 2
International tax competition is eroding tax revenues from capital income, on a global
level. Besides international collaboration, there is also competition, particularly for capital.
This battle is no longer waged at sea, with war ships and canons, but by way of taxation.
Taxes on capital income, in addition to taxes on labour and consumption, need to be levied in
order to fund public amenities. 3 In the wake of the financial crisis, with public debt and
inequality increasing, international initiatives have emerged to counter the erosion of the tax
base for corporate profits: the BEPS 4 action plan by the G20/OECD and the EU’s Anti Tax
Avoidance Directive (ATAD).
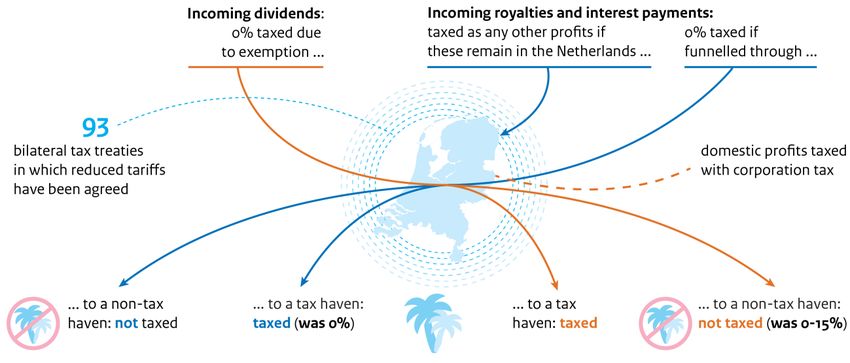
The Netherlands functions as a ‘conduit country’, facilitating tax avoidance. In 2017,
foreign capital goods stocks in the Netherlands totalled around 45,000 billion euros (six
times GDP), 70% of which flowing through special purpose entities (SPEs). After a brief
transit stop, the lion share of the money ends up abroad. Each year, around 180 billion euros
in dividends, interest and royalties are being funnelled through the Netherlands. 5 These
flows are created by multinationals to relieve the effective tax burden by shifting profits ‘on
paper’ to countries where tariffs are low, among them tax havens. 6 The contributing
elements are: the dividend participation exemption, the large number of bilateral tax treaties
with agreements about mutually reduced withholding taxes on dividends, and the absence of
withholding taxes on interest and royalties. 7 In addition, tax planning also depends on
corporate taxation in other countries. The recent tax reform in the United States will have its
impact on the ‘conduit function’ of the Netherlands.
The conduit function places the Dutch fiscal business climate in a bad light. The
revelation of international financial constructions used by multinationals and private
2
See the World Economic Forum, Global Competitiveness Report 2017–2018 (link). According to this report, the
Netherlands is in fourth place, and this is also the case in the World Competitiveness Ranking for 2018, by the IMD World
Competitiveness Center (link).
3
Lejour, A. and M. van ’t Riet, 2015, Een meer uniforme belasting op kapitaalinkomen [A more uniform taxation of capital
income (in Dutch)], CPB Policy brief 2015/16 (link).
4
BEPS = Base Erosion and Profit Shifting
5
Source: DNB, 2017.
6
Torslov, T. R., L. S. Wier and G. Zucman, 2018, The Missing Profits of Nations, NBER Working Paper No. 24701 (link).
7
Lejour, A. and M. van ’t Riet, 2013, Bilaterale belastingverdragen en buitenlandse investeringen [Bilateral tax treaties and
foreign investments (in Dutch)], CPB Policy Brief 2013/07 (link).
11citizens damages the international reputation of the Netherlands. This has happened when documents were leaked, as with the Panama Papers, and the investigation by the European Commission into alleged unlawful state aid. 8 In the past, tax measures were used to promote the Netherlands as a good business location. The conduit function was interpreted as an unavoidable by-product of a good business climate. Below, we will argue that this does not need to be the case. Limit the conduit function and preserve the Netherlands as an attractive business location. This is the Dutch Cabinet’s objective. 9 Below, for a number of tax measures, we examine whether this can be done. For the factors related to business location, this mainly concerns efficiency; the degree to which a certain measure affects the net return on capital and thus the investments and commercial activities in the Netherlands. The effects of the measures on the conduit function are described in qualitative terms, on the basis of the tax burden on financial flows. This concerns a comparison of various fiscal factors; the possible additional revenue was not included in the analysis. Figure 1.4 The Netherlands, conduit country The dividend participation exemption is the flagship of the Dutch fiscal business climate. Incoming dividends are not taxed in the Netherlands, because they fall under the dividend participation exemption, to avoid double taxation, from the notion that profits of subsidiaries are already being taxed abroad. Therefore, for foreign multinationals, it is attractive to establish the seat of their company here, and to transfer dividends through the Netherlands. In the past, dividend exemption was rather unique, but meanwhile, many other countries have also included such exemption in their legislation, and it is currently also included in the EU Parent-Subsidiary Directive. Precondition, here, is that the parent company owns a substantial share of the foreign subsidiary. 8 Dutch Government, 2018, Parliamentary letter ‘Aanpak belastingontwijking en belastingontduiking’ [Approach to tax avoidance and tax evasion (in Dutch)] (link). 9 Dutch Government, 2018, Parliamentary letter ‘Aanpak belastingontwijking en belastingontduiking’ [Approach to tax avoidance and tax evasion (in Dutch)] (link). 12
The treaty network is good for the business climate, as well as for ‘treaty shopping’.
The Netherlands has an extensive network of bilateral tax treaties. These treaties contain
mutual agreements about reducing and preventing double taxation and about the exchange
of information on those liable to pay tax. The Netherlands is more successful than other
countries in making agreements about lower withholding taxes. 10 This is attractive for
internationally operating companies within the Netherlands, as it lowers the average tax
burden on the profits of their foreign subsidiaries. In addition, it encourages multinationals
to establish subsidiaries in the Netherlands that can, thus, be used for funnelling such
financial flows. ‘Treaty shopping’ also contributes to tax savings. 11 It is important for
companies to have assurance, in advance, about which financial flows will and will not be
taxed. This assurance may be established by so-called rulings by the Dutch tax authority. As
part of the BEPS action plan, the Netherlands is implementing measures to combat misuse of
the treaties.

The Dutch corporate income tax (vpb) rate is a relevant factor for the business
climate, but not for the conduit function. Surveys of studies have shown that a one
percentage point decrease in the effective marginal tariff leads to a four per cent increase in
expansion investments. 12 For the average tariff, which is more important for the
establishment of a company, the effect is even greater. From a global perspective, this policy
leads mostly to a shift of investments. The vpb tariff often is not relevant for the funnelling of
money; incoming dividends are not considered taxable profits in the Netherlands. Transfer
flows of interest and royalties are taxable, but also can be deducted, and the profits of the
operational activities are only limited.

The effective tax burden is determined by the statutory rate and the tax base. These
days, tax return forms in many countries have an innovation box with a reduced corporate
income tax rate to stimulate investment in research and development. This may attract
multinationals and could also increase tax competition. Flexible conditions of this box may
also encourage profit shifting. 13 The Dutch Cabinet ‘Rutte 3’ proposed restricting the
compensation of losses to six years ahead, which increases the tax base of the corporate
income tax (vpb). If multinationals take possible losses into account, this may have a
negative impact on the Dutch business climate. The scientific literature is ambivalent on the
subject. 14 Reasonably speaking, it is not expected to have an impact on funnelled money
flows. Restricting the deductibility of interest costs is a way of limiting loans-related fiscal
benefits. Loans between the various subsidiaries of a multinational corporation can be a way
of reducing the taxable profits with deductable interest in countries with a relatively high
profit tax. The tax base, in such cases, is then shifted to countries with a low profit tax. The

10
   Lejour, A. and M. van ’t Riet, 2013, Bilaterale belastingverdragen en buitenlandse investeringen [Bilateral tax treaties and
foreign investments (in Dutch)], CPB Policy Brief 2013/07 (link).
11
   Riet, M. van ’t and A. Lejour, 2018, Optimal tax routing: a network analysis of FDI diversion, International Tax and Public
Finance 25(5), 1321–1371 (link).
12
   Mooij R.A. de, and S. Ederveen, 2008, Corporate tax elasticities: a reader's guide to empirical findings, Oxford Review of
Economic Policy, Vol. 24(4), pp. 680–697 (link).
13
   CPB, 2016, Kansrijk innovatiebeleid [Promising innovation policy (in Dutch)] (link). Since the publication of this report,
conditions have been made more stringent.
14
   Dressler, D. and M. Overesch, 2010, Investment Impact of Tax Loss Treatment – Empirical Insights from a Panel of
Multinationals, ZEW Discussion Paper 10-097 (link).

                                                                                                                            13
EU ATAD directive restricts the deductible interest costs to 30% of the profits. 15 ATAD will increase the tax burden by around 5%. 16 As the EU directive is being implemented in all Member States, the EU arena will hardly change. 17 Assuming that many of the foreign investments are focused on a particular region, the impact on the business climate in the Netherlands will likely be very limited. A withholding tax on dividends will make it more expensive to funnel profits. The tax burden on distributed profits is partly determined by the withholding tax on dividends. Although the economic theory is not unambiguous, there seems to be consensus about tax on dividends having far less impact on economic activity, compared to that of a corporate income tax. 18 A CPB study shows that countries with a low tax on incoming dividends and those that do not charge any dividend tax themselves, often are used as conduit countries. 19 The proposed abolition of dividend tax, in principle, will encourage the funnelling of dividends. The impact will be smaller because an exception will be made for low-taxed destination countries. A conditional withholding tax on dividends, interest and royalties to tax havens makes ‘treaty shopping’ via the Netherlands less attractive. Although the Netherlands also taxes profits and other types of income, the country is sometimes considered a tax haven, because it facilitates income flows to other tax havens and countries with lower taxes. Under a conditional withholding tax, the financial flows to other countries remain untaxed. Regular corporations, with subsidiaries in the Netherlands and a foreign parent that does not have its seat in a low-tax country, will not be affected. This will gradually become apparent in international statistics on bilateral income flows and investments. Although this may have a positive impact on the reputation of the Netherlands, it is likely to shift tax avoidance practices to other countries. International collaboration should be the ultimate goal. Companies have become increasingly clever at finding new routes to save on taxes. The recognition of this development being a problem opens the door to a proactive attitude in an international collaboration. Collaboration is the most effective way, for example through improvements in international data exchange and closer coordination of policies, such as on a minimum EU withholding tax. The fact that containment of the conduit function is possible without hurting the business climate offers possibilities for greater ambitions, also unilaterally. For example, the number of SPEs may be restricted by more stringent substance requirements 15 The ATAD directive also contains other fiscal measures to counter tax evasion, but, on average, those have far less effect on the tax burden than is the case for the measure of limiting interest rate deductions. 16 Certificering budgettaire ramingen fiscale maatregelen [Certification of budgetary projections of fiscal measures (in Dutch)], CPB Communication, 18 September 2018 (link). 17 There are national differences in the application of a ‘group escape’ and a limit of either 1 or 3 million euros. The Netherlands, for example, has chosen for the stricter variant, which may lead to an increase in the tax burden. 18 Jacobs, B., 2018, Blind gokken met de dividendbelasting [Blind bets on dividend tax (in Dutch)], journal:Tijdschrift voor politieke economie (link). 19 Riet, M. van ’t and A. Lejour, 2018, Optimal tax routing: a network analysis of FDI diversion, International Tax and Public Finance 25(5), 1321–1371 (link). 14
and supervision, or the criterion for a low tax rate could be expanded under the conditional
withholding tax. 20

BEPS may prove to be the incentive for a new Mare Liberum about international taxation of
corporate income. In the end, international coordination will be the most effective approach.
In the meantime, as long as this is not yet the case, the Netherlands could make real inroads
and repair the damage to its reputation, without losing the battle over capital.

20
  Vleggeert and Vording propose to extend the conditional withholding tax with a test on the effective tax rate. In that case
the tax can not be avoided via countries which are not tax havens themselves, but which do not levy withholding taxes to
tax havens (J. Vleggeert en H. Vording, 2017, A Tax on Aggressive Tax Planning, University of Leiden (link)).

                                                                                                                           15
Publisher:
CPB Netherlands Bureau for Economic Policy Analysis
P.O. Box 80510 | 2508 GM The Hague
+31 (070) 3383 380 | info@cpb.nl
September 2018
Macro
Economic
outlook
2019
MEV 2019,
translation of
chapter 1You can also read