Evaluation of the theoretical and in-use performance of Exhaust Air Heat Pumps
←
→
Page content transcription
If your browser does not render page correctly, please read the page content below
E3S Web of Conferences , 06003 (2021)                                                                 https://doi.org/10.1051/e3sconf/202124606003
Cold Climate HVAC & Energy 2021

       Evaluation of the theoretical and in-use performance of Exhaust
       Air Heat Pumps
       Paul D O’Sullivan1*, Shane Colclough2,3, John Morehead4 and Adam O’ Donovan1
       1Department  of Process, Energy & Transport Engineering, Munster Technological University, Cork, Ireland
       2Department  of Architecture, Planning and Environmental Policy, University College Dublin, Dublin, Ireland
       3Ulster University, Newtownabbey, BT370QB, UK
       4Wain Morehead Architects, Pembroke Street, Cork, Ireland

                      Abstract. Integrated units that combine Exhaust Air Heat Pumps (EAHPs) with Heat Recovery Ventilation
                      (HRV) and, in some instances, Domestic Hot Water Storage (DHW), are becoming increasingly popular in
                      the domestic market across Europe with over 24,000 EAHPs purchased in the EU in 2017 alone. Early
                      research into using EAHPs demonstrated energy savings being conservatively between 20% and 50% when
                      compared to conventional systems. Recent research has suggested that, in reality, EAHPs in-use energy
                      performance can be worse than that estimated by various standardised theoretical assessment methods
                      (COP/SPF in the range of 0.4 to 6.0). More worryingly, published data on this in-use operation is effectively
                      non-existent for NZEB type dwellings and few studies have stress tested the robustness of the EN standards
                      in accounting for the effects of in-use operation. The study presented in this paper investigated whether the
                      standard methods used to predict in-use energy performance are sufficiently robust and adequately capture
                      operational performance for EAHP systems. The energy performance of two identical EAHP systems in
                      Ireland (one rural/ one urban) were monitored for close to 12 months. During the live in-use monitoring
                      period, the EAHPs had ‘heat-pump/heat recovery only’ operating mode ratios of 16%/84% and 22%/77%
                      for rural and urban systems respectively. The average HRE in-use efficiency was 92% and 64% for the rural
                      and urban systems respectively. While the manufacturers stated Seasonal performance factors (SPF)
                      ranging from 2.2 (for DHW) to 5.8 (for Space Heating), the average in-use SPF was found to vary between
                      1.7 and 3.8 depending on the boundary reported and the location. More research is urgently required in order
                      to bring much needed clarity for designers and energy assessors regarding which boundaries can be
                      universally applied to EAHP systems. Given the range of SPF which could apply to the HP's examined, the
                      paper highlights the importance of ensuring that realistic indicators of in use performance are provided,
                      aiding appropriate decision-making by policymakers, industry and end-users.

       1 Introduction                                                            need to rely on demonstrated performance of real
                                                                                 systems to adjust our expectations and to calibrate the
       With the transition to low energy housing across Europe                   standardised methodologies adopted by manufacturers.
       integrated units that combine Exhaust Air Heat Pumps                      This is particularly important for policy makers to
       (EAHPs) with Heat Recovery Ventilation (HRV) and, in                      determine appropriate future pathways for the building
       some instances, Domestic Hot Water (DHW) Storage,                         sector as well as choosing more realistic policies that can
       are becoming increasingly popular in the domestic                         meet the collective expectations of citizens investing
       market with over 320,000 EAHP systems installed to                        their limited resources in such solutions. Research on
       date [1], and 24,000 of these purchased in 2017 alone                     the performance of EAHPs has been well documented
       [1], (less than 1000 of the total EU EAHP stock is in                     over the past 40 years. Limb et al. documents much of
       Ireland [1]). As these new systems are gaining                            the early work in this area in the mid 90’s [2]. Limb
       popularity as a useful contributor to reducing energy                     highlighted that residential air-to-water EAHP systems
       consumption in homes it is worthwhile investigating                       could achieve COP’s of between 2.0 to 3.5 on average
       their in-use energy performance and whether this                          and up to 5.0 in “extremely favourable cases” and
       deviates from certified performance. Manufacturers                        COP’s of between 2.0 and 5.0 for air-to-air systems [2].
       typically offer bench data for energy performance of                      Studies contained within their review identified
       HPs based on standardised test points and this is                         considerable energy savings with EAHP systems when
       valuable in early design stage decision making for                        compared to other conventional systems at the time.
       designers given the building or system details are                        Average energy savings of between 25% and 50% were
       understandably unavailable. This data becomes                             reported and upwards of 60% in some cases [2]. More
       redundant once the systems are installed and instead we                   recent field studies have indicated that EAHPs have
                                                                                 generally underperformed when compared to design

       *   Corresponding author: paul.osullivan@cit.ie

  © The Authors, published by EDP Sciences. This is an open access article distributed under the terms of the Creative Commons Attribution License 4.0
  (http://creativecommons.org/licenses/by/4.0/).
E3S Web of Conferences , 06003 (2021) https://doi.org/10.1051/e3sconf/202124606003
Cold Climate HVAC & Energy 2021
expectations [3]–[7]. Charlick and Summerfield et al. 2.1 Performance metrics, boundaries and
[3] reported COP’s of between 1.4 and 2.8 for EAHPs measurements
in the UK. Mikola and Kõiv et al. [4], [5] reported
COP’s of between 2.9 and 3.4 depending on the outside EAHPs with integrated HRV are complex systems that
conditions in Estonia. Littlewood and Smallwood et al. typically fulfil SH, DHW and ventilation requirements
[6] reported COP’s between 0.4 and 1.7 for EAHP’s in in low energy dwellings. Therefore, the metrics used to
the UK. Rämä et al. reported COP’s of between 2.0 and assess their performance are many. Equation 1 describes
4.0 for EAHP’s depending on conditions in Finland [7]. the Heat Recovery Efficiency (HRE) ( ) as
However, simulations of EAHPs have indicated that defined by I.S. EN 13141-7:2010 [10] for the supply
EAHPs can achieve average seasonal values of between side.
3.6 and 6.0 [8], [9]. Thalfeldt, Kurnitski and Latõšov et
al. [8] modelled the performance of EAHP systems in −
= × [−] (1)
Tallinn, Estonia. This work indicated that EAHP’s can −
achieve seasonal co-efficient of performance (SCOP)
values of 3.6. La Francastoro and Serraino et al. [9] Where, is the outdoor air temperature, is the supply
validated and simulated an EAHP model for conditions air temperature, is the extract air temperature and
in Italy. This work highlighted that EAHP systems can and are the volumetric flowrates, in m3/s, of both
achieve average seasonal values of between 4.5 and 6.0 supply and extract sides of the system respectively.
[9]. The aim of this paper is to report field study results Equation 2 describes the calculated heat capacity of heat
from an in-use energy performance investigation of two pumps ( ) according to EN 14511-3 [11].
EAHPs located in PassivHaus certified dwellings
Ireland, one in a rural setting and one in an urban setting. = [] (2)
The paper also discusses different calculation
boundaries for determining an EAHP system SPF along
with a comparison between different calculated SPFs Where, q is the volumetric flow rate in m3/s, ρ is the
and those observed in-use. The paper provides an density of water or air in kg/m3, Cp is the specific heat
overview of the systems and how their performance was capacity of the heat transfer medium at constant pressure
monitored, presents results from the field study and in J/kg K and is the difference in temperature (in
finally discusses how these results might be reconciled this case we refer to temperature across the evaporator ),
with the standardised approaches to calculating SPFs. expressed in Kelvin, K. Equation 3 describes the Co-
efficient Of Performance (COP). The COP is defined in
EN 14511-1 as the ratio of useful heating capacity to
2 Materials and Methods effective power input.
The dwellings utilised in this study were two
PassivHaus certified buildings, constructed in 2014 and = [−] (3)
2015, both achieving A1 ratings in national Building
Energy Rating (BER, EPC equivalent) certificates. Both
were detached houses with floor areas of 256m2 and Where, is the heating capacity expressed in Watts
288m2 respectively. Both buildings had the same (W) and is the effective power input expressed in
combined HRV and EAHP system for ventilation, Space Watts (W). The metrics used to assess heat pumps in-
Heating (SH) and DHW purposes with an additional use performance can vary, though, the most commonly
separate air to water or ground to water heat pump used reported metrics are either time-averaged COP or
as part of an underfloor heating system that are both Seasonal Performance Factors (SPF). The SPF and
capable of generating hot water as well but were not monitoring for heat pump systems in the building sector
covered in this study. While it is expected that the (SEPEMO-Build), more commonly known as the
additional heat pumps may interact with the EAHPs, the SEPEMO project, defined a series of system boundaries
focus of this work is to characterise the performance of that can be used to calculate system efficiency over a
EAHPs and their accompanying HRV systems. The heat defined time interval [12]. Equation 4 describes the
output of the unit varies according the flowrate or fan calculation of SPF at the
boundary.
setting. The thermal output of both systems as tested
according PassivHaus guidelines varied between
(
) = [−] (4)
0.53kW to 1.14kW at a flowrate of 172m3/h. The
thermal output quoted in manufacturers technical
datasheets is 2.4kW at 220m3/h, however, the unit’s fans Where, describes the energy delivered by the heat
are capable of delivering higher flowrates. Mechanical pump and describes the work of the heat pump. In
ventilation was utilised by both dwellings continuously this study, the work of the heat pump only was
for the entire year, excess heat was removed by natural calculated by excluding fan power for energy
stack ventilation. measurements which included the power for the entire
unit. The fan power for each fan was calculated using
available manufacturer data which indicated that fan
power could be calculated using a value of 0.22W/m3
for a given flowrate. Table 1 indicates which
2E3S Web of Conferences , 06003 (2021) https://doi.org/10.1051/e3sconf/202124606003
Cold Climate HVAC & Energy 2021
components are typically included in SPF calculations, system in this study. As was mentioned previously, the
and how the heat output is considered. More recent work manufacturers rated performance refers to EN 14511
on the in-use performance of conventional air-to-water [14] when quoting COPs for the air-to-air system and
heat pumps (AWHPs) introduced another boundary does so for the system as a whole, which includes the
which also includes the DHW tank losses (SPF - H5) heat recovered by the HRV aspect of the system in SH
[13]. The boundaries described in this paper are mode only. As such, the difference in temperature used
intended to be generally applicable. These are in many to determine the heat capacity of the system is calculated
ways more relevant to typical AWHPs and are seldom by the difference between inlet air temperature ( ) and
reported for field studies of EAHPs as EAHPs were the supply air temperature ( ) and is stated for different
excluded from the SEPEMO projects field studies [12]. volumetric flowrates. In the absence of flow and return
To reflect the performance of EAHPs it is important to temperature measurements for the both inlet and outlet
consider different points in the system in a similar way of the condensers, the temperature difference on the
to the SEPEMO methodology. Figure 1 below indicates evaporator side is used to determine the heat output of
the temperature measurement points for the EAHP the heat pump.
Fig. 1. Measurement locations for sensors at system level for each EAHP
Table 1. Comparison of in-use measurement boundaries from SEPEMO, this study (SPF-H3,ex) and relevant standards and standardised
values used in Ireland (HX refers to ‘heat exchanger’)
DEAP 3.2.1
PHPP V9.0
EN 16147
EN 14511
SPF H3,ex
Component or heat source
SPF H1
SPF H2
SPF H3
SPF H4
Compressor x x x x x x x x x
Brine fan/pump x x x x x x x
Back-up heater x x x x x x
Buffer tank/pump x x x
SHW fans/pumps x x x
Heat on condenser side x1 x1 x1 x1 x1 x1,2 x1,2
ΔQ evaporator side ( ) x1,2 x1,2 x1,2 x2 x2 x2
ΔQ inlet air and discharge air ( ) x2
Heat from HX ( ) x2 x2
1
Used in typical AWHPs in-use
2
Used for EAHPs
In this study, we use the definitions described in Table inefficiencies within the refrigerant circuit of the EAHP
1 to reflect SPFs at different boundaries for EAHPs. By between evaporator and condenser sides. AWHP
using the evaporator side of the system, , we are performance standards like EN 14511 [14], EN 14825
presenting an energy performance based on the [15] and EN 16147 [16] for SH and DHW typically use
maximum transferable energy from the heat source for the condenser side of the system for calculations. Given
the EAHP and as such we do not account for any minor the unique nature of combined HRV and EAHP
3E3S Web of Conferences , 06003 (2021) https://doi.org/10.1051/e3sconf/202124606003
Cold Climate HVAC & Energy 2021
systems, the PassivHaus Institute adopt a different Figure 1. The second source of data for this study came
approach for test data which includes the enthalpy from Efergy [17] energy monitors which were installed
across the evaporator and the enthalpy between the at the electrical board of each house. The third source of
outside air and the discharge air in the system. data for this study was data taken from the nearest
Consideration could also be given to the standing heat national weather stations and was accessed from Met
losses from the DHW tank, however, they are excluded Éireann’s website [18]. Measurements were conducted
in this study. Empirical field measurements of outdoor for a continuous period during 2020 between February
airflow rates (inlet) and extract airflow rates (outlet) and December. All instruments used for calculations in
were conducted across the full range of operating fan this study were sampled at a 1-minute interval. SPF and
speeds using a hot wire anemometer at locations HRE values were subsequently calculated using a 1-
analogous to and in Figure 1. The accuracy of the minute dataset and then averaged over one-hour time
anemometer (TA 430) used for flow rate measurements intervals. All data statistical data processing and
was ±10%, the duct at the measuring point had a analysis was completed using R-Language [19].
diameter of 160mm for both systems. The results from
these measurements can be found Appendix 1. Finally,
the calculation of an SPF at a new boundary for EAHP 3 Results and Discussion
is suggested in this study (SPF- H3,ex). SPFs are In order to calculate in-use SPF and HRE values, we
calculated only for periods when the exhaust air heat mapped the times each different operating mode was
pump is activated, and excludes all other modes of active for each EAHP system. Overall, the heat pump is
operation. Only modes that are relevant to SH or DHW activated more in the urban location than in the rural
are considered, which make observations more location with each system in ‘heat exchange mode only’
comparable to other heat pumps or different systems. for 84% and 77% of the monitoring period respectively.
Data were obtained from three sources for each of the The heat pump was operated for 16% and 22% of the
EAHP systems. The first source was data from the monitoring period for rural and urban locations
manufacturers integrated data logging system which respectively. The ‘Bypass mode’ was observed in the
gathered data on; operational modes, set-points, fan urban location only, during part of August (which
operational points and temperatures at various points in represented 1% of the monitoring period.)
the system including in the DHW tank as is shown in
Table 2. Calculated values of heat recovery efficiency (HRE) for both HRV sections of both EAHPs compared with standardised
values. (Mean values have been indicated in bold)
Rural Urban
Source
Min Max Mean Min Max Mean
Measured 75% 99% 92% 28% 72% 64%
Manufacturer* - 94% 88% - 94% 88%
PHPP - - 78% - - 79%
DEAP - - 84% - - 88%
*
Estimated based on manufacturer supplied information and typical unit flowrates
Table 3. Calculated SPFs for both EAHPs during monitoring from February to December 2020 according to system boundary
compared to manufacturer reported and standardised values. (Equiv. Boundary refers to the equivalent in-use boundary, bold indicates
mean values)
Equiv. Rural Urban
Source
Boundary Min Max Mean Min Max Mean
SPF – H1 - 0.0 6.2 2.6 0.1 6.4 3.8
SPF – H3 - 0.1 3.1 1.7 0.3 3.8 2.4
SPF – H3,ex - 2.3 5.1 3.6 2.3 5.0 3.8
Manufacturer (DHW)1 H4 - - 2.2 - - 2.2
PHPP (DHW+SH) H3,ex - - 2.4 - - 2.0
DEAP (DHW) H4 - - 2.1 - - 2.1
Manufacturer (SH)2 - 2.9 5.8 4.6 1.7 5.7 4.0
1
Value was calculated using the relationship between fan speed and airflow rate defined in Appendix 1
2
Calculated using a linear fit of COP and inlet air temperature, based manufacturer data for flowrate of 220m3/h
Table 2 compares the in-use heat recovery efficiency of performance model (used by the building-system
the EAHP units in both locations with values taken from designers PHPP version 9.0 was used for rural location
the Passive House Planning Package (PHPP) energy and version 9.3 was used for urban location). The
4E3S Web of Conferences , 06003 (2021) https://doi.org/10.1051/e3sconf/202124606003
Cold Climate HVAC & Energy 2021
calculated value from the Irish Asset Rating tool for Interestingly, from Table 3 it is observed that both
Dwellings, the Dwelling Energy Assessment Procedure DEAP and PHPP have similar values albeit at different
(DEAP) (version 3.2.1 was used for both), as well as boundaries. Table 3 and Figure 2 illustrate the challenge
manufacturer quoted values. Based on Table 2 we can that exists in defining universally applicable EAHP
see that there can be a variation in the HRE and that a boundaries. Depending on which boundary is applied
static value is not representative of annualized different observations can be made. Minimum and
performance. We can also see a variation between maximum values reported at different boundaries are
locations. The Urban system was found to underperform comparable with the work described earlier (SPF
when compared both PHPP and DEAP, while the Rural between 0.4 and 6.0). The average SPFs reported in this
system was found to outperform values from PHPP and study would appear to be better correlated with the
DEAP. Depending on which standard we use for DHW values. However, it is suspected that while the
comparison the relative difference between measured mean values presented comprise of a small subset of ‘SH
values and standards was between 15% and 28%. mode’ performance, the vast majority of the data
Contrary to this, the same system in the Rural location appears to represent ‘DHW mode’. Comparing in-use
was found to outperform standards by 4% to 14% in performance directly with SH mode will lead to an
relative terms. The main cause for the large difference underperformance given the systems are in DHW mode
between standardised and measured HRE, is likely to be primarily, while the small subset of SH mode
due to unbalanced flows. In a study of both centralised performance data is also likely skewing the DHW mode
and decentralised systems Merzkirch et al. found that comparison. Identifying these “modes” has proved
systems that are unbalanced can lead to decreased heat challenging given the unavailability of modal data
exchange efficiency [20]. Flows in the Rural location beyond ‘heat pump mode’ and ‘Heat exchange only
would appear to be more balanced. Table 3 provides a mode’. Further work is underway to resolve this. The
summary of the in-use performance of both EAHPs types of buildings that are studied in this paper (A1
when the compressor was activated for the monitoring rated, Passive Houses) are designed to minimise heat
period considered. The results are again compared with demand and would appear to have a very low heat
derived values from the Manufacturer, PHPP’s demand and thus the DHW load is much higher in
equivalent SPF and DEAP. As can be seen there are proportion to the SH load. Despite this, Figure 2
some clear differences between values reported in indicates that depending on the boundary reported
standards, which report different information at different performance values can be seen and thus
different boundaries. In DEAP, the renewable portion differing comments on performance. The difficulty in
of EAHPs are considered only for the refrigeration analysing these systems is that while it is clear from
capacity of the system [21], which excludes the heat technical datasheets that overall system level
recovered in the system. For DHW, the test results from performance using the HRV can be impressive, only
EN 16147 (or an equivalent standard) are modified for values for SH are quoted with any clarity. The average
Irish load profiles and for supplementary heat system level (H3,ex) SPF’s in this study (3.6 to 3.8) are
requirements to get water to 60°C, this method uses data considerably higher than the work of Mikola et al. [4],
from the condenser side calculation. In PHPP, a more [5] (mean system level COPs of 2.5, heat pump only 2.9
system level approach is taken, which allows for to 3.1) and are also higher than the work of Littlewood
additional energy from the ventilation system. and Smallwood et al. [6] (Maximum values of 1.73).
Fig. 2. Scatterplots of SPF with respect to inlet temperature (T1) for three different boundaries
5E3S Web of Conferences , 06003 (2021) https://doi.org/10.1051/e3sconf/202124606003
Cold Climate HVAC & Energy 2021
Fig. 3. Renewable status map for both systems (Status based on H3,ex boundary and limit of 2.88 [22] )
One of the possible reasons for differences between this observable in practice, in-use studies have highlighted
study and others is that that the values reported in this that they are, due to a range of operational factors,
study capture the maximum performance of the unit vulnerable to seasonally aggregated under performance
(evaporator side) and it is likely that the condenser side when compared with theoretical expectations. In this
calculations for DHW could reduce useful heat study, the performance of two identical EAHPs systems
exchange performance. Aside from this, the mean in two different dwellings, was found to vary temporally
values reported may indicate overall performance, and depend on reporting boundary. Differences between
however, differences may be seen depending on external these boundaries make direct comparison difficult,
conditions. Figure 3 indicates the renewable status of however, average values suggested more work is needed
both systems using a status map, where values greater to improve the DHW performance of both units. More
than 2.88 are considered renewable [22], [23]. This research is needed on how to consistently deliver energy
figure indicates a challenge for these systems, especially performance above the renewable energy thresholds for
in the context of DHW. The Rural system demonstrates these systems. More work is also needed to determine
good performance from a heat recovery perspective, which boundaries can be universally applied when
however, for 12% of the time when the compressor is in measuring the in-use performance of these systems.
operation it does not qualify as a renewable energy Additionally, in a similar manner to the EU’s adoption
source. The Urban system performs better in this regard, of realistic in-use performance figures for vehicles [24],
where only 3% of the time that the compressor is there is possibly a need for a standardised in-use
activated the system is not providing renewable energy. measurement protocol that can be used for HP systems
However, when the renewable energy status is assessed indicating real use performance.
using the
boundary, this results in both systems not
being renewable for 84% to 99% of the hours when the The authors of this paper would like to thank the occupants of
compressor is activated. This challenge and difference each case study building for their participation. We would also
in renewable status needs further consideration in like to acknowledge the contributions of the manufacturers in
assisting with the installation of relevant equipment and for all
standard evaluation methodologies. What is also evident
phone consultations. This project was funded under the
is that systems need to be improved in order to guarantee Sustainable Energy Authority of Irelands (SEAI) RD&D fund
consistent year-round performance at a renewable level. 2018 under grant number RDD/00309)
The lack of sub-modal information for each EAHP (i.e.
DHW mode or SH mode) prohibits further insight at this
time. However, work is currently underway to obtain References
this and will lead to more robust insight into the
underlying cause of the overall underperformance with [1] EHPA, “EHPA Stats,” 2020.
http://www.stats.ehpa.org/hp_sales/story_sales/
opportunities for optimising the systems and addressing (accessed Nov. 24, 2020).
these performance challenges. [2] M. J. Limb, “An Annotated Bibliography Heat
Pumps for Ventilation Exhaust Air Heat Recovery,”
Coventry, 1996.
Conclusions [3] H. Charlick and I. Summerfield, “First year of
monitoring of exhaust air heat pumps with
Heat recovery ventilation strategies that utilise underfloor heating,” 2012. [Online]. Available:
exhaust air heat pumps to recover residual waste heat for https://www.gov.uk/government/uploads/system/upl
use in SH and/or DHW generation are attractive oads/attachment_data/file/255764/first_year_monito
solutions to the needs of low energy dwellings. While ring_report.pdf.
good intermittent performance is possible and [4] A. Mikola and T.-A. Kõiv, “The Efficiency Analysis
of the Exhaust Air Heat Pump System,”
6E3S Web of Conferences , 06003 (2021) https://doi.org/10.1051/e3sconf/202124606003
Cold Climate HVAC & Energy 2021
Engineering, vol. 06, no. 13, pp. 1037–1045, 2014, Waldmann, “Field tests of centralized and
doi: 10.4236/eng.2014.613093. decentralized ventilation units in residential
[5] A. Mikola, K. Tennokese, and T. Kõiv, “Problems buildings - Specific fan power, heat recovery
with Using the Exhaust Air Heat Pump for efficiency, shortcuts and volume flow unbalances,”
Renovation of Ventilation Systems in old Apartment Energy Build., vol. 116, pp. 373–383, 2016, doi:
Buildings,” Danish J. Eng. Apllied Sci., no. August 10.1016/j.enbuild.2015.12.008.
2015, pp. 44–55, 2015, [Online]. Available: [21] S. E. A. of I. SEAI, “DEAP Heat Pump
http://pfigshare-u- Methodology Proposed changes,” 2019.
files.s3.amazonaws.com/2212342/4445DJOEAAS.p https://www.seai.ie/publications/DEAP-Heat-
df. pumps-consultation.pdf (accessed Feb. 03, 2021).
[6] J. R. Littlewood and I. Smallwood, “One Year [22] C. P. Gleeson and R. Lowe, “Meta-analysis of
Temperature and Heat Pump Performance for a European heat pump field trial efficiencies,” Energy
Micro-Community of low Carbon Dwellings, in Build., vol. 66, pp. 637–647, 2013, doi:
Wales, UK,” Energy Procedia, vol. 111, no. 10.1016/j.enbuild.2013.07.064.
September 2016, pp. 387–396, 2017, doi: [23] P. Carroll, M. Chesser, and P. Lyons, “Air Source
10.1016/j.egypro.2017.03.200. Heat Pumps field studies: A systematic literature
[7] M. Rämä, R. Niemi, L. Similä, and L. : Julkinen, review,” Renew. Sustain. Energy Rev., vol. 134, no.
“ASIAKASRAPORTTI Poistoilmalämpöpumput August, p. 110275, 2020, doi:
kaukolämpöjärjestelmässä,” 2015. 10.1016/j.rser.2020.110275.
[8] M. Thalfeldt, J. Kurnitski, and E. Latõšov, “Exhaust [24] European Commission, “Worldwide harmonised
air heat pump connection schemes and balanced heat Light-duty vehicles Test Procedure (WLTP) and
recovery ventilation effect on district heat energy Real Driving Emissions (RDE),” 2017. https://eur-
use and return temperature,” Appl. Therm. Eng., vol. lex.europa.eu/legal-
128, pp. 402–414, 2018, doi: content/EN/TXT/HTML/?uri=LEGISSUM:4390810
10.1016/j.applthermaleng.2017.09.033. &from=EN (accessed Feb. 04, 2021).
[9] G. V. Fracastoro and M. Serraino, “Energy analyses
of buildings equipped with exhaust air heat pumps
(EAHP),” Energy Build., vol. 42, no. 8, pp. 1283– Appendices
1289, 2010, doi: 10.1016/j.enbuild.2010.02.021.
[10] NSAI, I.S. EN 13141-7:2010 Ventilation for
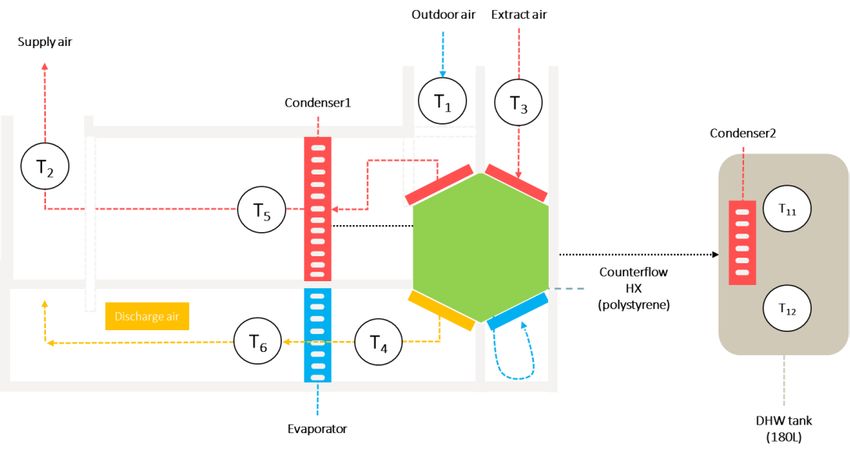
buildings - Performance testing of Appendix 1 – Airflow characteristics
components/products for residential ventilation -
Part 7: Performance testing of a mechanical supply
and exhaust ventilation units (including heat
recovery) for mechanical ventilation. 2010.
[11] ISO TC 159/SC 5, “I.S. EN 14511-3:2018 Air,” vol.
44, no. 0, p. 18, 2018, doi: 10.1520/E1515-07.2.
[12] R. Nordman et al., “SEasonal PErformance factor
and MOnitoring for heat pump systems in the
building sector SEPEMO-Build: FINAL REPORT,”
2012, [Online]. Available:
https://ec.europa.eu/energy/intelligent/projects/sites/i
ee-projects/files/projects/documents/sepemo-
build_final_report_sepemo_build_en.pdf.
[13] R. Lowe et al., “Analysis of Data From Heat Pumps
Installed Via the Renewable Heat Premium Payment
( Rhpp ) Scheme,” no. 8151, pp. 2013–2015, 2017.
[14] NSAI, I.S. EN 14511-3: Air conditioners, liquid
chilling packages and heat pumps for space heating
and cooling and process chillers, with electrically
driven compressors - Part 3: Test methods. 2018.
[15] NSAI, I.S. EN 14825: Air conditioners, liquid
chilling packages and heat pumps, with electrically
driven compressors, for space heating and cooling -
Testing and rating at part load conditions and
calculation of seasonal performance. 2018.
[16] NSAI, “I.S. EN 16147: Heat pumps with electrically
driven compressors - Testing, performance rating
and requirements for marking of domestic hot water
units,” 2017.
[17] Efergy, “Accuracy - Efergy Engage,” 2020.
https://efergysupport.zendesk.com/hc/en-
gb/articles/360001664297-Accuracy (accessed Nov.
23, 2020).
[18] Met Éireann, “Historial Data - Met Éireann,” 2020.
https://www.met.ie/climate/available-data/historical- Fig. 4. Empirical field measurement data for inlet and
data (accessed Nov. 23, 2020). exhaust airflow rates with respect to fan speed conducted in
[19] I. RStudio, “RStudio: Integrated Development for (top) Urban Ventilation system; (Bottom) Rural ventilation
R.” Boston, MA. system.
[20] A. Merzkirch, S. Maas, F. Scholzen, and D.
7You can also read