Formation of Liquid Water Pathways in PEM Fuel Cells: A 3-D Pore-Scale Perspective - IOPscience
←
→
Page content transcription
If your browser does not render page correctly, please read the page content below
Journal of The Electrochemical
Society

OPEN ACCESS

Formation of Liquid Water Pathways in PEM Fuel Cells: A 3-D Pore-
Scale Perspective
To cite this article: P. Shrestha et al 2020 J. Electrochem. Soc. 167 054516

View the article online for updates and enhancements.

                                This content was downloaded from IP address 176.9.8.24 on 16/09/2020 at 18:19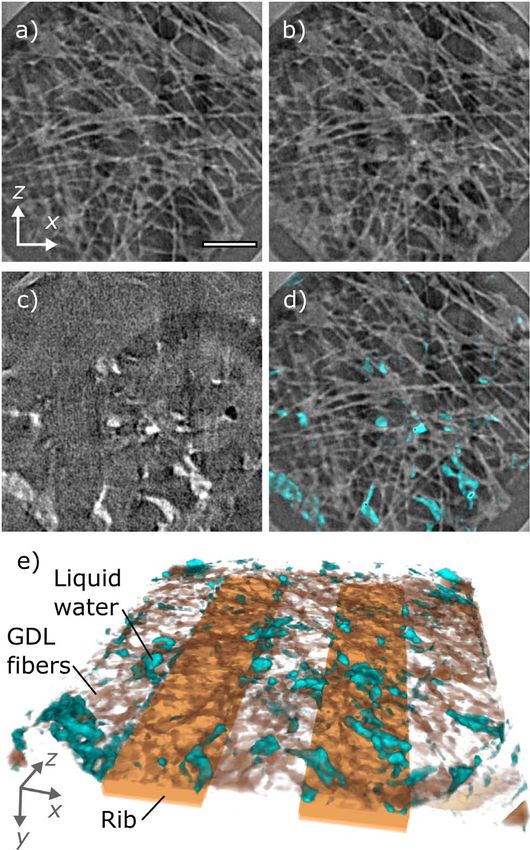
Journal of The Electrochemical Society, 2020 167 054516

                            Formation of Liquid Water Pathways in PEM Fuel Cells: A 3-D
                            Pore-Scale Perspective
                            P. Shrestha,* CH. Lee,*              K. F. Fahy,*         M. Balakrishnan,*           N. Ge,       and
                            A. Bazylak**,z
                            Thermofluids for Energy and Advanced Materials Laboratory, Department of Mechanical & Industrial Engineering, Institute
                            for Sustainable Energy, Faculty of Applied Science and Engineering, University of Toronto, Toronto, Ontario, Canada

              We investigated the 3-D pore-scale liquid water distribution within the cathode GDL via in operando synchrotron X-ray
              tomography during low current density fuel cell operation to capture the early appearance of liquid water pathways. We found that
              the invasion of liquid water into the GDL only partially filled certain GDL pores. Liquid water preferentially flowed along some
              GDL fibers, which was attributed to the hydrophilic nature of carbon fiber and the presence of pore-scale mixed wettability within
              the GDLs.
              © 2020 The Author(s). Published on behalf of The Electrochemical Society by IOP Publishing Limited. This is an open access
              article distributed under the terms of the Creative Commons Attribution 4.0 License (CC BY, http://creativecommons.org/licenses/
              by/4.0/), which permits unrestricted reuse of the work in any medium, provided the original work is properly cited. [DOI: 10.1149/
              1945-7111/ab7a0b]

              Manuscript submitted October 23, 2019; revised manuscript received February 18, 2020. Published March 6, 2020. This was Paper
              1377 presented at the Atlanta, Georgia, Meeting of the Society, October 13–17, 2019. This paper is part of the JES Focus Issue on
              Heterogeneous Functional Materials for Energy Conversion and Storage.

    Growing energy use necessitates the adoption of renewable                     empirically-determined heterogeneous porosity profile of GDLs on
energy sources and sustainable energy conversion devices with                     liquid water saturation and found that smooth porosity distributions
low carbon emissions to mitigate anthropogenic climate change.1                   and a low porosity at the catalyst layer-GDL interface were effective
Polymer electrolyte membrane (PEM) fuel cells offer a robust                      in reducing the overall GDL saturation.
solution for on-site energy conversion and utilization without local                  To further understand liquid water transport, the effect of mixed
carbon emissions.2 However, the high cost of the PEM fuel cell has                wettability in the complex GDL structure has gained recent
bottlenecked its adoption. Innovative water management strategies                 attention.12–15 L. Hao et al.12 used the lattice Boltzmann method to
aimed at the cathode gas diffusion layer (GDL) have the potential to              demonstrate that liquid water transport exhibited capillary fingering
drastically improve high current density performance of the fuel cell             and stable displacement regimes in GDLs with high hydrophobicity
and thereby reduce costs.2 Understanding liquid water transport                   and neutral wettability, respectively. They also showed that hydro-
within the GDL is crucial for driving this much-needed innovation                 philic regions in the GDL could be tailored to create preferential
and design. At the pore-scale, most commercial GDLs exhibit a                     liquid water pathways that remain stable once liquid water break-
complex heterogeneous structure with mixed wettability due to the                 through was achieved. R. Wu et al.13 incorporated mixed wettability
non-uniform dispersion3,4 of a hydrophobic binder, typically poly-                in pore network modeling to find that a non-uniform distribution of
tetrafluoroethylene (PTFE), on the hydrophilic carbon fibers of the                 hydrophilic pore fractions (higher hydrophilic fraction near catalyst
GDL. The hydrophobic binder is commonly applied via a dip-                        layer) led to a lower liquid water saturation. S. M. Moosavi et al.14
coating procedure which results in a heterogeneous coverage of the                performed pore-scale simulations on experimentally-characterized
binder, where the binder may distribute partially on the fibers,                   partially saturated GDLs and showed that hydrophobic treatments
deposit as a thin layer along fibers, or preferentially accumulate near            on GDLs led to significant improvements in water permeability
the GDL surfaces.3 To implement successful water management                       without impacts on the effective diffusivity of air. Although there
strategies, we need to understand the effect of the complex                       has been considerable work on the topic of mixed wettability, the
heterogeneous nature of the GDL on the pore-scale transport of                    precise nature of how the initial liquid water pathways form in GDLs
liquid water.                                                                     is not yet known. Initial pathways become established as preferential
    Recent advances in pore-scale modeling5–7 and visualization8–11               pathways for liquid water transport, even with increased water
have shed light on certain water transport mechanisms existing in the             generation rates, and hence play an important role in predicting the
complex heterogeneous pore structure of the GDLs. Y. Nagai et al.8                overall liquid water distribution within the GDL.
used in operando synchrotron X-ray computed tomography to                             In this study, we investigate the three-dimensional (3-D) pore-
demonstrate that primary liquid water pathways, which were                        scale liquid water distribution within the cathode GDL in operando
established in the large micrometer-sized pores of their custom                   via synchrotron X-ray tomography during low current density fuel
microporous layer (MPL), promoted the efficient removal of liquid                  cell operation. The goal of the study was to capture the early
water by limiting the number of entry pathways in the GDL                         appearance of liquid water pathways to enhance our understanding
substrate. S. J. Normile et al.9 showed that large voids (∼10 μm)                 of how liquid water pathways form within GDLs and how the
at the catalyst layer-MPL interface served as locations for liquid                pathways are affected by the mixed wettability of the GDL structure.
water pooling or membrane swelling. S. Alrwashdeh et al.10 mapped
the water distribution in the nanometer-sized MPL pores using                                                   Experimental
synchrotron X-ray phase contrast tomography to elucidate that liquid
                                                                                     Here, we describe the experimental setup used for in operando
water in the MPL preferentially accumulated under the flow-field
                                                                                  fuel cell tomography. Fuel cell electrochemical performance was
ribs rather than under the channels. J. Gostick et al.6 simulated pore-
                                                                                  characterized while acquiring X-ray tomographic projections of the
scale liquid water transport using pore network modeling and
                                                                                  fuel cell. We then describe the image processing and visualization
calculated transport properties of gas and water in GDLs with
                                                                                  procedures used to convert the tomographic projections into spatially
varying saturations. J. Hinebaugh et al.7 studied the effect of
                                                                                  resolved 3-D liquid water distributions.

  *Electrochemical Society Student Member.
                                                                                     In operando fuel cell tomography setup.— Fuel cell test setup.—
 **Electrochemical Society Member.                                                A custom miniature fuel cell was designed and built for electro-
  z
    E-mail: abazylak@mie.utoronto.ca                                              chemical testing and in operando X-ray computed tomography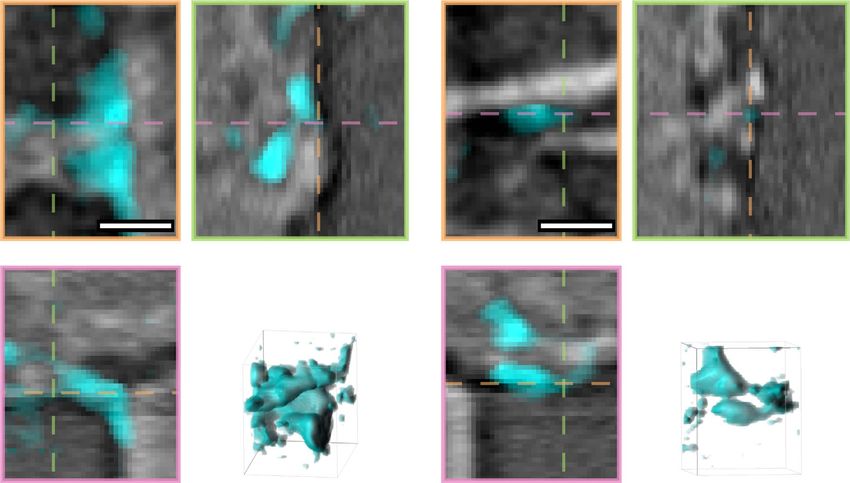
Journal of The Electrochemical Society, 2020 167 054516
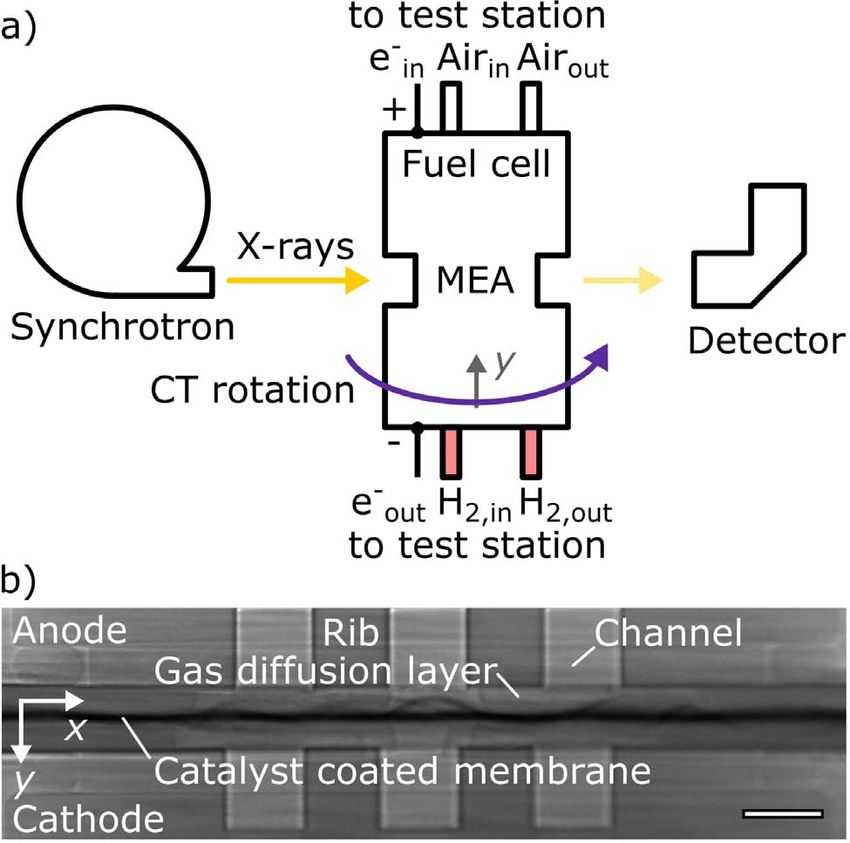
(setup shown in Fig. 1). The 5-layer membrane electrode assembly
(MEA), with a circular active area of 0.071 cm2, consisted of a Pt/C-
catalyst-coated Nafion® HP membrane (0.3 mgPt cm−2 on each side,
Ion Power) placed between Sigracet SGL 25 BC (Sigracet® GmbH)
gas diffusion layers (GDLs). The GDLs (0.3 cm in diameter) were
compressed to 75% of their original thickness using rigid poly-
ethylene naphthalate (PEN) gaskets. The MEA was compressed
between two graphite flow-fields (assembly seen in Fig. 1b), which
consisted of three parallel channels that were 0.5 mm in width and
depth, separated by 0.5 mm-wide ribs. The flow-field plates were
placed between two hard gold-coated copper current collectors (out
of field-of-view in Fig. 1b), which conducted electric current
between the flow-fields and the external circuit.
Electrochemical testing was conducted using a fuel cell test stand
(Scribner 850e, Scribner Associates Inc.) coupled with a potentiostat
(885 Fuel Cell Potentiostat, Scribner Associates Inc.). The fuel cell
was operated at ambient temperature (21 °C) and pressure at two
operating current conditions: a) reference open circuit voltage
(0 A cm−2) and b) low current density step of 0.05 A cm−2. The
low current density step was chosen to specifically study the early
appearance of liquid water pathways formed in the GDL. Hydrogen
and air were fully humidified and supplied to the anode and cathode
channels, respectively, in a counter-flow configuration. High reactant
flow rates of 0.375 l min−1 were maintained to avoid liquid water
flooding at the channels and maintain high stoichiometry (>5000)
along channel lengths.
X-ray tomography setup.—The operating fuel cell was imaged
using synchrotron X-ray tomography at the Biomedical Imaging and
Therapy Wiggler Insertion Device (05ID-2) beamline facility at the
Canadian Light Source (CLS) in Saskatoon, Canada.16 The fuel cell
was oriented with the MEA plane horizontal and parallel to the
incoming X-ray beam. The X-ray beam was collimated and
monochromatic with an energy level of 30 keV. A total of 1500
two-dimensional (2-D) projections were captured at 0.12° rotation
increments (total rotation angle of 180°). 2-D images of the incident
beam, i.e., flat-field projections, were captured at the beginning and
Figure 2. A sample 2-D cross-sectional image slice at the cathode GDL
shown at different points in time and under different conditions to highlight
image processing procedure after 3-D reconstruction: (a) OCV reference
image, (b) in-operando test image aligned with OCV image using the
imregister function MATLAB, (c) subtracted image showing liquid water,
and (d) overlaid image of OCV reference image (greyscale) and liquid water
(cyan) obtained by filtering and segmenting subtracted image (c). White
scale bar in (a) represents a length of 0.5 mm. (e) 3-D visualization
(perspective view) of liquid water distribution (cyan) overlaid onto con-
trast-enhanced GDL fibers (translucent brown) and flow-field ribs (orange).
the end of each tomography scan. Each projection image was
captured with an exposure time of 300 ms, a pixel resolution of
6.5 μm per pixel (as used successfully by L. Battrell et al. to identify
GDL pore space17), and a field-of-view of 13.3 mm (width) by
1.5 mm (height). Individual GDL fiber diameters range between 1–2
pixels (mean fiber diameter of ∼7.6 μm18); however, binder and
PTFE were not distinguished from the fibers in this scan, hence
bundled fibers or fibers coated with binder/PTFE could appear larger
than 1–2 pixels wide. A 100 μm thick LuAG scintillator (CRYTUR
spol. s r. o.) converted the transmitted X-ray irradiance into visible
light which was detected by a digital scientific complementary
metal-oxide-semiconductor (sCMOS) camera (ORCA-Flash4.0,
Hamamatsu Photonics K.K.). For each current density step, tomo-
graphic imaging was conducted for 15 min at steady state after a
Figure 1. (a) Schematic of custom fuel cell test setup with in operando 10-minute stabilization period which was sufficient to stabilize water
X-ray computed tomography. (b) Sample 2-D projection image obtained with distributions within the GDL.19 We used a step-and-shoot CT
the fuel cell maintained at open circuit voltage, showing main components of imaging protocol, in contrast to higher temporal resolution on-the-
graphite flow-field (ribs and channels) and membrane electrode assembly fly CT imaging,17 and a monochromatic beam to obtain high fidelity
(MEA). White scale bar represents a length of 0.5 mm. images of the stabilized water distributions.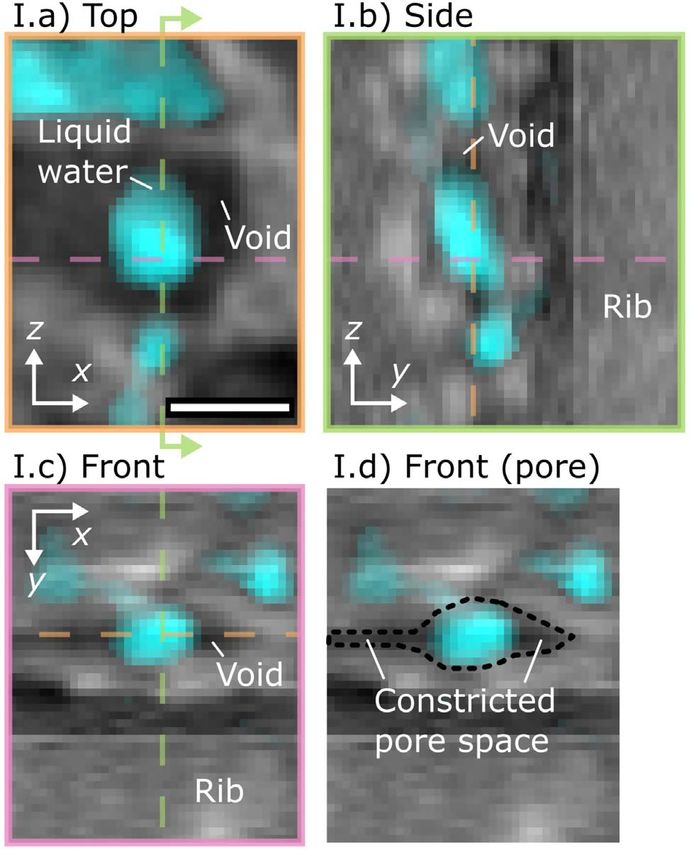
Journal of The Electrochemical Society, 2020 167 054516

    Image processing and liquid water visualization.—The 2-D
tomographic projection images were processed to obtain 3-D liquid
water and material density distributions. A dark-field image (an
average of 10 images taken in the absence of the incident X-ray
beam) was subtracted from each projection image to correct for the
background noise of the camera. Each projection image was
corrected for the non-uniform response of the camera, scintillator
screen, and incident X-ray beam20 using an averaged flat-field image
(an average of 20 flat-field projections taken before and after
tomographic projections). The corrected projection images were
reconstructed into 3-D images using the filtered back-projection
algorithm available in the NRecon software (Bruker Corporation).21
    A sample cross-sectional slice of the cathode GDL during
operation at OCV and later during the 0.05 A cm−2 step is shown in
Figs. 2a and 2b, respectively. The pixel intensities of the image
slices represent material density, where darker intensities (black)
indicate lower material density (e.g., void space) while brighter
intensities (grey) represent solid material (e.g., carbon fiber) and/or
liquid water. The 3-D images of the fuel cell during OCV and the
0.05 A cm−2 step were registered for any unwanted translation and
rotation using the imregister function in MATLAB (MathWorks).22
The 3-D image taken at OCV was subtracted from the aligned image
taken during the 0.05 A cm−2 step to obtain the liquid water
distribution during fuel cell operation (Fig. 2c). The 3-D OCV
image represents a dry reference state image where the GDL is
devoid of liquid water. The subtracted water distribution image was
filtered using a 3-D median filter (width of 2 pixels in each direction)
to reduce noise, contrast-enhanced, and segmented into water and
background using Otsu’s automatic threshold.23 Unphysical pixel-
wide holes created in the water distribution during the segmentation
                                                                                         Figure 4. Partially filled pore from Fig. 3a (water cluster I) represented as
process were filled in using the Fill Holes function in Fiji. The                         cross-sectional orthogonal (a) top, (b) side, and (c) front views. Red dashed
resulting 3-D liquid water distribution was overlaid onto the 3-D                        lines indicate locations of planes corresponding to each orthogonal view. (d)
reference OCV image to visualize liquid water with respect to the                        Front view with pore space outlined for clarity. Constricted regions of the
GDL materials and pores (Fig. 2d). Two software, namely Dragonfly                         pore shown in (b), (c), and (d) are unfavorable for water transport. Capillary
(Object Research Systems)24 and Fiji,25 were used to visualize the                       barrier imposed by narrow constrictions in the 3-D morphology of the pore
liquid water distribution in 3-D (Fig. 2e).                                              space results in this partially filled pore. White scale bar in (a) represents a
                                                                                         length of 0.1 mm.

                                                                                                                  Results and Discussion
                                                                                             3-D liquid water pathways were visualized within the fuel cell at
                                                                                         a current density of 0.05 A cm−2 (cell potential of 0.43 V; low cell
                                                                                         performance was attributed to a high ohmic resistance of 1.3 Ω cm2
                                                                                         at 0.05 A cm−2, low OCV of 0.81 V, and high kinetic losses at room
                                                                                         temperature). In this study, we report and focus on two specific pore-
                                                                                         scale phenomena observed within the fuel cell: partial filling of GDL
                                                                                         pores and preferential flow of liquid water along GDL fibers and
                                                                                         channel boundaries. We then present a discussion of some experi-
                                                                                         mental insights into predicting the formation of liquid water path-
                                                                                         ways within GDLs.

                                                                                             Partial filling of GDL pores.—We observed that the invasion of
                                                                                         liquid water into the GDL only partially filled certain GDL pores.
                                                                                         Representative examples are shown in Fig. 3. In the example slice
                                                                                         shown in Fig. 3d, the area fraction of invaded pores covered by
                                                                                         liquid water was only 85% rather than 100% (fully filled). To better
                                                                                         understand the mechanisms for partial filling of GDL pores, we
                                                                                         investigate the 3-D distribution of water using cross-sectional
                                                                                         orthogonal views. We report two possible explanations for the
                                                                                         observed partial filling of pores: a) capillary barrier imposed by
                                                                                         narrow constrictions in pore morphology, and b) preferential flow of
                                                                                         liquid water along GDL fibers and channel boundaries.
                                                                                             It is important to consider the 3-D pore morphology when
Figure 3. Representative examples of partially filled GDL pores shown in                  examining pore-scale liquid water transport. The shape and size of
2-D images (enlarged) of liquid water (cyan) overlaid onto dry GDL fibers                 the pore space (pore/throat diameter and connectivity) and the
and pores represented as greyscale reconstruction. Liquid water clusters of              roughness of the pore walls can have significant effects on water
interest are labelled as (a) I, (b) II, (c) III, and (d) IV in red. White scale bar in   transport.26,27 Here, we report an effect of the 3-D shape and size of
(a) represents a length of 0.1 mm.                                                       the pore space on water transport. In the representative example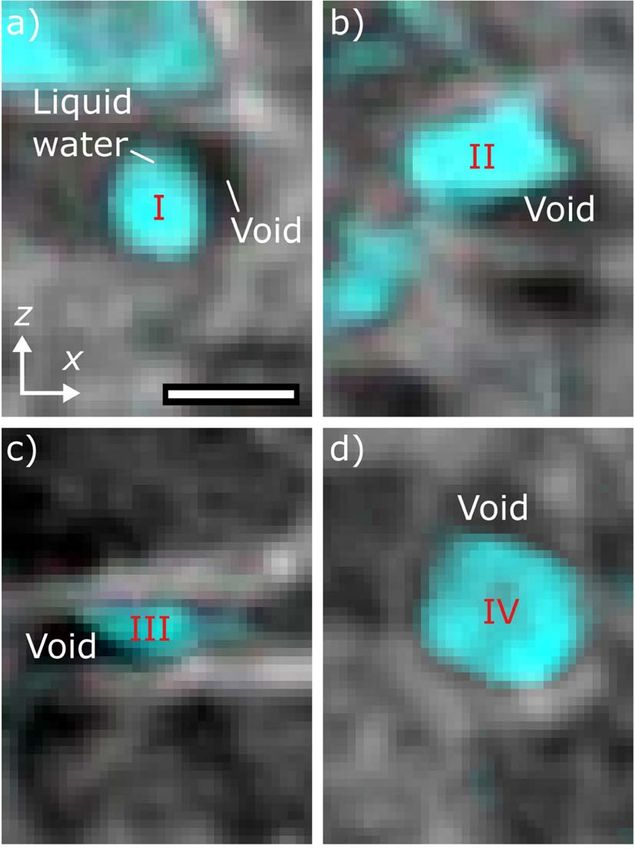
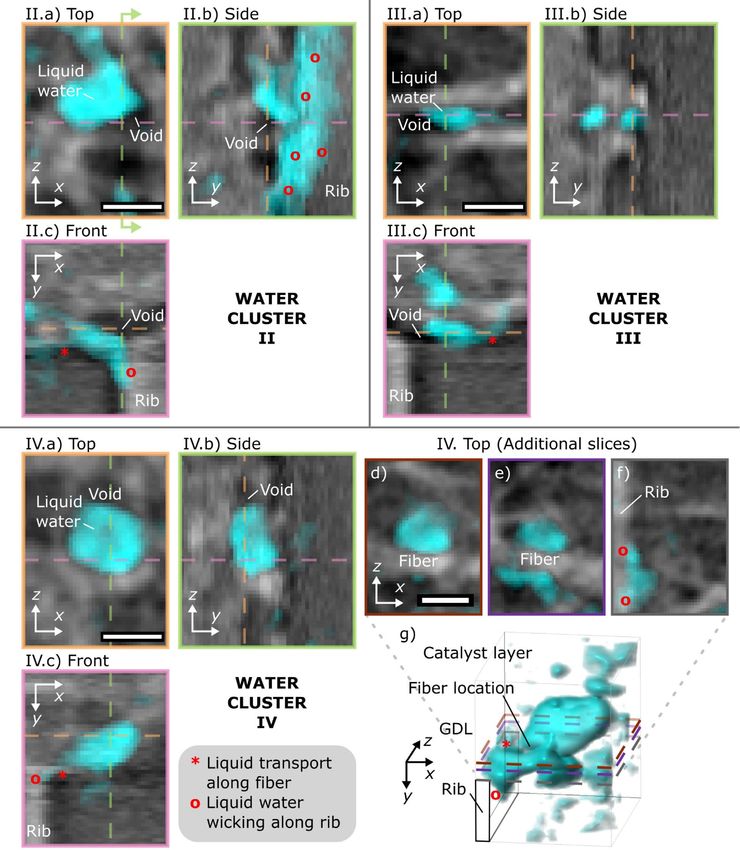
Journal of The Electrochemical Society, 2020 167 054516

Figure 5. Preferential flow of water along GDL fibers (indicated by red *) and channel boundaries (indicated by red °) shown in 2-D overlaid images (enlarged)
of liquid water (cyan) and dry GDL fibers and pores (greyscale) in cross-sectional orthogonal (a) top, (b) side, and (c) front views. Labels II, III, and IV
correspond to water clusters shown in Figs. 3(d)–(f). Additional top views of water cluster IV. (g) 3-D isometric view of liquid water cluster IV (cyan), with
fibers removed for clarity. Locations of catalyst layer, GDL, and flow-field rib are indicated. The cross-section slices corresponding to the 2-D images in (d)–(f)
are taken in locations indicated by dashed lines in (g). II.(c), III.(c), IV.(c), and (g) show preferential liquid water flow around fiber, while II.(b), II.(c), IV.(c), (f),
and (g) show liquid water wicking along flow-field rib. White scale bars represent a length of 0.1 mm.

shown (Fig. 4), the top view shows a partially filled pore space                          consequently lead to a partially filled pore (Fig. 4a). This pore
(Fig. 4a). The side and front views (Figs. 4b and 4c, respectively)                      filling phenomena has also been discussed in the literature through
show that the unfilled void space constricts and narrows towards the                      numerical28,29 and experimental30 studies of multiphase flow
edges (outlined for clarity in Fig. 4d). The narrower regions in the                     through porous media.
apparently hydrophobic pore space would exhibit higher threshold
capillary pressures and be unfavorable for liquid water transport                           Preferential flow of liquid water along GDL fibers and channel
compared to the wider (water-filled region) in the pore, and                              boundaries.—Liquid water was observed to preferentially flow
Journal of The Electrochemical Society, 2020 167 054516

Figure 6. Additional cross-sectional orthogonal (a) top, (b) side, and (c) front views and (d) 3-D isometric view of the preferential water pathways along GDL
fibers (indicated by red *). The 2-D overlaid images (enlarged) show liquid water (cyan) and dry GDL fibers and pores (greyscale). Labels II and III correspond
to water clusters shown in Fig. 3. White scale bars represent a length of 0.1 mm.

along some GDL fibers and channel boundaries (Fig. 5). In certain                  wettability of the pore (as seen in Fig. 5). The 3-D morphology of
locations, water preferentially flowed and surrounded GDL fibers                    the pore space can be accurately modelled when the physical pore
(shown using red * in Fig. 5). This preferential flow of liquid water              space is extracted and segmented into a collection of individual
along GDL fibers is highlighted for the respective regions of interest             pores/throats, as done in state-of-the-art pore-scale simulations of
using cross-sectional orthogonal slices (water clusters II and III in             the GDLs.5,26 However, to accurately predict and model the effects
Fig. 6 and cluster IV in Figs. 5d–5f) and 3-D isometric views (water              of heterogeneous mixed wettability on the formation of liquid water
clusters II and III in Fig. 6d and cluster IV in Fig. 5g). This                   pathways in GDLs, we recommend to accurately characterize and
observation was attributed to the hydrophilic nature of the consti-               incorporate the actual 3-D distribution of heterogeneous wettability
tuent carbon fiber (contact angle of ∼80° for plain single fiber31) and             within the GDL, as also suggested by M. Sabharwal et al.34
the presence of mixed wettability within the GDLs. Most commer-
cial GDLs, including SGL 25 BC (used in this study), consist of                                                 Conclusions
hydrophilic carbon fibers that are hydrophobized with a non-uniform
                                                                                      We visualized initial liquid water pathways in the cathode GDL
dispersion3,4 of PTFE binder (contact angle of 110°32), where PTFE
                                                                                  pores in operando. We found that certain GDL pores invaded by
may cover the fiber partially, as a thin layer, or preferentially near
                                                                                  liquid water were partially, rather than completely, filled. Partial pore
the surface.3 In addition, liquid water was observed to wick along
                                                                                  filling was attributed to the presence of complex 3-D pore mor-
channel boundaries (shown using red ° in Fig. 5), owing to the
                                                                                  phology and heterogeneous mixed wettability within the GDL. Liquid
hydrophilic nature of constituent graphite plates. Due to the mixed
                                                                                  water was observed to preferentially flow along some GDL fibers and
wettability in the GDL, a mixed drainage-imbibition process may
                                                                                  channel boundaries, which was attributed to the hydrophilic nature of
occur in the GDL, where liquid water preferentially flows along
                                                                                  the carbon fiber/graphite flow-field and the presence of pore-scale
hydrophilic carbon fibers and graphite flow-field boundaries rather
                                                                                  mixed wettability within the GDLs. Our results demonstrate the
than hydrophobic PTFE. This mixed drainage-imbibition process
                                                                                  significance of mixed wettability at the pore-scale for the formation of
may lead to the partial filling of GDL pores (as seen in Figs. 3
                                                                                  initial liquid water pathways in the GDL. The phenomena of mixed
and 5).
                                                                                  drainage-imbibition due to mixed wettability should be incorporated
                                                                                  and leveraged in GDL modeling and design in order to tailor liquid
    On predicting the formation of liquid water pathways: discus-
                                                                                  water transport pathways in next-generation GDLs.
sion of experimental insights.—Assuming capillary-dominated
liquid water transport (negligible temperature gradient at low current
                                                                                                            Acknowledgments
density and negligible vapor transport at low temperature fuel cell
operation33), liquid water is transported from the catalyst layer to the             Financial support from the Natural Sciences and Engineering
flow-field by sequentially filling one pore to the next based on the                 Research Council of Canada (NSERC), the Canada Research Chairs
threshold capillary pressure of the smallest constriction between                 Program, and the Canada Foundation for Innovation are gratefully
the pores (i.e., throat). Threshold capillary pressure is affected by a)          acknowledged. Graduate scholarships to Pranay Shrestha from the
the morphology of the pore space, which determines the distribution               Vanier Canada Graduate Scholarship, the Hatch Graduate Scholarship
of individual pore/throat diameters and connectivity of pores in the              for Sustainable Energy Research, the Pitt Charles Bertram Award,
path of liquid water transport (as seen in Fig. 4) and b) the local               the Ontario Graduate Scholarship, and the David Sanborn Scott
Journal of The Electrochemical Society, 2020 167 054516
Fellowship are gratefully acknowledged. Graduate scholarships to 5. P. A. García-Salaberri, I. V. Zenyuk, G. Hwang, M. Vera, A. Z. Weber, and J.
ChungHyuk Lee from the Bert Wasmund Graduate Fellowship in T. Gostick, Electrochim. Acta, 295, 861 (2019).
6. J. T. Gostick, M. A. Ioannidis, M. W. Fowler, and M. D. Pritzker, J. Power Sources,
Sustainable Energy Research, Hatch Graduate Fellowship for 173, 277 (2007).
Sustainable Energy Research, David Sanborn Scott Graduate 7. J. Hinebaugh, Z. Fishman, and A. Bazylak, J. Electrochem. Soc., 157, B1651
Fellowship, and the Ontario Graduate Scholarship are gratefully (2010).
acknowledged. Graduate scholarships to Manojkumar Balakrishnan 8. Y. Nagai, J. Eller, T. Hatanaka, S. Yamaguchi, S. Kato, A. Kato, F. Marone, H. Xu,
and F. N. Büchi, J. Power Sources, 435, 226809 (2019).
from the C. W. Bowman Graduate Scholarship and the Ontario 9. S. J. Normile, D. C. Sabarirajan, O. Calzada, V. De Andrade, X. Xiao, P. Mandal,
Graduate Scholarship are gratefully acknowledged. Graduate scholar- D. Y. Parkinson, A. Serov, P. Atanassov, and I. V. Zenyuk, Meter. Today Energy, 9,
ships to Nan Ge from the Friends of Ara Mooradian Scholarship, the 187 (2018).
Ron D. Venter Fellowship, the Ontario Graduate Scholarship, and 10. S. S. Alrwashdeh, I. Manke, H. Markötter, M. Klages, M. Göbel, J. Haußmann,
J. Scholta, and J. Banhart, ACS Nano, 11, 5944 (2017).
Hatch Graduate Scholarship for Sustainable Energy Research are 11. J. M. LaManna, Y. Yue, T. A. Trabold, J. D. Fairweather, D. S. Hussey, E. Baltic,
gratefully acknowledged. Research described in this paper was and D. L. Jacobson, Meet. Abstr. - Electrochem. Soc., 32, 1428 (2017).
performed at the BMIT facility at the Canadian Light Source, which 12. L. Hao and P. Cheng, J. Power Sources, 195, 3870 (2010).
is supported by the Canada Foundation for Innovation, Natural 13. R. Wu, Q. Liao, X. Zhu, and H. Wang, Int. J. Heat Mass Transfer, 55, 2581
(2012).
Sciences and Engineering Research Council of Canada, the 14. S. M. Moosavi, M. Niffeler, J. Gostick, and S. Haussener, Chem. Eng. Sci., 176, 503
University of Saskatchewan, the Government of Saskatchewan, (2018).
Western Economic Diversification Canada, the National Research 15. J. Zhou, A. Putz, and M. Secanell, J. Electrochem. Soc., 164, F530 (2017).
Council Canada, and the Canadian Institutes of Health Research. 16. T. W. Wysokinski, D. Chapman, G. Adams, M. Renier, P. Suortti, and
W. Thomlinson, Nucl. Instrum. Methods Phys. Res., Sect. A, 582, 73 (2007).
Authors acknowledge the receipt of support from the CLS Post- 17. L. Battrell, N. Zhu, L. Zhang, and R. Anderson, Int. J. Hydrogen Energy, 43, 11234
Doctoral and Graduate Student Travel Support Program. The authors (2018).
would like to acknowledge Denise Miller, Adam Webb, Ning Zhu, 18. J. Hinebaugh and A. Bazylak, Int. J. Hydrogen Energy, 42, 15861 (2017).
Sergey Gasilov, and the BMIT group of the Canadian Light Source 19. R. Banerjee, N. Ge, J. Lee, M. G. George, S. Chevalier, H. Liu, P. Shrestha,
D. Muirhead, and A. Bazylak, J. Electrochem. Soc., 164, F154 (2017).
Inc. for their generous assistance. The SGL Group is also recognized 20. J. Banhart, Advanced Tomographic Methods in Materials Research and
for donation of the gas diffusion layers used in this study. Engineering (Oxford University Press, Oxford) (2008).
21. N. V. Skyscan, “NRecon user manual.” Kontich, Belgium: Bruker microCT (2011).
22. D. Muthukumaran and M. Sivakumar, Int. J. Comput. Eng. Inf. Technol., 2, 29
ORCID (2017).
23. N. Otsu, IEEE Trans. Syst. Man Cybern., SMC-9, 62 (1979).
P. Shrestha https://orcid.org/0000-0002-9881-1973 24. Dragonfly 4.0 [Computer software]. Object Research Systems (ORS) Inc, Montreal,
CH. Lee https://orcid.org/0000-0002-8428-1502 Canada (2019), http://www.theobjects.com/dragonfly.
K. F. Fahy https://orcid.org/0000-0003-2866-9147 25. J. Schindelin et al., Nat. Methods, 9, 676 (2012).
M. Balakrishnan https://orcid.org/0000-0001-7456-8289 26. J. T. Gostick, Phys. Rev. E, 96, 023307 (2017).
27. H. Liu, J. Hinebaugh, S. Chevalier, R. Banerjee, C. Lee, and A. Bazylak, Transp.
N. Ge https://orcid.org/0000-0002-5837-0448 Porous Media, 121, 437 (2018).
A. Bazylak https://orcid.org/0000-0002-9594-4930 28. B. K. Primkulov, S. Talman, K. Khaleghi, A. R. Shokri, R. Chalaturnyk, B. Zhao,
C. W. MacMinn, and R. Juanes, Phys. Rev. Fluids, 3, 104001 (2018).
References 29. B. Zhao et al., Proc. Natl. Acad. Sci. U.S.A., 116, 13799 (2019).
30. B. Zhao, C. W. MacMinn, and R. Juanes, Proc. Natl. Acad. Sci. U.S.A., 113, 10251
1. Intergovernmental Panel on Climate Change, Climate Change 2014: Mitigation of (2016).
Climate Change (Cambridge University Press, New York, NY) (2015). 31. D. L. Wood III, C. Rulison, and R. L. Borup, J. Electrochem. Soc., 157, B195
2. “United States Driving Research and innovation for vehicle efficiency and energy (2010).
sustainability partnership.” Fuel Cell Technical Team Roadmap, p. 1 (2017). 32. S. Goswami, S. Klaus, and J. Benziger, Langmuir, 24, 8627 (2008).
3. H. Sadeghifar, N. Djilali, and M. Bahrami, J. Power Sources, 248, 632 (2014). 33. N. Ge et al., Int. J. Heat Mass Transfer, 107, 418 (2017).
4. A. Rofaiel, J. S. Ellis, P. R. Challa, and A. Bazylak, J. Power Sources, 201, 219 34. M. Sabharwal, J. T. Gostick, and M. Secanell, J. Electrochem. Soc., 165, F553
(2012). (2018).You can also read