Social Indicators and Trends 2014 - Goal: A Good Start - City of Vancouver
←
→
Page content transcription
If your browser does not render page correctly, please read the page content below
Social Indicators and Trends 2014
Goal: A Good Start
Vancouver’s children have the best chance of enjoying a healthy childhood.
Healthy City for All Target
By 2025: at least 85 per cent of Vancouver’s children are developmentally ready for school when they
enter kindergarten.
Indicators in this Fact Sheet Key Findings
Vancouver’s Child Population Vancouver has the lowest proportion of
Aboriginal Children children aged 0-12 of any large city in Canada.
Children’s Health Outcomes More than a third of kindergarten students in
School Readiness Vancouver are considered not ready for school.
Children in Low Income Families Metro Vancouver has the second highest rate
Licensed childcare Supply of children in low income families among
major urban regions in Canada.
Why it Matters
A good start in life is critical for our long term health and well-being. Our living conditions and experiences
as children affect not only our healthy development in childhood but our health throughout life. A growing
body of research and evidence points to just how critical our first six years, from conception to school entry,
are. They are characterised by rapid brain development that is affected by a wide range of experiences
from our interactions with people to our interactions with the physical environment.
Our physical, social, mental, emotional and spiritual development as children is affected by the presence or
absence of loving and secure attachments, the safety and security of our housing and neighbourhoods, the
level of our parent’s education and family income, access to clean air, clean water, nutritious food, quality
child care, culture and recreation, and health care services.
Children who have a good start in life do better at school, secure better paid jobs, and enjoy better physical
and mental health as adults. Conversely, children who do not experience a good start are at greater risk of
doing poorly at school, enjoy fewer economic opportunities as adults, are more likely to be involved in
criminal activities and problematic substance use, and have poorer physical and mental health throughout
their lives.
The early years are therefore a time when investment can have a profound and long-lasting impact on the
health and well-being of individuals and communities. While quality care and learning opportunities are
critical to any child having a good start, they can also mitigate some of the more negative impacts of a bad
start—children in highly vulnerable environments can benefit greatly from additional care and support.
Investment in quality care and learning is not only investment in children; it is also an investment in the
economic, social and environmental sustainability of the whole city.
City of Vancouver, Social Policy and Projects
vancouver.ca/healthycity4all
Last revised April 14, 2015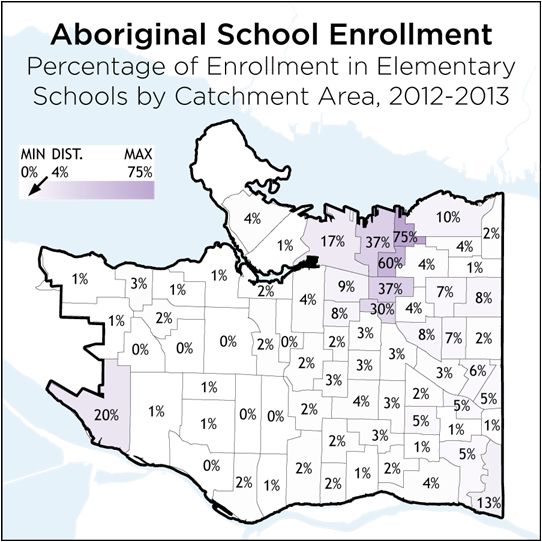
Social Indicators and Trends 2014: A Good Start
About This Fact Sheet
This series reports on social indicators and trends related to the 12 long-term goals of the City of
Vancouver’s Healthy City Strategy. More information on the Strategy is available online at
vancouver.ca/healthycity4all. A Good Start explores indicators of the health and well-being of Vancouver’s
children, providing information on a number of measures relating to the long-term goal of ensuring that
more of Vancouver’s children are ready for school.
Social research is always imprecise and uncertain. Collaboration, replication and information sharing are
crucial to building a more complete and rigorous picture of health and well-being in Vancouver. Readers are
encouraged to provide feedback, ask questions and to engage in exploring and interpreting the information
presented here.
Areas of Study
Information in this fact sheet is presented for a number of different geographies. Comparisons between
Vancouver and other cities refer to individual local governments, as defined by Statistics Canada’s census
subdivisions. Comparisons between Metro Vancouver and other regions refer to census metropolitan areas.
Within the City of Vancouver, this fact sheet provides information organized in three ways. Two of these,
local planning areas (neighbourhoods) and local health areas, are illustrated below:
Readers should note that the Dunbar-Southlands local area includes the Musqueam First Nation near the
Fraser River, but it is excluded from citywide figures unless otherwise noted. Note also that
neighbourhood-level data collected through the Early Development Instrument (EDI) combines some
neighbourhoods: Arbutus-Ridge and Shaugnessy are reported together, as are South Cambie and Riley Park.
The six local health areas that make up the Vancouver Health Service Delivery Area include the City of
Vancouver, the Musqueam First Nation and the University of British Columbia endowment lands.
One indicator in this fact sheet is reported using elementary school catchment areas.
Engaging with Data Sources
Sources used are noted in each section of this fact sheet. Key online resources include:
Information from Statistics Canada’s Census of Population and National Household Survey is available
online at statcan.gc.ca. Custom neighbourhood profiles ordered by the City of Vancouver are
available at data.vancouver.ca.
BC Statistics population projections and socio-economic profiles are available at bcstats.gov.bc.ca.
Early Development Instrument statistics are available from earlylearning.ubc.ca/edi.
Page 2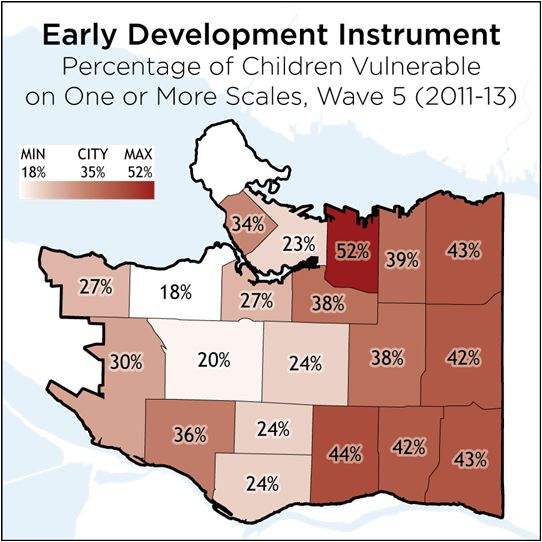
Social Indicators and Trends 2014: A Good Start
Indicator: Vancouver’s Child Population
Vancouver has relatively fewer children than other cities. As of 2011, 10 per cent of the City of
Vancouver’s population was aged 12 or under. Vancouver had the lowest proportion of children 0-12 of any
Canadian municipality with a population of more than 100,000.
While this statistic warrants attention, it needs to be remembered that this is also related to the unique
structure of the Metro Vancouver region: the City of Vancouver contained only 26 per cent of the region’s
population in 2011 and had a higher concentration of multi-family housing than other cities.

                               Children 0-12                                                            Children 0-12
                  Percentage of Total Population in                                          Percentage of Total Population,
                   Canada's 15 Largest Cities, 2011                                              2001-2011 Census Data
    20%                                                                        20%
                                               19%

    15%                                                                        15%
                                                                      16%
                      16%

                     15%

                                                                   15%
                    15%
                    14%

                    14%

                                                     14%

                                                                  14%
                  13%
                  13%

                                                                 13%

    10%                                                                        10%
                                                           11%
                                         10%

     5%                                                                        5%

                                                                               0%
     0%
                                                                                 2001                              2006                    2011
                    Montréal

                    Hamilton
                      Québec
                      Calgary
                      Ottawa

                  Vancouver
                   Brampton

                      Halifax
                      London
                     Toronto

                        Laval
                  Mississauga
                    Winnipeg

                       Surrey
                   Edmonton

                                                                                                  Canada                      BC
                                                                                                  Metro Vancouver             City of Vancouver

Children as a percentage of Vancouver’s population have declined over time. This is largely due to an
aging population: in Vancouver, the absolute number of children has been steady, though the most recent
census period from 2006 to 2011 has shown a small decline. On average, censuses since 1986 have shown a
three per cent increase in children aged 0-12 in Vancouver, compared to a seven per cent increase in the
overall population. Note, though, that the number of Aboriginal children has grown at a faster rate.

                        Population Growth                                                         Population Projections
                  City of Vancouver Population and                                          Projected Vancouver Population
                   Children 0-14, 1986-2011 Census                                            and Children 0-14, 2011-2041
                  800                                                                       800
      Thousands

                                                                                Thousands

                  700                                                                       700
                  600                                                                       600
                  500                                                                       500
                  400                                                                       400
                  300                                                                       300
                  200                                                                       200
                  100                                                                       100
                    0                                                                         0
                        1986    1991    1996     2001            2006   2011                   2011   2016   2021    2026    2031   2036   2041

                        Children 0-14            Total Population                                  Children 0-14            Total Population

Provincial population projections show a similar overall picture. Vancouver’s general population will increase
steadily but the number of children will fluctuate slowly, making up a decreasing proportion of Vancouver’s
total population. Note, though, that there are many variables and trends that may impact the validity of
this projection.
                                                                                                                                                  Page 3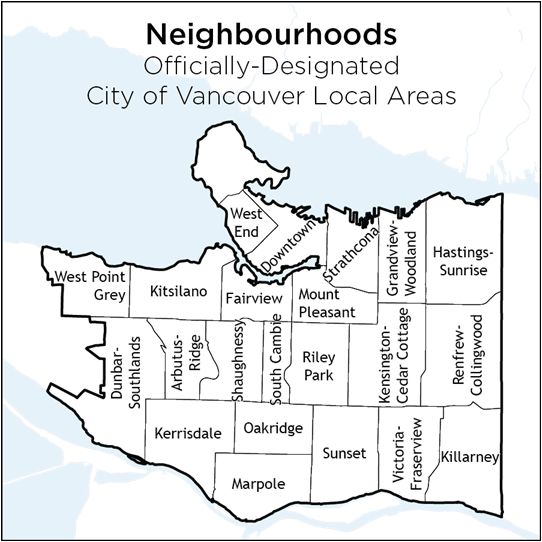
Social Indicators and Trends 2014: A Good Start
Neighbourhoods farther away from Downtown tend to have proportionally more children. The 2011
census revealed a clear pattern in the distribution of children as a share of each neighbourhood’s total
population. However, because the total population varies considerably in Vancouver’s neighbourhoods,
patterns in the absolute number of children are less clear.

The distribution of children may be changing. From 2006 to 2011, Downtown, Fairview and Kitsilano saw
an increase in the number of children, in contrast to citywide trends. There were also interesting patterns in
the median age of children in each neighbourhood.

Neighbourhoods closer to downtown have tended to have relatively younger children, raising questions
about housing choice, affordability and service provision across the city. Providing licensed childcare and
child-friendly amenities for younger children through development in central neighbourhoods may help make
these areas more appealing for young families.
Data Sources
Information in this section has been adapted from Statistics Canada’s 1986-2011 Census of Population.
Population projections were prepared for the City of Vancouver in 2012 by Urban Futures.

Page 4
Social Indicators and Trends 2014: A Good Start
Indicator: Aboriginal Children
Social, economic, environmental and cultural factors are strong influences on children’s start in life. In
Canada, Aboriginal people, including persons of First Nations, Métis, and Inuit identity, experience more
inequities and vulnerability than the general population. Present and past policies and actions, such as the
Indian residential school system, continue to impact Aboriginal communities today. An urban Aboriginal
people survey found that cultural connectivity, giving back to one’s community, and being close to family
and friends were viewed as indicators of success, more valued than financial wealth. Seeing Aboriginal
children complete their education is also an aspiration caregivers have for the next generation.
The Aboriginal population is younger than the general population, with proportionally more children and
youth and fewer seniors. In 2011, the median age of Vancouver’s overall population was 39.7 years, while
the median age of persons in private households with Aboriginal identity was estimated to be 34.6.

                       Children 0-14                                        Population Pyramid
            Est. Percentage of Total Pop.,                              Est. Dist. by Age and Aboriginal
             2011 by Aboriginal Identity                                Identity, City of Vancouver 2011
     30%                                                          85+
                                                                80-84
     25%                                                  28%   75-79
                                          26%                   70-74
     20%                      23%                               65-69
                                                                60-64
                                                                55-59
     15%                                            17%         50-54
                 16%    16%         16%                         45-49
     10%   12%                                                  40-44
                                                                35-39
     5%                                                         30-34
                                                                25-29
                                                                20-24
     0%                                                         15-19
           Vancouver      Metro      British        Canada      10-14
                        Vancouver   Columbia                      5-9
                                                                  0-4
                 All Persons in Private Households                      15% 12% 9% 6% 3% 0% 3% 6% 9% 12% 15%

                 Persons with Aboriginal Identity

Within Vancouver, Aboriginal children are heavily concentrated in a few areas. In 2012-2013, public
elementary schools in Grandview-Woodland had the most concentrated Aboriginal student populations,
followed by schools near the Musqueam Nation and in the Strathcona area. Sir William MacDonald, Britannia,
Admiral Seymour and Grandview schools had the proportionally largest populations of Aboriginal students.
This uneven distribution reflects the overall distribution of people with Aboriginal identity within Vancouver.

                                                                                                                       Page 5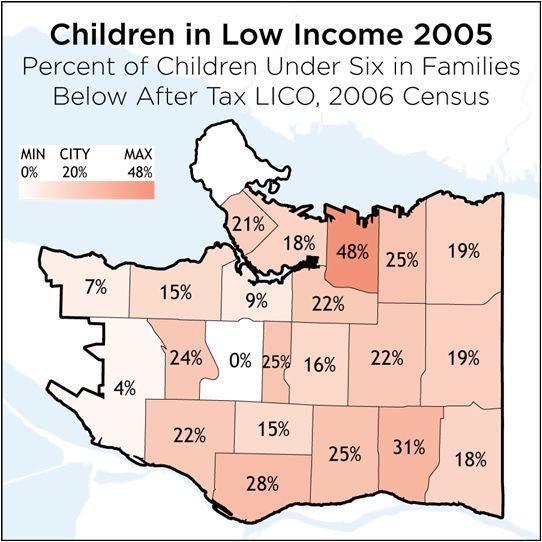
Social Indicators and Trends 2014: A Good Start
In 2011, an estimated 40 per cent of Aboriginal children
under 15 were living in a single parent household.                                     Children 0-14
Aboriginal children were more likely to live with either                 Estimated Percent of Children in
                                                                         Single Parent-Led Families, 2011
their mother, or with another caregiver. For both the
overall population and the Aboriginal population,                40%
approximately 80 per cent of lone parent-led families                            41%

were led by a single mother.                                     30%                          35%          34%          34%

Three per cent of Aboriginal children were living with           20%
grandparents, compared to less than one per cent of
                                                                           17%                       16%          17%
the overall population. Twelve per cent were                     10%                    15%
stepchildren, compared to seven per cent of the overall
population. Almost half of foster children in British             0%
                                                                         Vancouver        Metro       British     Canada
Columbia were Aboriginal.                                                               Vancouver    Columbia
Beyond financial success, Aboriginal people in                      Children With Non-Aboriginal Identity
Vancouver define success as living a balanced lifestyle,
                                                                    Children with Aboriginal Identity
being close to family and friends, and having a strong
connection to one’s culture. In the 2010 Urban
Aboriginal Peoples Study, 91 per cent of respondents felt it was very important to raise healthy,
well-adjusted children to contribute to their community.
Aboriginal children are more likely to live in low income families. As discussed later in this document,
income statistics from the 2011 National Household Survey cannot be compared to other measures, but
comparisons can be made between groups within the survey. Low income rates for Vancouver Aboriginal
children under six were almost twice that of the overall child population in 2010. More than one in four
Aboriginal people in Vancouver had family incomes in the bottom 10 per cent of family incomes in Canada.

                     Low Income 2010                                     Income Polarization 2010
              Est Children Under Six in Families                         Vancouver Family Income Dist.
               Below After Tax LIM, 2011 NHS                            by Nat'l Income Deciles, 2011 NHS
                                                                 30%
     40%
                     42%
                                                                 25%
     30%                         33%          33%
                                                           31%   20%

     20%       22%                                               15%
                           20%          19%
                                                     17%         10%
     10%
                                                                 5%
         0%
                                                                 0%
               Vancouver     Metro      British      Canada
                                                                  Bottom 10%                                        Top 10%
                           Vancouver   Columbia
                                                                             Canada-Wide Family Income Deciles
                 Overall Population (Private Households)
                 Aboriginal Identity (Off Reserve)                     Overall Population     Aboriginal Identity Population

Data Sources
Population, family type and income estimates are from Statistics Canada’s 2011 National Household Survey.
School enrollment data is available from the BC Ministry of Education; summary statistics can be
downloaded through the BC Government’s data catalogue at data.gov.bc.ca. Note that not all students in a
catchment area necessarily attend their designated school.
Information about the 2010 Urban Aboriginal Peoples Study can be found at uaps.ca.

Page 6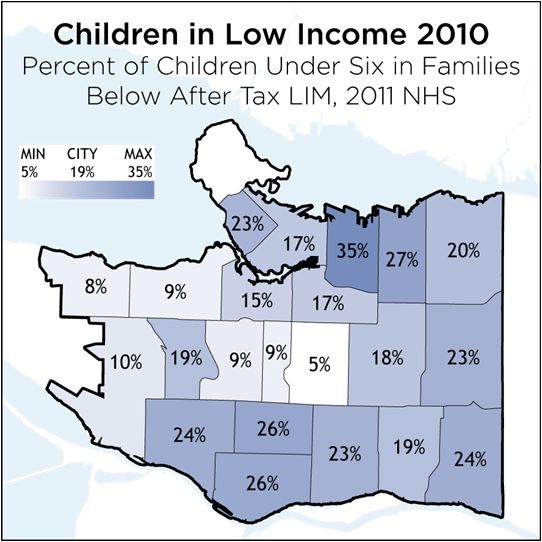
Social Indicators and Trends 2014: A Good Start
Indicator: Children’s Health Outcomes
Life expectancy has increased, but many children’s health indicators present a mixed picture. Compared
to the region and the province, the most recent statistics available showed the Vancouver Health Service
Delivery Area (HSDA) having a lower rate of hospitalization, but higher rates of infant mortality. Vancouver
had a higher rate of children in need of protection, as defined and reported by the Ministry of Children and
Family Development, than the Metro Vancouver region, but a lower rate than the province overall.

           Life Expectancy at Birth                              Selected Health Indicators
               Projected Years of Life                                Rates Per 1000 Population,
              By Geography, 1987-2011                                        2008-2012
     86                                                     10
     84                                                      8
     82
                                                             6
     80
                                                             4
     78
     76                                                      2
     74                                                      0

                                                                                                         (Poison/Injury)

                                                                                                                           Children 0-18 in
                                                                                        Hospitalizaton
                                                                  Infant Mortality

                                                                                                         Hospitalization
                                                                                        (Respiratory)
     72

                                                                                          2011-2012

                                                                                                           2011-2012
                                                                     2008-2012

                                                                                                                             Protection
                                                                                                                               Need of
     70

                                                                                             0-14

                                                                                                              0-14

                                                                                                                                 2011
          1987-    1992-     1997-    2002-     2007-
          1991     1996      2001     2006      2011

              Metro Vancouver         Britsh Columbia
              Vancouver HSDA                                     BC                  Metro Vancouver           Vancouver HSDA

There are health inequities between children in different parts of Vancouver. Over time some inequities
have been reduced: differences in life expectancy, in particular, have become much less acute than in the
past, particularly as acute health issues in the Downtown Eastside have been addressed. Life expectancy
remains lowest in the Downtown Eastside health area: someone born in the area from 2007 to 2011 could
expect to die four years earlier than someone in the West Side health area. However, the difference is
smaller than it has been in the past.

           Life Expectancy at Birth
          Projected Years of Life by Vanc.
            Local Health Area, 1987-2011
     86
     84
     82
     80
     78
     76
     74
     72
     70
          1987-    1992-     1997-    2002-     2007-
          1991     1996      2001     2006      2011

            West Side                South Vancouver
            North East               Midtown
            City Centre              Downtown Eastside

There are still notable differences in physical, social and emotional vulnerabilities among children in
different parts of the city.

                                                                                                                                              Page 7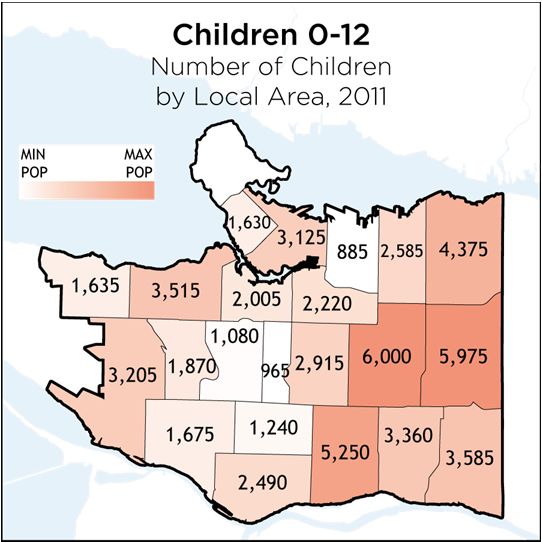
Social Indicators and Trends 2014: A Good Start
Children’s hospitalization rates show different patterns. In 2011 and 2012, the highest rate for both
respiratory-related and poison or injury-related hospitalization was found in the Downtown Eastside local
health area, but the lowest rates were found in different areas. Children in the West Side health area were
least likely to be hospitalized for respiratory issues, but children in the City Centre health area were least
likely to be hospitalized for poisoning or injury.

Among the health indicators discussed on the previous page, the most dramatic differences between local
health areas were seen in the rates of children in need of protection in 2011. Juxtaposing these statistics
with the rate of children in government care shows that rates vary substantially across the city, but in
different ways. The highest concentration of children considered in need of protection in 2011 was found in
the Downtown Eastside health area, while the highest rate of children in care in 2012 was in the North East
health area.

Data Sources
Information in this section is adapted from the BC Ministry of Health and the BC Vital Statistics Agency, as
compiled in BC Statistics socio-economic profiles.

Page 8
Social Indicators and Trends 2014: A Good Start
Indicator: School Readiness
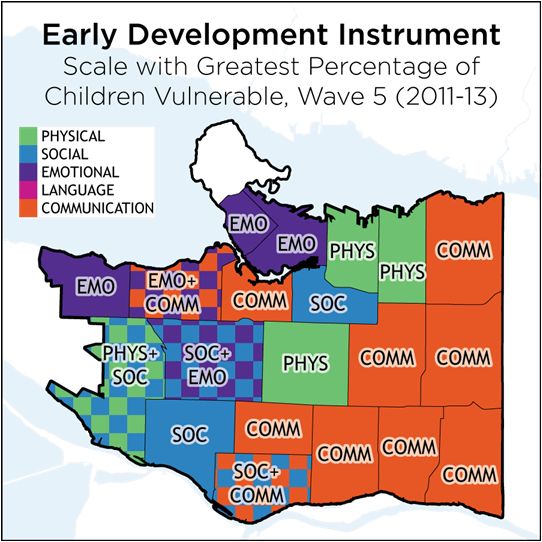
The Early Development Instrument (EDI) is a tool developed by researchers at the Offord Centre, McMaster
University and pioneered by the University of British Columbia (UBC)’s Human Early Learning Partnership
(HELP) to regularly measure and report on children’s readiness for school across the whole population. The
EDI measures children’s development on five scales: physical health and well-being; social competence;
emotional maturity; language and cognitive development; and communication skills and general knowledge.
Children scoring below established vulnerability cut-offs are considered more likely to be limited in
development than those scoring above. The EDI is a voluntary survey that has been administered in four
waves from 2004 to 2013 across the province.
Using the “vulnerable on one or more scales” measure, Vancouver’s children have consistently had higher
vulnerability scores than the regional or provincial average. In 2011-2013, 35 per cent of Vancouver’s
children were considered vulnerable; this means that they were likely to experience challenges in one or
more areas of their development. If overall vulnerability excluding the communication scale is used,
28 per cent of children were still considered vulnerable, slightly lower than the overall provincial figure.
Early Development Instr. Early Development Instr.
Percentage of Children Percentage of Children Vuln. on
Vulnerable on 1+ Scales 1+ Scales (Excl Communication)
40% 40 40%
38
37
35% 35 35%
32
30% 30% 30
28 28
25% 25%
20% 20%
2004-07 2007-09 2009-11 2011-13 2004-07 2007-09 2009-11 2011-13
EDI Survey Period EDI Survey Period
Vancouver Metro Van BC Vancouver BC Metro Van
Based on 2011 census data, there were some 4,700
children aged five years in Vancouver. If 35 per cent Early Development Instr.
were more likely to experience challenges in their Percentage of Vanc. Children
Vulnerable on Each Scale
development, this means that over 1,600 children in
just one year entered school with limitations that 40%
impacted their readiness for school. 32%
Some vulnerability is due to congenital or diagnosable 24%
medical conditions. Approximately 3-5 per cent of 16%
children are born with these conditions, and they may
encounter unavoidable vulnerabilities that may impact 8%
their development. However, most of the vulnerability 0%
measured in Vancouver is avoidable. HELP considers 2004-07 2007-09 2009-11 2011-13
vulnerability rates greater than 10 per cent to be EDI Survey Period
avoidable. By creating environments in which children
can thrive, the vast majority of children can develop Physical Social Emotional
optimally and experience a good start in life. Language Communication One or More
Page 9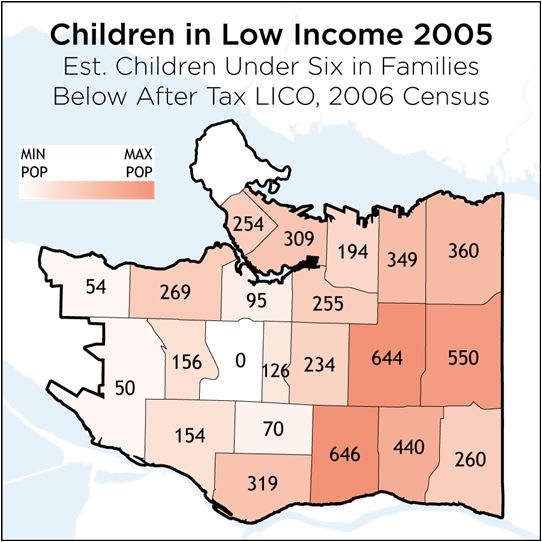
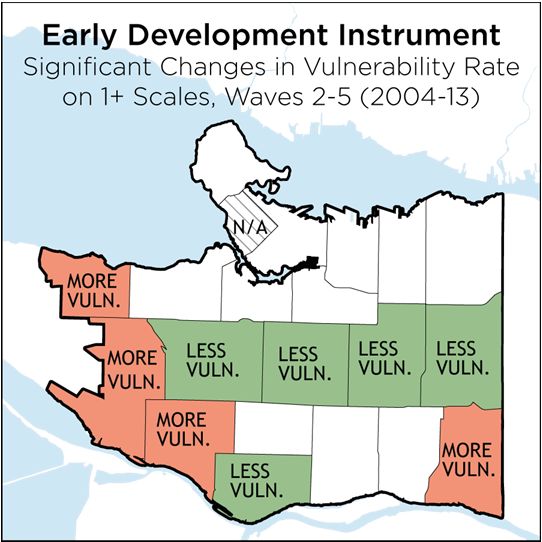
Social Indicators and Trends 2014: A Good Start
Within Vancouver’s neighbourhoods, child vulnerability mirrors other socioeconomic and demographic
trends. The map below left illustrates the proportion of children considered vulnerable in the most recent
EDI survey. Strathcona had the greatest proportion of children considered vulnerable while Kitsilano had the
smallest proportion. Children in east side neighbourhoods were generally more likely to be considered
vulnerable, but the differences were not always great. Different neighbourhoods showed different patterns
of vulnerability as well; the map below right illustrates the scale on which the greatest rate of vulnerability
was seen.

Change over time shows a mixed picture in Vancouver’s neighbourhoods. Overall, Vancouver children
were less likely to be considered vulnerable in the most recent survey than they were ten years ago.
However, different neighbourhoods have changed in different ways.
Using thresholds published by UBC HELP, it is possible to
calculate whether changes in vulnerability are
statistically significant. Vancouver’s overall change from
38 per cent of children in 2004-2007 to 35 per cent in
2011-2013 is considered a significant reduction. Over
the same period, four neighbourhoods have seen
significant increases in the rate of children considered
vulnerable: West Point Grey, Dunbar-Southlands,
Kerrisdale and Killarney. By contrast, Marpole,
Arbutus-Ridge, Shaughnessy, South Cambie, Riley Park,
Kensington-Cedar Cottage and Renfrew-Collingwood
have a significantly lower rate of vulnerability on the
most recent survey compared to the 2004-2007 period.
Change in all other neighbourhoods has not been
considered significant, and the sample size in the West
End has been too small to calculate significance.
Data Sources
Statistics in this section are adapted from information published by UBC’s Human Early Learning Partnership
(HELP). Information about the EDI, including methods, maps, data tables and a bibliography, can be
accessed at earlylearning.ubc.ca/edi.

Page 10
Social Indicators and Trends 2014: A Good Start
Indicator: Children in Low Income Families
Income is itself a determinant of a health and well-being, and it also influences the quality of many other
areas such as: housing choices; food security; access to education and employment; working conditions;
transportation choices; recreation activities; and social inclusion. Families with low incomes are more likely
to experience both material and social deprivation.
Low income measures are not measures of poverty per se, but they are often used to suggest the prevalence
of poverty. There are many measures of low income status; the most commonly used has been the after-tax
low income cut-off (LICO). This figure is based on a family’s relative expenditures on a basket of basic
household goods. The LICO uses a baseline, determined by a survey of families in 1992, identifying the
income level at which a family spent 20 percentage points more than the average family on basic necessities
of food, clothing and shelter. Although imperfect, this facilitates comparisons across years, geographies,
ages and family types.
In 2011, Metro Vancouver had the second highest rate of persons under 18 in low income families
among all major census metropolitan areas in Canada. In recent years, this rate has consistently been
higher in Metro Vancouver than the overall provincial and national rate. However, there is an overall trend
of low income rates declining over the medium term.

               Low Income Rates                                            Low Income Rates
            Persons Under 18 Below LICO                           Percentage of Persons Under 18
           After Tax, Selected Regions 2011                       Below LICO After Tax, 2001-2011
     20%                                                    25%

     15%                                                    20%

     10%
                                                            15%

     5%
                                                            10%
     0%
                                                             5%
                    Montréal
           Metro Vancouver
                   Edmonton

                     Victoria
                    Hamilton

                     Toronto

                      Halifax
                      London

                     Québec
                   Saskatoon
           Kitch-Camb-Wloo

             St Cath-Niagara
                     Calgary

                 Sherbrooke
           Ottawa-Gatineau
                     Windsor

                    Winnipeg

                     Oshawa
                   St. John's

                      Regina

                                                             0%
                                                                  2001      2003     2005           2007       2009     2011

                                                                         Metro Vancouver               BC             Canada

Comparative low income cut-off data specific to
Vancouver from the 2011 National Household Survey are               Low Income Rates 2005
not available. The best available data for comparison                Percentage of Persons Low
                                                                   Income After Tax, 2006 Census
are from the 2006 census, which provided a more
detailed breakdown of low income status by age group        35%
and geography in 2005.                                      30%
                                                            25%
Based on 2006 data, the City of Vancouver had a
greater low income rate than the region, the                20%

province or the country across all age groups. The          15%
likelihood of living with low income increased as           10%
children aged: nearly 20 per cent of Vancouver children      5%
under six years of age, 23 per cent of all children and      0%
youth under 18, and over a third of youth aged 18 to 24
                                                                                   18-24

                                                                                            25-44

                                                                                                       45-64

                                                                                                                        Overall
Social Indicators and Trends 2014: A Good Start There were also wide disparities in the rates of children in low income families between Vancouver’s neighbourhoods. Nearly half of the young children (under six years) in Strathcona were considered low income, while Shaughnessy counted no children below the low income cut-off (LICO). Beyond these two areas, however, trends were mixed: Dunbar-Southlands and West Point Grey had the lowest low income rates for children, but Arbutus-Ridge and Kerrisdale had relatively high rates. The highest rate outside Strathcona was found in Victoria-Fraserview. Sunset, Kensington-Cedar Cottage and Renfrew-Collingwood reported the greatest absolute number of low income children in the 2006 census. As mentioned, income data from the 2011 National Household Survey are not comparable; low income rates for 2010 based on the survey were calculated using the low income measure (LIM), a relative measure of low incomes. The maps below are thus not comparable to the maps above, but they do provide a more recent approximation of the relative likelihood of children growing up in poverty in different parts of the city. Page 12
Social Indicators and Trends 2014: A Good Start
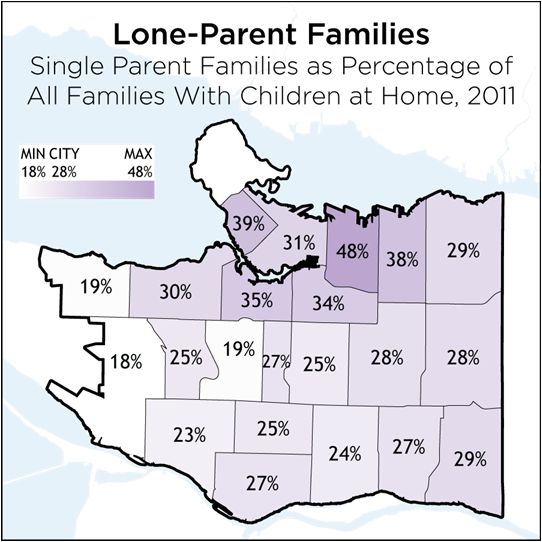
Family type is a predictor of low income status. Families led by a lone parent generally have lower
incomes than two-parent families. In Metro Vancouver, the median after-tax income for lone parent-led
families reported on the 2006 census was 58 per cent of the median for couple families. Except for 2008 to
2010—which may be outlier data—low income rates in Metro Vancouver have consistently been much higher
for lone parent-led families than other family types.
For this reason, it is not surprising that the rates of lone-parent families in Vancouver in 2011 were similar
to low income rates; again, Strathcona had the highest proportion of lone-parent families while
Shaughnessy, Dunbar-Southlands and West Point Grey had the smallest. The vast majority of lone parent-led
families for all areas were led by female parents.
Family Types and Incomes
Metro Van. Persons Below LICO
by Family Type, 1976-2011
75%
60%
45%
30%
15%
0%
1976 1981 1986 1991 1996 2001 2006 2011
1 Parent Family 2 Parent Family
Unattached Childless Couple
Although overall low income rates are relatively
steady, many individual children do leave low income Low Income Entry and Exit
BC Children Under 18 Changing
situations. From 2009 to 2010, for instance, 30 per cent Relative to LICO, 1993-2010
of BC children under 18 who were in low income
families in 2009 were no longer low income in 2010. 100% 0%
Under 18 Becoming Low Income
Under 18 Exiting Low Income
Meanwhile, just four per cent of children whose family
75% 25%
income was above the low income cut-off became low
income.
50% 50%
This is not a complete picture, nor entirely positive
news: from 2009 to 2010, 70 per cent of BC children 25% 75%
stayed in low income families. But these statistics do
suggest that there are more children exiting poverty 0% 100%
than entering it.
1993-94
1995-96
1997-98
1999-00
2001-02
2003-04
2005-06
2007-08
2009-10
Data Sources
Annual and comparative income statistics over time are No Longer Low Income Becoming Low Income
adapted from Statistics Canada’s Survey of Labour and
Income Dynamics, accessible at statcan.gc.ca/bsolc/olc-cel/olc-cel?catno=75-202-x.
Other information in this section has been adapted from Statistics Canada’s 2006 and 2011 Census of
Population.
Page 13Social Indicators and Trends 2014: A Good Start
Indicator: Licensed Childcare Supply
Affordable, accessible and high-quality childcare is a key element of a good start. Investing in childcare pays
off in a number of ways, including: increased labour force participation, particularly for women; improved
school readiness; and positive early development. However, many families cannot access or afford childcare.
Achieving a good start for all depends upon provincial policy and funding, though the City of Vancouver
continues to facilitate the development of licensed childcare through land use decisions, development
levies, municipal grants and capital projects. In 2010, British Columbia’s per child expenditure was fifth
highest among the provinces and territories, and it had the sixth most spaces per child. As other provinces
have made greater investments in childcare, British Columbia is falling behind the national average.
Licensed Childcare Spaces Childcare Expenditures
Per 100 Children Aged 0-12, Dollars Per Child Aged 0-12
1992-2010 Invested in Licensed Childcare
24 $800
20
$600
16
$400
12
8 $200
4
$0
0 1992 1995 1998 2001 2003- 2005- 2007- 2010
1992 1995 1998 2001 2004 2006 2008 2010 2004 2006 2008
Canada (Provinces+Territories) BC Canada (Provinces+Territories) BC
Within Metro Vancouver, the City of Vancouver is in the middle of the pack in the provision of licensed
childcare. However, as of 2011, most of Vancouver’s childcare spaces were in group care facilities, which
are considered a higher quality, more stable, longer term option than family care.
Licensed Childcare Spaces Vancouver Childcare Fees
Per 100 Children Aged 0-12, Median Monthly Rate by
2011 by Type and Municipality Childcare Type, 2006-2014
24 $1,400
20
$1,200
16
12 $1,000
8 $800
4
0 $600
Richmond
West Van
Wht Rock
Delta
Poco
Coquitlam
M Ridge
Vancouver
North Van D
North Van C
New West
Langley T
Metro Van
P Meadows
Burnaby
Pt Moody
Surrey
Langley C
$400
$200
$0
2006 2007 2008 2009 2010 2011 2012 2013 2014
Group Care Preschool
Family Care Multiple/Other Infant Toddler Age 3-5
Childcare in Vancouver is expensive and increasing faster than inflation. In 2014, the median monthly fee
for infant or toddler care was about $1,250. Between 2006 and 2014, median monthly fees increased by 24
per cent for infant spaces, 34 per cent for toddler spaces and 41 per cent for three-to-five year-old spaces.
The Consumer Price Index in Metro Vancouver increased by approximately 11 per cent over this period.
Page 14Social Indicators and Trends 2014: A Good Start
Childcare supply is inadequate in most Vancouver neighbourhoods, and few infant/toddler spaces for
children under three years of age exist overall. The maps below illustrate the per-child supply of licensed
spaces for each age group in 2011. A lack of accessible, affordable childcare makes Vancouver a less
desirable place to live for many families.
Although there is a clear deficit in childcare spaces, fully assessing the need for childcare must also take
into account community demographics, vulnerabilities, employment and transportation networks. The
numbers presented here are just one element of assessing the status and need for childcare in Vancouver.
Data Sources
Data on childcare spaces and fees within the City of Vancouver are compiled and maintained by West Coast
Child Care Resource Centre, wstcoast.org. Information on the City’s role in childcare is found at
vancouver.ca/childcare.
Comparative childcare spaces across provinces are adapted from statistics compiled for the Federal-
Provincial-Territorial Multilateral Framework for Early Learning and Child Care, ecd-elcc.ca. Comparisons
across Metro Vancouver municipalities were compiled by Metro Vancouver for a 2011 Child Care Inventory
report, October 28, 2011.
Child populations are adapted from Statistics Canada’s 2011 Census of Population.
Page 15Social Indicators and Trends 2014: A Good Start
Toward a Healthy City for All
The indicators presented here raise several questions about the path to a good start for Vancouver’s
children:
What can Vancouver do to become more livable, affordable and attractive to young families?
How can vulnerabilities that Vancouver’s children face, such as poverty, be addressed?
The City of Vancouver has committed to supporting an integrated, affordable public system of early
care and learning. How can this vision be achieved?
Answering these questions will be a complex challenge, requiring partnerships between the City of
Vancouver, other levels of government, service providers and the private sector.
The City’s Role
Many of the factors that give rise to inequality and vulnerability among children are beyond the City’s direct
control. The City of Vancouver does not provide childcare or other social services directly. However, key
areas that the City can show leadership include:
Planning communities to be welcoming, safe, inclusive and sustainable for families.
Supporting children and families and building community capacity through policy, grants and
support to community facilities and organizations.
Continuing to facilitate childcare through development, infrastructure and grants.
Advocating for accessible, affordable childcare policies and funding.
Engaging the city in developing coordinated strategies in these areas.
Priority Actions
Some specific actions the City may undertake include:
Further advocacy for enhanced parental leave and employment benefits for families.
Continued advocacy for a comprehensive, affordable, high-quality public early care and learning
system.
The development of a citywide childcare amenity plan.
Continued facilitation of new childcare spaces across the city.
Convening of partners to support Aboriginal children and families.
Continued support to families and children through City grants and initiatives.
Your Turn
Achieving a healthy city for all will require ideas and action on the part of governments, agencies,
organizations and the private sector. It will also require all Vancouverites to take part. A Good Start is a
collective goal for all of us:
How can we collectively reach the goal that 85 per cent of Vancouver’s children will be ready for
kindergarten by 2025?
Learn more and get involved at vancouver.ca/healthycity4all.You can also read