The relationship between Google search interest for pulmonary symptoms and COVID 19 cases using dynamic conditional correlation analysis
←
→
Page content transcription
If your browser does not render page correctly, please read the page content below
www.nature.com/scientificreports
OPEN The relationship between Google
search interest for pulmonary
symptoms and COVID‑19 cases
using dynamic conditional
correlation analysis
1* 1 2 1
Halit Cinarka , Mehmet Atilla Uysal , Atilla Cifter , Elif Yelda Niksarlioglu &
3
Aslı Çarkoğlu
This study aims to evaluate the monitoring and predictive value of web-based symptoms (fever,
cough, dyspnea) searches for COVID-19 spread. Daily search interests from Turkey, Italy, Spain,
France, and the United Kingdom were obtained from Google Trends (GT) between January 1, 2020,
and August 31, 2020. In addition to conventional correlational models, we studied the time-varying
correlation between GT search and new case reports; we used dynamic conditional correlation (DCC)
and sliding windows correlation models. We found time-varying correlations between pulmonary
symptoms on GT and new cases to be significant. The DCC model proved more powerful than the
sliding windows correlation model. This model also provided better at time-varying correlations
(r ≥ 0.90) during the first wave of the pandemic. We used a root means square error (RMSE) approach
to attain symptom-specific shift days and showed that pulmonary symptom searches on GT should
be shifted separately. Web-based search interest for pulmonary symptoms of COVID-19 is a reliable
predictor of later reported cases for the first wave of the COVID-19 pandemic. Illness-specific symptom
search interest on GT can be used to alert the healthcare system to prepare and allocate resources
needed ahead of time.
The new Coronavirus (SARS-CoV-2) causing Coronavirus disease 2019 (COVID-19) was first detected in
Wuhan, China, in December 2019 and rapidly spread w orldwide1, reaching a pandemic status by March 11,
2
2020 . Europe was the second epicenter of the pandemic after Wuhan and continues to struggle with control-
ling the spread and fatalities due to COVID-19. As of December 2020, the World Health Organization (WHO)
reported more than 70 million confirmed cases and close to 1.6 million deaths globally; Europe reported close
to 22 million confirmed cases and an excess of 450 thousand f atalities3.
National responses and the ability to monitor and control the pandemic varied significantly, especially dur-
ing the first months4. With the implementation of social distancing regulations, millions turned to the internet
to find answers to their questions and worries about the pandemic; between March and May 2020, Coronavirus
related searches became the most popular search terms on Google5.
Google Trends (GT) is a web-based, innovative tool made available by Google to analyze the content, fre-
quency, and popularity of search queries in Google search across various regions and languages. Analysis can
be carried out within a given timeframe, focused on a particular public event such as the onset of an epidemic6.
There is a growing body of research demonstrating the use of GT that monitoring online queries via GT
correlates with specific behavioral outcomes. Previous studies using various methods analyzed the relationship
between GT search interest and suicide rates, infectious diseases transmissibility, and the spread trajectory of
emerging new pathogens such as SARS, Ebola, and 2009 influenza7–10. Various studies focusing on the public
search interest on the web revealed GT search interest monitoring for symptom searches to be valuable in iden-
tifying new cases in COVID-19 pandemics11–13.
1
Yedikule Training and Research Hospital for Chest Diseases and Thoracic Surgery, University of Health Sciences
Turkey, Istanbul, Turkey. 2Department of Economics, Altinbas University, Istanbul, Turkey. 3Department of
Psychology, Kadir Has University, Istanbul, Turkey. *email: halit.cinarka@sbu.edu.tr
Scientific Reports | (2021) 11:14387 | https://doi.org/10.1038/s41598-021-93836-y 1
Vol.:(0123456789)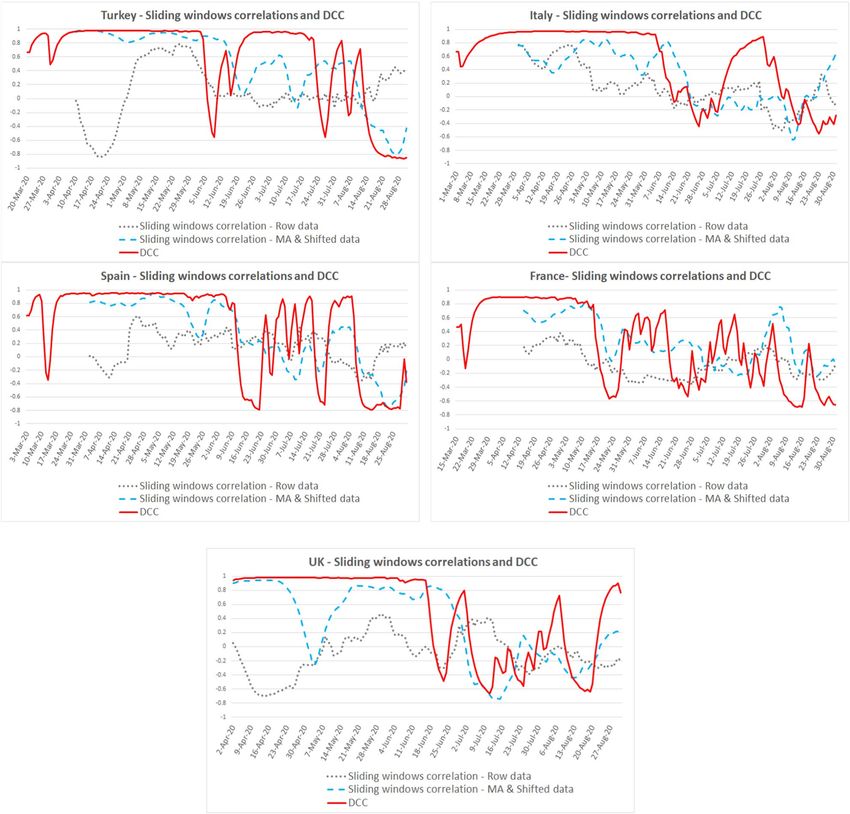
www.nature.com/scientificreports/
There is also some disagreement in the field about the validity of using Google Trends as a tool for digital
epidemiology14–16. GT data can be influenced by many factors: historical events, public interest, or media cov-
erage. However, when we study the relationship of this fragile data with actual data such as daily confirmed
COVID-19 cases, the resulting correlation can be more reliable. Thus, monitoring this relationship can be a
viable tool for understanding the movement of the pandemic.
Lippi et al. investigated the capacity of Google search volume of symptoms such as fever, cough, and dyspnea
to predict the trajectory of the early 2020 COVID-19 outbreak in Italy using Spearman’s correlation method.
They concluded that GT’s continuous monitoring is a valuable instrument in the early detection of COVID-19
outbreaks12. Most studies used conventional correlation methods to determine the relationship between symptom
search and cases12,17–19. Other studies employed moving average (MA) methods to smooth daily fluctuations
of symptoms and later new case emergence, and they selected three to seven days as their moving a verage20,21.
Some authors also preferred shifting the symptom search results to match the GT search and new cases21–23.
One common denominator in all these studies was the use of non-dynamic statistical procedures. Another
approach is to use wave analysis to detect the co-movement between symptoms and cases24. However, this
approach has the limitation of not seeing correlation over time.
Asseo et al. relied on sliding windows correlations, a straightforward time-varying approach to assess the
relationship between taste and smell loss on GT, and emerging case numbers. The sliding windows correlation
method allows for monitoring correlations for each time period separately but still uses Pearson c orrelations25.
Asseo et al.’s approach carries the limitation of conventional correlation, which lacks the ability to work with
time-varying co-movement. On the other hand, the DCC model considers both time-varying correlation and
time-varying variances, and this method is more powerful than the conventional correlation methods, including
sliding windows with Pearson or Spearman correlation a nalysis26.
The DCC model, developed initially for financial time series, has been used by several researchers in finance
and neuroscience. In finance, several studies used the method to investigate Google search interest and financial
market behaviors27–29. In neuroscience, Lindquist et al. used the DCC model to study the time-varying correla-
tion among several brain signals in functional magnetic resonance imaging (fMRI). The authors concluded that
the DCC model better captured time-varying correlations as it minimizes random noise in the e stimations26.
We believe the DCC model can also be used in health sciences to capture the time-varying relationship between
symptom search and new case emergence.
We aim to present DCC as a model that better fits the time-lagged nature of our data set and compare its
viability against the sliding window correlation method to study the relationship between searches of fever, cough,
and dyspnea on GT and new cases in Turkey, Italy, Spain, France, and the UK.
Methods
Data. Google search interest trends are calculated by dividing the number of queries of interest by the total
number of queries for all search terms over the same time and region. Each query share is normalized on a scale
of 0 to 100, with 100 representing the share’s maximum value for the period and region selected. The scaled
query share values are plotted daily, generating a time series. Search terms included pulmonary symptoms, e.g.,
fever, cough, dyspnea, as previously reported to be associated with COVID-19 infection [15 Lippi]. Searches for
these terms covered Turkey, Italy, Spain, France, and the United Kingdom (UK), the European countries most
affected by the COVID-19 pandemic. We have focused on these countries due to differences in geographic loca-
tions, cultures, and health systems.
Furthermore, the first wave of the pandemic presented at different times across these countries. At the same
time, similar precautionary measures such as the shutdown of all schools and universities, closure of museums,
cultural centers, cinemas, theatres, pubs, and the suspension of international flights were undertaken in all
countries at approximately the same t ime30,31.
Google searches for pulmonary symptoms were obtained by R X64 40.2(R: A Language and Environment for
Statistical Computing) using "gtrendsR" package for the dates between January 01 and August 31, 2020. Search
terms were determined in Turkish and were later translated to the relevant languages (Italian, French, Spanish,
and English) via Google Translate, and then checked for accuracy by native speakers. We used "fever," "cough"
and "dyspnea" or "shortness of breath" as search terms for pulmonary symptoms ("ateş", öksürük", "nefes darlığı"
for Turkish, "febbre ", tosse" and "dyspnée" for Italian, "fièvre", "toux” and "essoufflemen" for French, "fiebre",
"tosse" and "dyspnea", for Spanish). Each term was searched, selecting “all categories” for each particular country.
The search was conducted on September 1, 2020. We obtained the data of new cases for each country from the
WHO COVID-19 d atabase3.
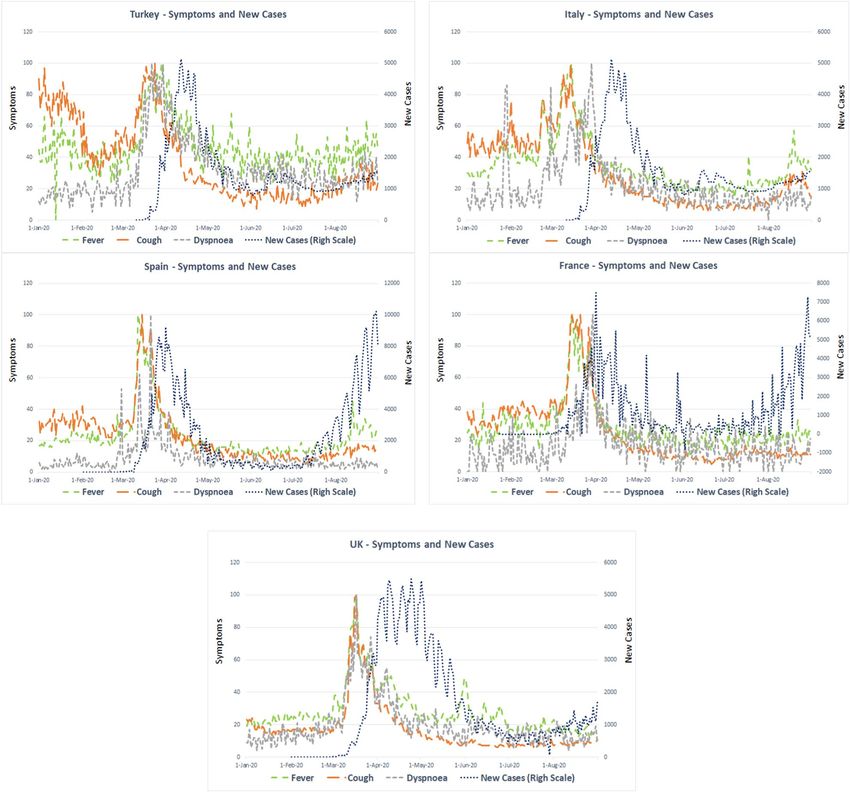
Statistical analysis. An initial check of the raw data revealed very high fluctuations and time lags between
symptoms and new cases (see Fig. 1). Previous studies used a 3- to 7-day moving a verages20,21,32 to transform
the data. We analyzed our data using various moving averages ranging from 3 to 7 days to deal with the high
fluctuations and observed that five days was most appropriate to smooth the data. Next, we shifted symptom
search results forward to capture the time lag between symptom searches and new case reports. We realized that
each symptom in each country needed a unique time period. We used the RMSE approach to determine the best
fit period for each symptom in each country. Symptoms were shifted forward until the minimum RMSE was
observed. We used the sliding windows correlation offered by Asseo et al. The authors selected a time frame of
31 days and rolled the correlation with one day25. We deployed the same method and calculated sliding window
correlations for the raw data, moving average, and shifted data.
We later carried out the DCC model to understand the dynamic correlation between Google search interest
for the three identified pulmonary symptoms and new cases. The DCC method, originally proposed by Engle
Scientific Reports | (2021) 11:14387 | https://doi.org/10.1038/s41598-021-93836-y 2
Vol:.(1234567890)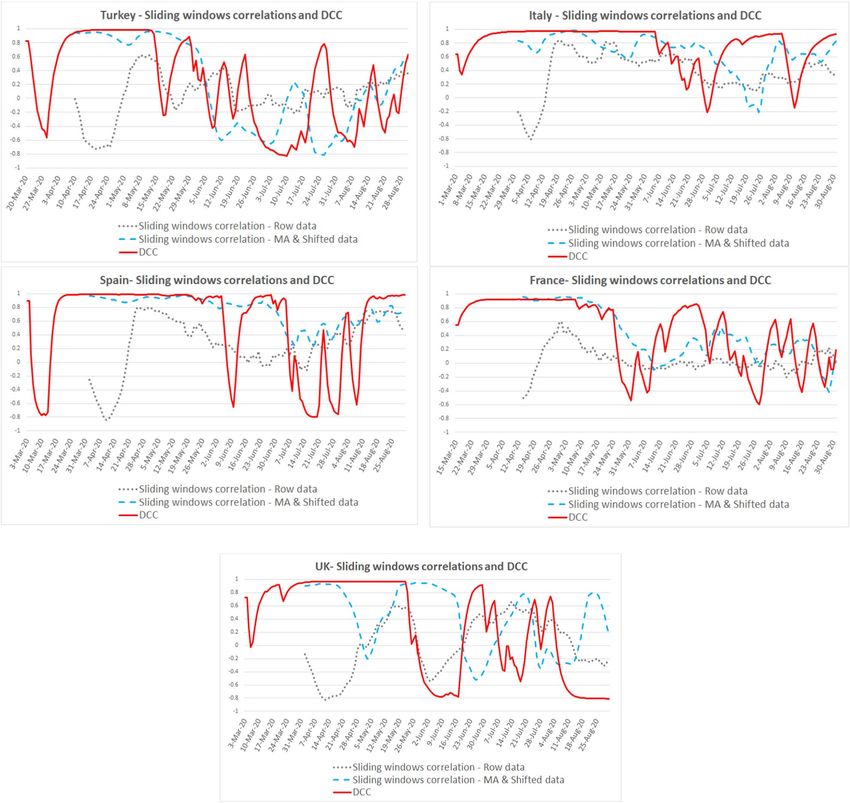
www.nature.com/scientificreports/
Figure 1. Symptoms and cases in raw data.
et al.33 has been adapted to different multivariate cases by Tse et al.34. This method was developed for conditional
volatility in financial portfolios, and it has been used in interdisciplinary fields26. The DCC model proved more
powerful than the Pearson, Spearman’s rank, or constant conditional correlation model as it captures dynamic
correlations between two-time series (For a detailed description of the method, refer to Tse et al.). We ana-
lyzed the data using Oxmetrics 8 software and Microsoft Excel Microsoft, Redmond, WA, United States), and a
p-value < 0.05 was considered to indicate as statistically significant difference.
Results
We initially checked the normality of the data using the Shapiro–Wilk test and observed that not all the series
were normally distributed. Therefore, we used Spearman correlations instead of Pearson correlations for the
rest of our analyses. The Spearman correlations for raw data and five days moving averaged and shifted data are
presented in Table 1. When we examined the raw data, we found correlation coefficients to be weak (less than
50%) and/or non-significant for most symptom searches and cases. We first transformed the observations to
a five-day moving average, then shifted symptoms separately with the RMSE values. We found that Spearman
correlation coefficients between symptoms and new cases increased to moderate levels and became significant
at p < 0.01 (see Table 1 for symptom-specific p-values). Figure 2 shows the RMSE values for fever, cough, dysp-
nea in five countries. The arrows show the optimum shift days where the RMSE values are minimum. Table 2
lists the symptom search shifts for each symptom in each country. We observed that the optimum time lag for
each symptom ranged from 8 to 24 days. These findings show that search terms on GT may need to be shifted
separately to better fit the nature of the phenomenon at hand.
Scientific Reports | (2021) 11:14387 | https://doi.org/10.1038/s41598-021-93836-y 3
Vol.:(0123456789)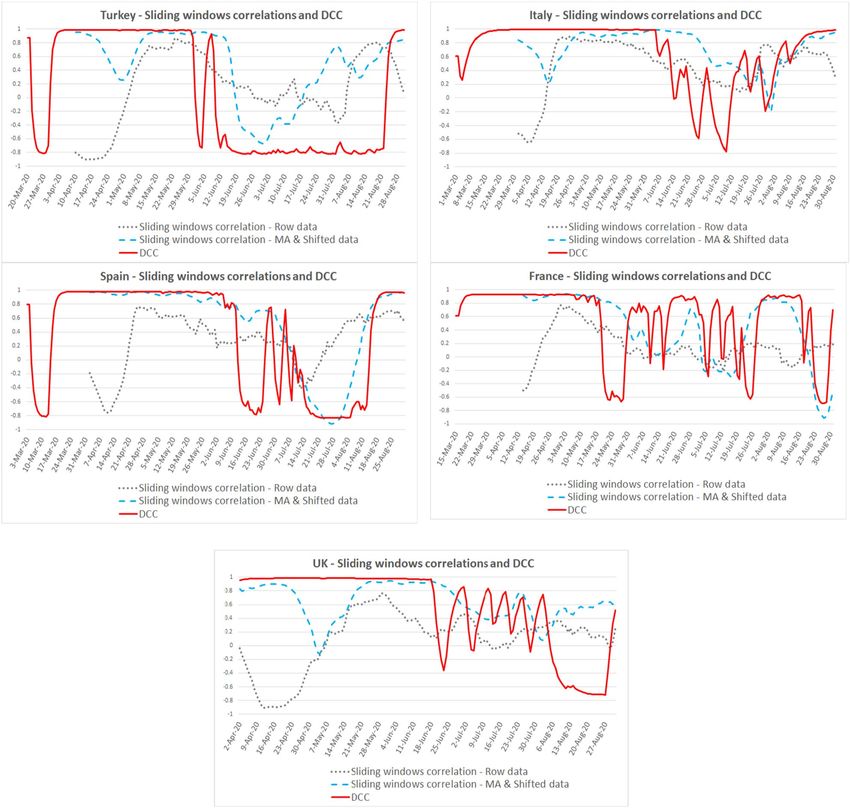
www.nature.com/scientificreports/
Turkey Italy Spain France UK
Fever
0.243 0.295 0.378 0.017 0.257
Raw data
(0.001) (0.000) (0.000) (0.804) (0.000)
0.498 0.899 0.653 0.633 0.630
MA and shifted data
(0.000) (0.000) (0.000) (0.000) (0.000)
Cough
0.184 0.252 0.082 -0.004 0.096
Raw data
(0.015) (0.000) (0.235) (0.955) (0.162)
0.594 0.865 0.339 0.655 0.671
MA and shifted data
(0.000) (0.000) (0.000) (0.000) (0.000)
Dyspnea
0.359 0.479 0.238 0.242 0.291
Raw data
(0.000) (0.000) (0.000) (0.000) (0.000)
0.732 0.781 0.307 0.382 0.744
MA and shifted data
(0.000) (0.000) (0.000) (0.000) (0.000)
Table 1. Spearman correlations between symptoms and new cases. Notes: Symptoms and cases are estimated
with five days moving average, and symptoms are shifted with days with minimum RMSE values. p-values are
shown in parentheses.
Before estimating the time-varying correlation, we checked the dynamic conditional correlation versus con-
stant correlation using two diagnostics: the E-S and the LM tests. These tests use Chi-square fit values and check
if dynamic conditional correlation should be used rather than constant correlation. Table 3 shows that the con-
stant correlation hypothesis should be rejected for all of the series at p < 0.01. We suggest using a time-varying
correlation to monitor the co-movement of symptom search and new cases emergence.
Table 4 reports the DCC coefficients for the relationship between pulmonary symptom searches and new
case emergence in Turkey, Italy, Spain, France, and the UK. We found that significant, moderate to high DCC
correlations. The correlation degree of pulmonary symptom search was different for each of the symptoms and
countries. The findings demonstrate that the null hypothesis of constant correlation should be rejected. (p < 0.01).
Looking at the DCC and sliding window correlation results with raw and MA-shifted data for fever, cough,
and dyspnea symptoms, we found that: First, the DCC model proved a better fit than sliding windows correla-
tion models during the first wave of the pandemic. Second, high fit periods for DCC coefficients (r ≳0.90) were
different in each country.
For fever, the high fit period is April 10–May 14 for Turkey, March 31–June 5 for Italy, April 2–June 4 for
Spain, April 14–May 7 for France, April 18–June 21 for the UK (see Fig. 3 for details).
For cough, the high fit period (r ≳0.90) is April 10–May 14 for Turkey, March 31–June 5 for Italy, April 2–June
5 for Spain, April 14–May 7 for France, April 18–June 18 for the UK, cough symptom search fit is the highest in
the UK (see Fig. 4 for details).
For dyspnea, the DCC coefficient fluctuates after the pandemic’s first wave. The high fit period (r ≳0.90) is
April 10–June 4 for Turkey, March 31–June 5 for Italy, April 2–June 5 for Spain, April 14–May 7 for France, and
April 18–June 16 for the UK (see Fig. 5 for details).
Discussion
This study shows that for three pulmonary symptoms (fever, cough, and dyspnea), google search interest is
correlated with COVID-19 new cases utilizing a DCC model. We also demonstrated that the DCC model’s per-
formance is better than the sliding windows correlation for data from the first wave of COVID-19 pandemics.
Our findings suggest that monitoring Google interest using GT would provide valuable information to produce
preventive and intervention related programming.
Previously, Asseo et al. examined the relationship between smell and taste loss symptoms of COVID-19
Google searches and new COVID-19 cases. They employed a sliding window correlation for time frames of one
month between March 4-August 25, 2020. The authors could not find stable correlations between taste and smell
loss searches and new cases for Italy and the US during the pandemics’ first wave. However, they observed that
this link fluctuates over time and concluded that the correlation between searches of novel symptoms of infec-
tious disease and the number of new cases fluctuates and decreases over t ime25. We found similar fluctuations.
However, we observed much less fluctuation in our data set during the pandemic’s first wave. Fluctuations did
increase, and correlations decreased as the western hemisphere moved into the summer period.
Lippi et al. investigated the relationship between the volume of Google searches for the most frequent symp-
toms (fever, cough, and dyspnea) of SARS-CoV-2 infection and new cases using the Spearman correlation test.
They did not find a significant correlation between cough/fever and new cases, respectively, but did detect a
significant correlation for dyspnea. However, the correlation between newly diagnosed COVID-19 cases and
“cough” and “fever” search terms became statistically significant with a 3-week delay. This study used a standard
three-week time period and failed to see correlations in several s ymptoms15. However, we used symptom and
country-specific time periods ranging from 8–24 days. This dynamic approach helped reveal the correlation in
a more fine-tuned manner.
Scientific Reports | (2021) 11:14387 | https://doi.org/10.1038/s41598-021-93836-y 4
Vol:.(1234567890)www.nature.com/scientificreports/
Figure 2. Root mean squared errors of symptoms’ shifts.
Turkey Italy Spain France UK
Fever symptom 18 15 14 15 23
Cough 20 21 14 14 24
Dyspnea 18 8 13 8 23
Table 2. Symptom search shifts with minimum root mean squared errors (RMSE) (days).
Most studies used conventional correlation methods, and they could not observe the time-varying co-move-
ment between GT symptom search and new case e mergence17,20. It is important to detect correlations in different
periods, such as wave periods in pandemics. The time-varying correlations approach allows to monitor this co-
movement in different periods and provides us with multiple correlation indexes. The DCC model is such a model
that performs better than other time-varying correlation approaches such as the sliding windows correlation35.
Thus, we used DCC to find time-varying correlations between pulmonary symptoms and new COVID-19 cases.
Previous studies selected a fixed day for each of the countries14,17,19, but the research presented here shows
that a heuristic approach (RMSE) results in different shift days for each country’s GT symptom. Our results
illustrate that Italy, France, and Spain have a shorter time delay ranging from 8 to 21 days; UK and Turkey have
a range of 18 to 24 days from symptom search to new case report. These differences may be due to variations in
Scientific Reports | (2021) 11:14387 | https://doi.org/10.1038/s41598-021-93836-y 5
Vol.:(0123456789)www.nature.com/scientificreports/
Fever symptom—New cases Cough symptom—New cases Dyspnea symptom—New cases
E-S tests
60.812 190.896 63.502
Turkey
(0.000) (0.000) (0.000)
56.487 61.121 62.935
Italy
(0.000) (0.000) (0.000)
44.434 86.255 64.142
France
(0.000) (0.000) (0.000)
126.420 163.946 80.009
Spain
(0.000) (0.000) (0.000)
99.660 133.527 90.217
UK
(0.000) (0.000) (0.000)
The LM Test
32.666 32.121 32.241
Turkey
(0.000) (0.000) (0.000)
35.621 45.185 37.981
Italy
(0.000) (0.000) (0.000)
27.076 28.461 27.076
France
(0.000) (0.000) (0.000)
27.275 27.595 27.597
Spain
(0.000) (0.000) (0.000)
39.914 38.426 43.170
UK
(0.000) (0.000) (0.000)
Table 3. Diagnostic checks of the DCC model. E-S Test(j) ~ χ2(j+1) and LM test ~ (j) ~ χ2(N*+(N-1)/2)) under H
0:
Constant correlation, H1: Dynamic correlation. p-values are shown in parentheses.
Fever symptom—New cases Cough symptom—New cases Dyspnea symptom—New cases
0.822 0.869 0.663
Turkey
(0.000) (0.000) (0.004)
0.637 0.609 0.665
Italy
(0.000) (0.000) (0.000)
0.892 0.793 0.616
Spain
(0.000) (0.000) (0.000)
0.551 0.611 0.467
France
(0.046) (0.000) (0.009)
0.728 0.891 0.856
UK
(0.001) (0.000) (0.000)
Table 4. DCC between symptoms and cases. p-values are shown in parentheses.
peoples’ web search reaction to pulmonary symptoms or the procurement of PCR test results and processing of
the test results in each country. Attention paid to higher risk symptoms such as dyspnea may indicate the need
for hospitalization, which is of distinct importance.
DCC analysis methods show that fever, cough, and dyspnea symptoms correlate well with new cases during
the first wave of the pandemic. However, by May 2020, many fluctuations in correlations begin to appear. We
suggest that these fluctuations can result for various reasons independent of the modelling used: symptoms may
become too well known, testing of non-symptomatic cases may have become more common, the definition of new
case reporting may have changed. New symptoms of interest related to COVID-19 may also have emerged, such
as loss of taste, backache, etc. Constant monitoring of the public interest in GT is very important to formulate
relevant search models. Yet, we suggest that the modeling approach will remain relevant.
One limitation of this study is the terms selected to carry out the searches. Local/colloquial use of terms was
not included, which may have affected the results by limiting the scope. The second limitation is in the selection
of the data sources. Though "Google" is the most used web-based search engine, the use of different search tools
like "Yahoo," "Msn," or "Yandex" may have led to more accurate assessments of public interest. New case reports
were based on the WHO database, and the case reporting protocols may have changed during the pandemic. The
Scientific Reports | (2021) 11:14387 | https://doi.org/10.1038/s41598-021-93836-y 6
Vol:.(1234567890)www.nature.com/scientificreports/
Figure 3. Correlations between fever symptom search and new cases.
third limitation is about lack of causal inference; it would be unwise to interpret our findings to indicate a direct
causal relationship between search interest and COVID-19 cases. Mass media coverage of the pandemic may
have shifted the GT results towards an increase in COVID-related searches. This increased general interest in the
media about COVID-19 during the studied time period may have created some level of spurious c orrelation10.
The 2020 COVID-19 pandemic is the largest global public health challenge of this century. Our findings
reveal that pulmonary symptom queries are crucial early signs for emerging epidemics. For example, dyspnea
search interest may signal potential hospitalization and the need for intensive care. Policymakers are advised to
pay attention to and utilize these search interests to plan preventive and/ or intervention strategies. Monitoring
search terms may also help understand the populace’s lay beliefs and worries, revealing the need for further
guidance. Our results may be of particular importance as we approach the vaccination period with an already
existing anti-vaccination movement in place.
Scientific Reports | (2021) 11:14387 | https://doi.org/10.1038/s41598-021-93836-y 7
Vol.:(0123456789)www.nature.com/scientificreports/
Figure 4. Correlations between cough symptom search and new cases.
Scientific Reports | (2021) 11:14387 | https://doi.org/10.1038/s41598-021-93836-y 8
Vol:.(1234567890)www.nature.com/scientificreports/
Figure 5. Correlations between dyspnea symptom search and new cases.
Data availability
The COVID-19 datasets are obtained from WHO Coronavirus Disease (COVID-19) Dashboard COVID (https://
covid1 9.w
ho.i nt/), and query dataset analyzed on the “Google Trends” page (https://t rends.g oogle.c om/t rends/),
respectively.
Received: 13 February 2021; Accepted: 29 June 2021
References
1. Zhu, N. et al. A novel coronavirus from patients with pneumonia in China. N Engl J Med. 382(8), 727–733 (2019).
2. Barbosa, M. T. et al. “Big Five” lung diseases in CoViD-19 pandemic—A Google Trends analysis. Pulmonology 27(1), 71–72 (2020).
3. WHO Coronavirus Disease (COVID-19) Dashboard. https://covid19.who.int/ (February 10, 2021)
4. Arshad, A. S. et al. Global interest in telehealth during COVID-19 pandemic: an analysis of Google Trends. Cureus. 12(9), e10487
(2020).
5. Coronavirus Search Trends. https://trends.google.com/trends/story/US_cu_4Rjdh3ABAABMHM_en (May 21, 2021).
6. Higgins, T. S. et al. Correlations of online search engine trends with Coronavirus Disease (COVID-19) incidence: Infodemiology
study. JMIR Public Health Surveill. 6(2), e19702 (2020).
7. Arora, V. S., Stuckler, D. & McKee, M. Tracking search engine queries for suicide in the United Kingdom, 2004–2013. Public Health
137, 147–153 (2016).
Scientific Reports | (2021) 11:14387 | https://doi.org/10.1038/s41598-021-93836-y 9
Vol.:(0123456789)www.nature.com/scientificreports/
8. Milinovich, G. J., Williams, G. M., Clements, A. C. & Hu, W. Internet-based surveillance systems for monitoring emerging infec-
tious diseases. Lancet Infect. Dis. 14(2), 160–168 (2013).
9. Cleaton, J. M., Viboud, C., Simonsen, L., Hurtado, A. M. & Chowell, G. Characterizing ebola transmission patterns based on
internet news reports. Clin. Infect. Dis. 62(1), 24–31 (2016).
10. Chowell, G. et al. Severe respiratory disease concurrent with the circulation of H1N1 influenza. N. Engl. J. Med. 361(7), 674–679
(2009).
11. Springer, S., Menzel, L. & Zieger, M. Google Trends provides a tool to monitor population concerns and information needs during
COVID-19 pandemic. Brain Behav. Immun. 87, 109–110 (2020).
12. Lippi, G., Mattiuzzi, C. & Cervellin, G. Google search volume predicts the emergence of COVID-19 outbreaks. Acta Biomed. 91(3),
e2020006 (2020).
13. Sulyok, M. et al. Google Trends Data and COVID-19 in Europe: correlations and model enhancement are European wide. Trans-
bound Emerg Dis. https://doi.org/10.1111/tbed.13887 (2020)
14. Cervellin, G., Comelli, I. & Lippi, G. Is Google Trends a reliable tool for digital epidemiology? Insights from different clinical
settings. Epidemiol. Glob. Health 7(3), 185–189 (2017).
15. Nuti, S. V. et al. The Use of Google Trends in Health Care Research: A Systematic Review. PLoS One. 9(10), (2014).
16. Arora, V. S., McKee, M. & Stuckler, D. Google Trends: Opportunities and limitations in health and health policy research. Health
Policy 123(3), 338–341 (2019).
17. Kardes, S. et al. Public interest in rheumatic diseases and rheumatologist in the United States during the COVID-19 pandemic:
evidence from Google Trends. Rheumatol. Int. 41(2), 329–334 (2021).
18. Sharma, M. & Sharma, S. The rising number of COVID-19 cases reflecting growing search trend and concern of people: A Google
Trend analysis of eight major countries. J. Med. Syst. 44(7), 117 (2020).
19. Kutlu, O. Analysis of dermatologic conditions in Turkey and Italy by using Google Trends analysis in the era of the COVID-19
pandemic. Dermatol Ther. e13949. https://doi.org/10.1111/dth.13949 (2020).
20. Rajan, A. et al. Association of search query interest in gastrointestinal symptoms with COVID-19 diagnosis in the United States:
Infodemiology study. JMIR Public Health Surveill. 6(3), e19354 (2020).
21. Lampos, V. et al. Tracking COVID-19 using online search. NPJ Digital Med. 4(1), 17 (2021).
22. Venkatesh, U. & Gandhi, P. A. Prediction of COVID-19 outbreaks using Google Trends in India: A retrospective analysis. Health
Inf. Res. 26(3), 175–184 (2020).
23. Effenberger, M. et al. Association of the COVID-19 pandemic with Internet Search Volumes: A Google Trends (TM) analysis. Int
J Infect Dis. 95, 192–197 (2020).
24. James, N., Menzies, M. & Radchenko, P. COVID-19 second wave mortality in Europe and the United States. Chaos 31(3), 031105
(2021).
25. Asseo, K., Fierro, F., Slavutsky, Y., Frasnelli, J. & Niv, M. Y. Tracking COVID-19 using taste and smell loss Google searches is not
a reliable strategy. Sci. Rep. 10(1), 20527 (2020).
26. Lindquist, M. A., Xu, Y., Nebel, M. B. & Caffo, B. S. Evaluating dynamic bivariate correlations in resting-state fMRI: A comparison
study and a new approach. Neuroimage 101, 531–546 (2014).
27. Gomes, P. & Taamouti, A. In search of the determinants of European asset market comovements. Int. Rev. Econ. Financ. 44, 103–117
(2016).
28. Jain, A. & Biswal, P. C. Does internet search interest for gold move the gold spot, stock and exchange rate markets? A study from
India . Resour. Policy 61, 501–507 (2019).
29. Huang, J., Tang, J. & Zhang, H. The effect of investors’ information search behaviors on rebar market return dynamics using high
frequency data. Resour. Policy. 66, 101611. https://doi.org/10.1016/j.resourpol.2020.101611 (2020).
30. Türkiye Bilimler Akademisi (Turkish Academy of Sciences). 17 Nisan 2020 (April 17, 2020). 1. Versiyon Covid-19 Pandemi
Değerlendirme Raporu, ISBN: 978-605-2249-43-7) (COVID-19 Pandemic Evaluation Report- First version, ISBN: 978-605-2249-
43-7). http://www.tuba.gov.tr/tr/yayinlar/suresiz-yayinlar/raporlar/1.-versiyon-covid-19-pandemi-degerlendirme-raporu) (May
29, 2021).
31. Data on country response measures to COVID-19. https://www.ecdc.europa.eu/en/publications-data/download-data-response-
measures-covid-19 (May 28, 2021).
32. Lu, T. & Reis, B. Internet search patterns reveal clinical course of COVID-19 disease progression and pandemic spread across 32
countries. NPJ Digit. Med. 4(1), 22 (2021).
33. Engle, R. Dynamic conditional correlation. J. Bus. Econ. Stat. 20(3), 339–350 (2002).
34. Tse, Y. K. & Tsui, A. K. C. A multivariate generalized autoregressive conditional heteroscedasticity model with time-varying cor-
relations. J. Bus. Econ. Stat. 20(3), 351–362 (2002).
35. Behboudi, M. & Farnoosh, R. Modified models and simulations for estimating dynamic functional connectivity in resting state
functional magnetic resonance imaging. Stat Med. 39(12), 1781–1800 (2020).
Acknowledgements
We thank Prof. Mary Lou O’Neil for their support in the preparation of this article.
Authors Contributions
H.C. has planned the study and co-wrote the manuscript, M.AU. has made substantial contributions to concep-
tion and design, data acquisition, literature search, and co-wrote the manuscript. A.C. performed the statistical
analyses and contributed to the discussion of the results; E.Y.N. has been involved in drafting the manuscript
and revising it critically for important intellectual content. A.C. co-wrote the manuscript and made a substantial
contribution to the discussion of the results.
Competing interests
The authors declare no competing interests.
Additional information
Correspondence and requests for materials should be addressed to H.C.
Reprints and permissions information is available at www.nature.com/reprints.
Publisher’s note Springer Nature remains neutral with regard to jurisdictional claims in published maps and
institutional affiliations.
Scientific Reports | (2021) 11:14387 | https://doi.org/10.1038/s41598-021-93836-y 10
Vol:.(1234567890)www.nature.com/scientificreports/
Open Access This article is licensed under a Creative Commons Attribution 4.0 International
License, which permits use, sharing, adaptation, distribution and reproduction in any medium or
format, as long as you give appropriate credit to the original author(s) and the source, provide a link to the
Creative Commons licence, and indicate if changes were made. The images or other third party material in this
article are included in the article’s Creative Commons licence, unless indicated otherwise in a credit line to the
material. If material is not included in the article’s Creative Commons licence and your intended use is not
permitted by statutory regulation or exceeds the permitted use, you will need to obtain permission directly from
the copyright holder. To view a copy of this licence, visit http://creativecommons.org/licenses/by/4.0/.
© The Author(s) 2021
Scientific Reports | (2021) 11:14387 | https://doi.org/10.1038/s41598-021-93836-y 11
Vol.:(0123456789)You can also read