Definition of simulation cases and model system for building a library of plumes - Maarten Krol & Bart van Stratum
←
→
Page content transcription
If your browser does not render page correctly, please read the page content below

Definition of simulation cases and
model system for building a library
of plumes
Maarten Krol & Bart van Stratum

coco2-project.eu
D4.1 Definition of simulation
cases and model system for
building a library of plumes

Dissemination Level:         Public

Author(s):                   Maarten Krol & Bart van Stratum
                             (WUR)
Date:                        07/07/2021
Version:                     1.0
Contractual Delivery Date:   30/06/2021
Work Package/ Task:          WP4/ T4.1
Document Owner:              WUR
Contributors:                EMPA/LSCE/DWD/TNO/DLR
Status:                      Final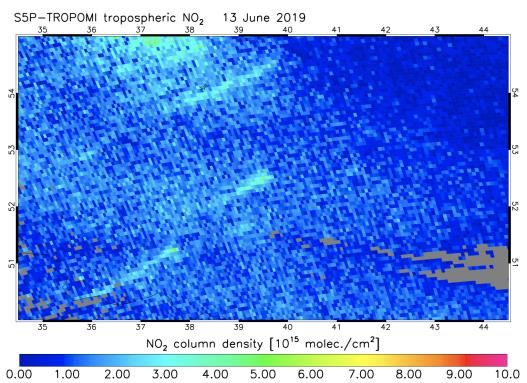
CoCO2: Prototype system for a
        Copernicus CO2 service
        Coordination and Support Action (CSA)
        H2020-IBA-SPACE-CHE2-2019 Copernicus evolution –
        Research activities in support of a European operational
        monitoring support capacity for fossil CO2 emissions

        Project Coordinator: Dr Richard Engelen (ECMWF)
        Project Start Date:  01/01/2021
        Project Duration:    36 months

        Published by the CoCO2 Consortium

        Contact:
        ECMWF, Shinfield Park, Reading, RG2 9AX,
        richard.engelen@ecmwf.int

The CoCO2 project has received funding from the European Union’s
Horizon 2020 research and innovation programme under grant
agreement No 958927.
CoCO2 2021

Table of Contents

1     Executive Summary............................................................................................................ 6
2     Introduction ......................................................................................................................... 6
    2.1     Background ................................................................................................................. 6
    2.2     Scope of this deliverable ............................................................................................. 7
      2.2.1        Objectives of this deliverables ............................................................................. 7
      2.2.2        Work performed in this deliverable ...................................................................... 7
      2.2.3        Deviations and counter measures ....................................................................... 7
3     Case Studies ...................................................................................................................... 7
    3.1     Overview...................................................................................................................... 7
    3.2     Details of the case studies .......................................................................................... 7
      3.2.1        General notes on the stack cases ....................................................................... 7
      3.2.2        Bełchatów (BEL) .................................................................................................. 8
      3.2.3        Jänschwalde (JAE) .............................................................................................. 8
      3.2.4        Lipetsk (LIP) ......................................................................................................... 9
      3.2.5        Matimba (MAT) .................................................................................................. 10
      3.2.6        Paris (PAR) ........................................................................................................ 10
      3.2.7        Randstad (NL) .................................................................................................... 11
      3.2.8        Berlin (BER) ....................................................................................................... 12
4     Model Systems ................................................................................................................. 13
    4.1     Details model systems .............................................................................................. 13
      4.1.1        COSMO-GHG .................................................................................................... 13
      4.1.2        WRF-CHEM ....................................................................................................... 13
      4.1.3        ICON-ART .......................................................................................................... 14
      4.1.4        LOTOS-EUROS ................................................................................................. 14
      4.1.5        WRF-GHG.......................................................................................................... 15
      4.1.6        DALES................................................................................................................ 15
      4.1.7        MicroHH ............................................................................................................. 16
5     Simulation protocol ........................................................................................................... 17
6     References ....................................................................................................................... 18

D4.1 Definition of simulation cases and model system for building a library of plumes                                                       4
CoCO2 2021
Figures
Figure 1: TROPOMI satellite images collected on June 13, 2019. Left: CO, right: NO 2. The
red dot denotes the location of the steel plant. .................................................................. 9
Figure 2: Distributions of the CO2 emissions in the region of Paris (Île-de-France) for a
typical weekday in November from the Suez-Origins inventory (complemented by the
ODIAC inventory for the Eastern and Southern borders of the area), together with the
location of seven CO2 high-precision measurement stations as well as the
administrative limits and partition of the region (the city of Paris is at the centre). The
core of the urban area roughly corresponds to the four administrative units at the core of
this region. ........................................................................................................................ 11
Figure 3: From Klausner et al. (2020): Flight paths of the DLR Cessna. ............................... 12
Figure 4: WRF-Chem configuration: coverage and spatial resolution of the different domains
.......................................................................................................................................... 14
Figure 5: Simulation of the XCO2 field in the Paris area at 1 km resolution (in domain D03 of
the WRF-Chem model). The white line delimits the signature of the emissions from the
core part of the urban area ............................................................................................... 14
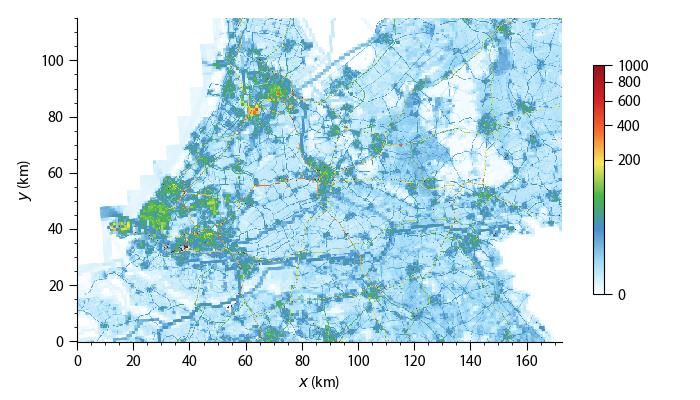
Figure 6: Example CO2 emissions (in kg CO2 / h) for the Randstad area, on 19-08-2017,
12:00 UTC ........................................................................................................................ 15
Tables
Table 1: List of case studies and simulation period .................................................................. 7
Table 2: Emission details Bełchatów case ................................................................................. 8
Table 3: Emission details Jänschwalde case ............................................................................ 9
Table 4: Emission details Lipetsk case ................................................................................... 10
Table 5: Emission details Matimba case. ................................................................................ 10
Table 6: Participating models .................................................................................................. 13
Table 7: Overview NetCDF dimensions .................................................................................. 17
Table 8: Overview NetCDF variables ...................................................................................... 17
D4.1 Definition of simulation cases and model system for building a library of plumes 5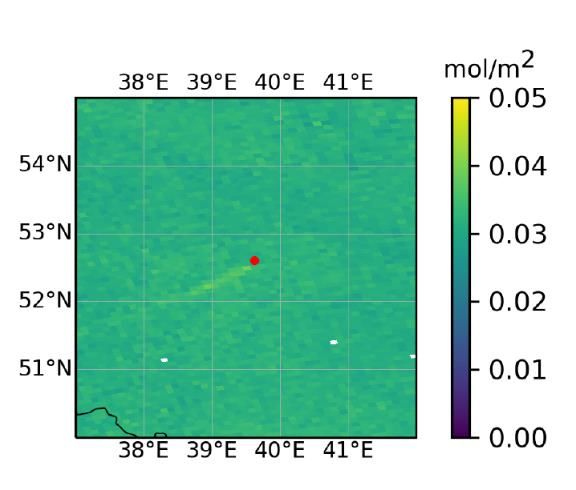
CoCO2 2021

1 Executive Summary
This document provides a description of detailed benchmark simulations. These simulations
are planned in support of the development and application of high-resolution atmospheric
transport and inversion systems. These systems cover limited geographical areas and
address scales from mesoscale weather phenomena to individual plumes as they are resolved
by CO2M. Specifically, we propose to simulate four stacks from large facilities in Europe,
Russia, and South Africa. Additionally, simulations are proposed for the cities of Berlin and
Paris, and the “Randstad” region in the Netherlands. For all these simulation cases, surface
and/or satellite observations are available to evaluate the simulations. Two simulation
protocols (Bełchatów and Jänschwalde power stations) closely follow the simulation protocol
previously used in the CoMet project. The Berlin case builds on a recent paper by Klausner et
al. (2020). Two other cases (Lipetsk in Russia, and Matimba in South Africa) focus on
detection of stack plumes from space (see e.g. Hakkarainen et al. (2021)). For the stack cases,
the effects of atmospheric chemistry (e.g. lifetime NOx) will be explicitely considered.
The document further provides brief descriptions of the simulation set-up and the participating
models.

2 Introduction
   2.1    Background
Monitoring emissions critically depends on addressing the local and national scales. The
analysis and developments in WP4 will rely on state-of-the-art transport models and inversion
approaches. However, these systems require improvements in their efficiency and robustness
to ensure that they can be applied operationally.
The future CO2M satellites will be able to identify the plumes of strong point sources and
clusters of sources (e.g. cities, industrial complexes) with a horizontal resolution of 2 km x 2
km. In order to use this information in atmospheric inversion systems, the underlying
atmospheric transport models should be able to resolve the plumes and reproduce their basic
properties. Currently, large uncertainties exist regarding the ability of atmospheric transport
models to describe individual observed plumes. Moreover, simulation results are sensitive to
different model settings such as resolution, boundary layer and advection schemes, and to
the representation of the source such as its temporal variability and injection height in the case
of stack emissions. Moreover, models that run on regional scale, are also sensitive to
meteorological forcing.
In order to test the current high-resolution transport models, this document proposes several
test cases that are relevant for emission verification. These cases are meant as benchmark
cases that are simulated by an ensemble of high-resolution models (10 m – 1 km). The
simulations will not only include CO2, but also co-emitted species like NO2 and CO, simulated
with full or simplified linear chemistry. Cases will be presented for which suitable validation
data (satellite, ground-based, (aircraft) campaigns) is available.
The case studies will be conducted in close connection with WP3, in which the global system
is developed. One option is to embed regional models in this global system to provide more
accurate regional estimates. Also, the use of satellite data to observe plumes through their
NO2 and/or CO atmospheric imprint will receive special attention. Current satellites like
TROPOMI observe emission plumes from space, and the use of this information to infer
information about CO2 emissions is deemed very important.

D4.1 Definition of simulation cases and model system for building a library of plumes           6
CoCO2 2021

   2.2     Scope of this deliverable
         2.2.1 Objectives of this deliverables
The main objective of this report is to document the case studies, the participating model
systems, and available observational datasets to evaluate the simulations.

         2.2.2 Work performed in this deliverable
This deliverable marks the start of the simulations, based on the cases defined in this report.
The work performed involved (1) collecting a list of proposed cases on existing and new efforts
in the community (2) preparing descriptions of the participating models (3) collecting
information about the cases and defining simulation periods based on the availability of
observational data. The work has been mostly performed by WUR, but with the help of the
participating modellers. Moreover, use was made of existing simulation protocols (e.g. the
CoMet project).

         2.2.3 Deviations and counter measures
None

3 Case Studies
   3.1     Overview
Table 1 provides an overview of the cases and the expected simulation period. These cases
were selected based on the availability of observations, and range from simulations of isolated
plumes to simulations of complex clusters of sources in urban areas.
                        Table 1: List of case studies and simulation period

 Case ID                  Description                              Time Period
 BEL                      Power plant Bełchatów, Poland            6 + 7 June 2018
 JAE                      Power plant Jänschwalde,                 22 + 23 May 2018
                          Germany
 LIP                      Steel plant Lipetsk, Russia              13 June 2019
 MAT                      Power plant Matimba, South               25 July 2020
                          Africa

 PAR                      Paris Urban Area, France                 Jan, Mar, Aug 2018
 NL                       Randstad area, Netherlands               21-02-2018 to 27-02-2018
                                                                   29-06-2018 to 05-07-2018
 BER                      Berlin urban area, Germany               18-27 July 2018

   3.2     Details of the case studies
         3.2.1 General notes on the stack cases
The setup for the Bełchatów and Jänschwalde power stations closely follows the CoMet
simulation protocol (Brunner, 2020), including the choice of the simulation periods. For all

D4.1 Definition of simulation cases and model system for building a library of plumes         7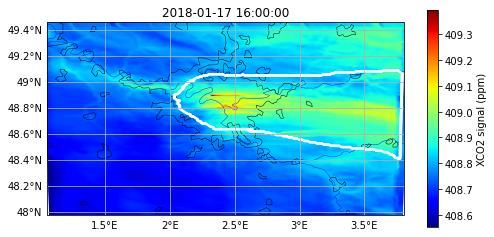
CoCO2 2021

sites, the emissions are provided for the individual stack locations (or in the case of
Jänschwalde; the location of groups of stacks), and a central location which is representative
for the entire plant. All participants should include a single CO2 tracer and emission for the
central location (“center”). Participants with high resolution models may optionally include a
second CO2 tracer which is emitted from the individual locations and include plume rise.
Models that simulate chemistry should also emit CO, NOx and hydrocarbons from the plume.
The proposed emission height and vertical extent has been calculated using a plume rise
model, using typical stack properties from Pregger & Friedrich (2009).
Models need initialization and boundary conditions. Boundary conditions from CAMS/IFS
(chemistry) and ERA5 (meteorology) will be provided for the test cases.

       3.2.2 Bełchatów (BEL)
The Bełchatów Power Station is a coal-fired power station near Bełchatów, in central Poland.
Emissions are released from two 299 m high stacks.
The emission details for the simulations are provided in Table 2. The CO2 emissions are based
on the CoMet protocol. For the chemistry simulations, the CO and NO x emissions are obtained
from the European Pollutant Release and Transfer Register (E-PRTR), based on data from
2018. Other hydrocarbon emission data can also be found there. The simulation period spans
from 06-06-2018 00:00 UTC to 08-06-2018 00:00 UTC.
Observations are available from the CoMet measurement campaign, which includes both
aircraft in-situ observations (including CO2, CO, NO2, and meteorological variables like
temperature, humidity, pressure, and wind speed), and remote sensing observations (CO 2,
XCO2). The observations, from three different aircraft, are available for 07-06-2018, between
12:20 UTC and 15:20 UTC. In addition, TROPOMI satellite observations will be used for
validation.
                              Table 2: Emission details Bełchatów case

                                                Emission      Emission CO       Emission
                          Coordinates
                                                  CO2                             NOx
                                                                (kg CO/s)
                       (longitude, latitude)
                                                (kg CO2/s)                     (kg NO2/s)
                           19.3261°E,
             Center                              1217.7         0.8334           0.9538
                           51.2660°N
                           19.3285°E,
              East1                               608.8         0.4167           0.4769
                           51.2660°N
                           19.3237°E,
             West1                                608.8         0.4167           0.4769
                           51.2660°N
        1
            High-resolution models can emit an extra tracer at exact locations

       3.2.3 Jänschwalde (JAE)
The Jänschwalde Power Station is a coal-fired power station near Cottbus, close to the
German-Polish border. The Jänschwalde power station has 9 cooling towers (120 m high) in
groups of three, of which only two towers per group are active. Following the CoMet simulation
protocol, each group is treated as a single source location.
The emission details are provided in Table 3. The CO2 emissions are based on the CoMet
protocol. For chemistry simulations, the CO and NOx emissions are obtained from the E-

D4.1 Definition of simulation cases and model system for building a library of plumes       8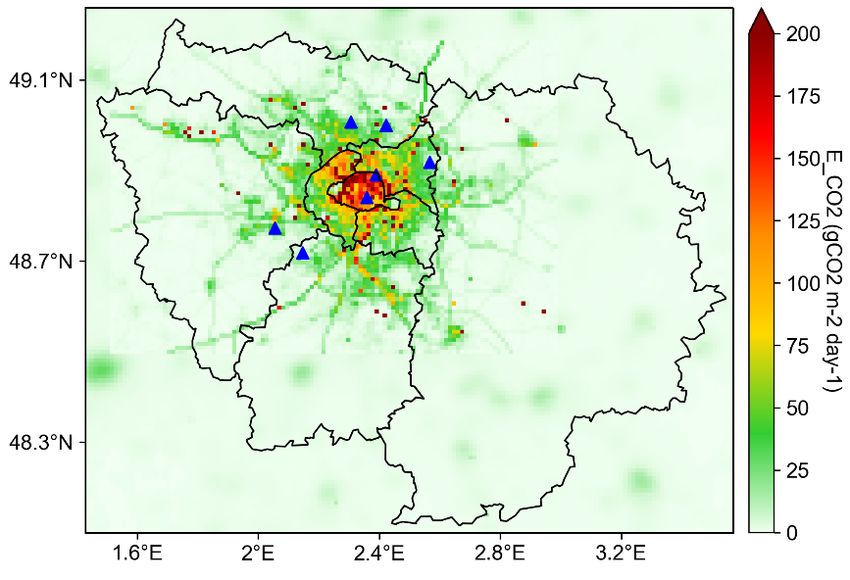
CoCO2 2021

PRTR, based on data from 2017. The simulation period spans from 22-05-2018 00:00 UTC to
24-05-2018 00:00 UTC.
Observations are available from the CoMet measurement campaign, similar to the
observations from the Bełchatów case, only excluding CO and NO 2 observations. The
observations are available for 23-05-2018, between 06:29 and 11:34 UTC. In addition,
TROPOMI satellite observations will be used for validation.
                              Table 3: Emission details Jänschwalde case

                                                   Emission     Emission CO     Emission
                             Coordinates
                                                     CO2                          NOx
                                                                 (kg CO/s)
                         (longitude, latitude)
                                                   (kg CO2/s)                  (kg NO2/s)
                              14.4580°E,
               Center                                732.5        0.3422         0.6021
                              51.8361°N
                              14.4622°E,
                East1                                244.2        0.1141         0.2007
                              51.8360°N
                              14.4580°E,
               Center1                               244.2        0.1141         0.2007
                              51.8361°N
                              14.4538°E,
                West1                                244.2        0.1141         0.2007
                              51.8362°N
          1
              Optional for a second CO2 scalar

          3.2.4 Lipetsk (LIP)
This steel plant is owned by NLMK Group. They claim to be the largest steelmaker in Russia
and one of the most efficient in the world. This case was provided by Manu Goudar
Vishwanathappa from SRON, who detected a CO plume from TROPOMI (June 13, 2019).
The plume is also visible in TROPOMI NO2 (see Figure 1).

                                                                      0

          Figure 1: TROPOMI satellite images collected on June 13, 2019. Left: CO, right: NO2. The
          red dot denotes the location of the steel plant.

The emission details are provided in Table 4. The emissions are obtained from the 2019
annual report of the NLMK group1. The simulation period spans from 13-06-2019 00:00 UTC
to 14-06-2019 00:00 UTC.

1
    https://nlmk.com/en/ir/reporting-center/annual-reports/

D4.1 Definition of simulation cases and model system for building a library of plumes           9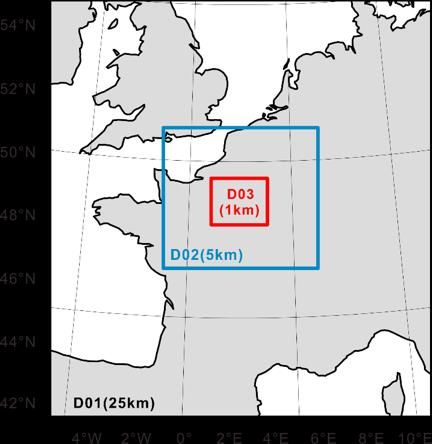
CoCO2 2021

                                Table 4: Emission details Lipetsk case

                                                 Emission     Emission CO       Emission
                             Coordinates
                                                   CO2                            NOx
                                                                (kg CO/s)
                         (longitude, latitude)
                                                 (kg CO2/s)                    (kg NO2/s)
                              39.6196°E,
               Center                             1014.0        7.4562           0.8302
                              52.5603°N

         3.2.5 Matimba (MAT)
The Matimba power station is a dry cooled, coal-fired power plant in the north-east of South
Africa, approximately 300 km north of Johannesburg. The power plant has two 250 m high
stacks. This case is based on Hakkarainen et al. (2021). Emissions and location are given in
Table 5.
The emissions for the simulations are based on reported CO 2, CO, and NOx emissions2,
averaged the entire year 2018. The simulation period spans from 25-07-2020 00:00 UTC to
26-07-2020 00:00 UTC.
CO2 observations are available from OCO-2, NO2 observations from TROPOMI (Hakkarainen
et al., 2021).
                                Table 5: Emission details Matimba case.

                                                 Emission     Emission CO       Emission
                             Coordinates
                                                   CO2                            NOx
                                                                (kg CO/s)
                         (longitude, latitude)
                                                 (kg CO2/s)                    (kg NO2/s)
                              27.6109°E,
               Center                              954.2        0.3567           2.4920
                              23.6688°S
                              27.6106°E,
                North1                             477.1        0.1784           1.2460
                              23.6676°S
                              27.6112°E,
               South1                              477.1        0.1784           1.2460
                              23.6699°S
          1
              Optional for a second CO2 scalar

         3.2.6 Paris (PAR)
The Paris urban area, centred on the city of Paris, is a dense urban area. It is the fourth in
Europe in terms of population, with nearly 6 million inhabitants in its core part gathering the
city of Paris and the "petit couronne" and ~10 million inhabitants in total (numbers can vary
significantly depending on the definition given to the different areas). Annual CO 2 Emissions
from the core part of the urban area exceed 20 MtCO2.yr-1. Its distance from other major CO2
sources, and the relatively flat topography around this area in addition to its high level of
emissions concentrated over a relatively small surface makes it a prominently favourable test
case for plume modelling and inversions. LSCE has been setting CO2 atmospheric in situ
measurement and inverse modelling frameworks to monitor the emissions from this urban

2
    https://www.eskom.co.za/Whatweredoing/AirQuality/Pages/Matimba-Power-Station.aspx

D4.1 Definition of simulation cases and model system for building a library of plumes       10
CoCO2 2021
area since 2010. Estimates of the Paris CO 2 emissions from these frameworks have been
documented in Bréon et al. (2015) and Staufer et al. (2016).
LSCE and the company Suez-Origins currently collaborate for such an activity with the
maintenance of 7 stations with in situ high precision CO2 and CO sensors around and within
the core area, the deployment of lower cost CO 2 sensors across this area, and routine CO2
simulations and inversions based on the WRF-Chem modelling configuration of Lian et al.
(2019) and Lian et al. (2020) (see 4.1.2), on an update of the inverse modelling frameworks
of the series of studies Bréon et al. (2015), Staufer et al. (2016) and Wu et al. (2016) and a 1-
km resolution inventory compiled by Suez-Origins. This activity will be supported by the PAUL
Horizon 2020 Green Deal project. The observation network is complemented by a TCCON
site within Paris3 . Clear images of the NO2 plume from Paris have been provided by TROPOMI
(Lorente et al., 2019).
Figure 2: Distributions of the CO2 emissions in the region of Paris (Île-de-France) for a typical
weekday in November from the Suez-Origins inventory (complemented by the ODIAC inventory
for the Eastern and Southern borders of the area), together with the location of seven CO 2 high-
precision measurement stations as well as the administrative limits and partition of the region
(the city of Paris is at the centre). The core of the urban area roughly corresponds to the four
administrative units at the core of this region.
Simulations for this megacity will focus on few days in January and March 2018, including two
time-windows when TROPOMI measured NO2 with a zooming mode (at 2.4 x 1.8 km2
resolution) during the first week of March, and in August 2018 (to have simulations both in
winter and summer).
The location of the CO2 / CO stations that will be used for the validation is provided together
with a map of the CO2 emissions in the Paris area (based on the Suez Origin inventory) in
Figure 2. The Paris TCCON site is co-located with one of the two stations within the city of
Paris (the southern one). The NO2 images from TROPOMI will be used to assess the position,
extent and shape of the XCO2 plume simulations. The data from the dense regional air quality
network and the NO2 concentrations from TROPOMI as such could also be considered in the
course of the project if simulations of pollutants are conducted.
3.2.7 Randstad (NL)
The Randstad is a conurbation in the western part of the Netherlands, which includes the four
largest Dutch cities: Amsterdam, Rotterdam, The Hague, and Utrecht. The area houses
roughly half of the Dutch population. In addition to the Schiphol and Rotterdam The Hague
airports, the Randstad contains the Port of Rotterdam, which is the largest seaport in Europe.
3
https://tccon-wiki.caltech.edu/Main/Paris
D4.1 Definition of simulation cases and model system for building a library of plumes 11CoCO2 2021
Both Schiphol airport and the Port of Rotterdam are areas with some of the highest CO 2
emissions in the Netherlands.
The simulations over the Randstad will focus on two one-week periods: one during the
summer (29-06-2018 00:00 UTC to 06-07-2018 00:00 UTC) and winter (21-02-2018 00:00
UTC to 28-02-2018 00:00 UTC). The simulations will be performed with both LOTOS-EUROS
and DALES. More information on the model setup and e.g. emission inventories is provided
in Section 4.1.6.
For the validation, CO2 observations are available at several locations:
• Cabauw (KNMI, ICOS, 51.97N, 4.93E): CO 2 concentrations and fluxes along a 213m
tall tower.
• Loobos (WUR, ICOS, 52.17N, 5.74E): CO2 concentrations and fluxes along the 24 m
tall tower.
• Veenkampen (WUR, 51.98N, 5.62E): Near surface CO2 concentrations and fluxes.
Other air quality observations are available from the National Institute for Public Health and
the Environment (RIVM), which contains (among others) observations of CO, NO, NO 2, and
O3 at approximately 40 locations in the Randstad.
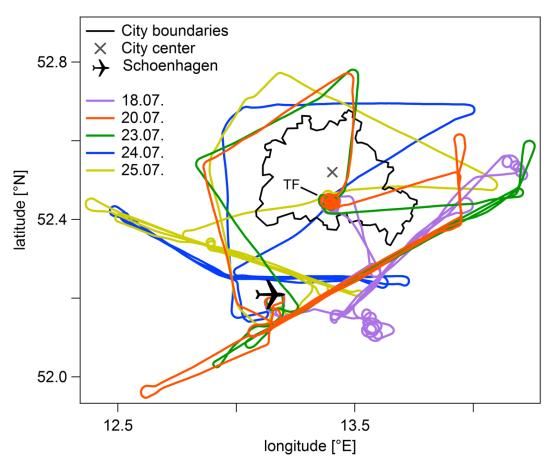
3.2.8 Berlin (BER)
This study case will be based on Klausner et al. (2020). The time period for which aircraft
observations of greenhouse gas concentrations & reactive gases (NO 2, O3, CO) are available
(18-27 July 2018) as indicated in Figure 3. Additionally, TROPOMI satellite observations will
be used to validate the models.
Figure 3: From Klausner et al. (2020): Flight paths of the DLR Cessna.
D4.1 Definition of simulation cases and model system for building a library of plumes 12CoCO2 2021
4 Model Systems
In total, 7 different models will participate in the simulations of the 7 different cases, as
summarized in Table 6.
Table 6: Participating models
BEL JAE LIP MAT PAR NL BER
COSMO-GHG O O O O O
WRF-CHEM O
ICON-ART O
LOTOS-EUROS O O O O
WRF-GHG
DALES O
MicroHH O O O O
4.1 Details model systems
4.1.1 COSMO-GHG
The COSMO model for non-hydrostatic limited area modelling was developed within the
context of the Consortium for Small-Scale Modelling, a consortium of seven European national
weather services. COSMO‐GHG is an extension of COSMO with modules for the passive
transport of greenhouse gas (GHG; Liu et al., 2017), built on top of the tracer module for
COSMO (Roches and Fuhrer, 2012). COSMO‐GHG includes additional routines for simulating
a set of tracers which are not only passively transported but also experience the influence of
three-dimensional emissions or surface fluxes read in from external datasets (Liu et al., 2017).
For the simulations carried out in CoCO2, the GPU-accelerated version of COSMO 5.09
(COSMO 6, if available) will be applied on a 1x1 km2 grid.
COSMO can be obtained freely for research purposes, after accepting the license at
https://www.cosmo-model.org/content/consortium/licencing.htm. For access to COSMO-
GHG, Empa may be contacted.
4.1.2 WRF-CHEM
WRF-Chem (Grell et al. 2005) is a widely used regional scale meteorological-chemistry
transport coupled model. The WRF-Chem V3.9.1 simulations of the CO2 plume from Paris
are conducted in collaboration between LSCE and Suez-Origins. The configuration of the
model for these simulations is that documented and evaluated in Lian et al. (2018), Lian et al.
(2019) and Lian et al. (2020), retaining the reference parameterization of Lian et al. (2020).
This configuration is based on 3 nested domains (see Figure 4) whose respective horizontal
resolution is 25, 5 and 1 km. The innermost domain covers the whole Paris urban area.
D4.1 Definition of simulation cases and model system for building a library of plumes 13CoCO2 2021
Domain Number of grid cell (lon * Coordinates (lon * lat)
lat)
D01 55 * 60 -7.76°W~12.76°E,
41.69~55.01°N
D02 111 * 101 -1.39°W~6.39°E,
46.55 ~51.06°N
D03 201 * 166 1.05 °E~3.81°E,
(innermost)
47.98~49.46°N
Figure 4: WRF-Chem configuration: coverage and spatial resolution of the different
domains
WRF-Chem is fed with the 1-km resolution Suez Origins inventory of the CO 2 anthropogenic
emissions of the Paris urban area complemented by the ODIAC global inventory for the year
2018 (version ODIAC2020; Oda and Maksyutov, 2011) at 1 km resolution for the emissions
outside this area. The WRF-Chem configuration used here includes the VPRM model
(Ahmadov et al., 2007) for the computation of the CO2 land ecosystem fluxes. At the boundary
of the outermost domain, the simulation is forced with the CO2 fields from the CAMS analysis
(version v18r1, Chevallier, 20184). The simulations keep track of the specific signature of part
of these fluxes (like that of biogenic and anthropogenic fluxes in each domain) along with the
variations of the full 3D-field of total CO2. In particular it tracks that of the emissions from the
core of the urban area, which should correspond to the plume from the Paris area as it can be
seen in XCO2 spaceborne images (see Figure 5).
Figure 5: Simulation of the XCO2 field in the Paris area at 1 km resolution (in domain
D03 of the WRF-Chem model). The white line delimits the signature of the emissions
from the core part of the urban area
4.1.3 ICON-ART
ICON-ART (Aerosol and Reactive Trace gases) is an extension of ICON (ICOsahedral
Nonhydrostatic model), developed to enable simulations of gases, aerosol particles and
related feedbacks in the atmosphere (Rieger et al., 2015).
4.1.4 LOTOS-EUROS
LOTOS-EUROS is an offline regional-scale Eulerian chemistry-transport model that is used to
simulate concentrations of trace gasses and aerosols in the boundary layer and free
troposphere (Manders et al., 2017). The model domain is typically covering Europe at scales
of 10-20 km, or a selected region with resolutions up to 1-2 km. Meteorological input is by
default obtained from ECMWF, but could also be obtained from other sources. In the vertical,
the model covers the troposphere using typically 12 layers that are formed as a coarsening of
the meteorological input. Gas-phase chemistry is a described using a carbon bond
mechanism. Formation of secondary inorganic aerosol is described using ISORROPIA-II.
4
https://apps.ecmwf.int/datasets/data/cams-ghg-inversions
D4.1 Definition of simulation cases and model system for building a library of plumes 14CoCO2 2021
Anthropogenic emissions are taken from an inventory, but emissions from sea salt, mineral
dust and biogenic volatile organic compounds (VOC) are calculated online.
In this project, the model will use meteorological data from COSMO-GHG when possible, and
in this case the horizontal grid will also be taken from this model; otherwise, ECMWF data will
be used. The simulations will provide concentrations of trace gases and aerosol, as well as
selected chemical productions and loss rates; these could then be used by models with a
limited number of tracers to parameterize production and loss. Optical properties of the
aerosols will also be put out to facilitate simulation of synthetic satellite observations.
4.1.5 WRF-GHG
WRF-GHG is an extension of the Weather Research and Forecast (WRF) model, developed
to study the transport of greenhouse gases as passive tracers (Beck et al., 2011).
4.1.6 DALES
The Dutch Atmospheric Large Eddy Simulation model (DALES, Heus et al., 2010) is a large-
eddy simulation code, developed by a consortium of Dutch universities. In the Ruisdael
Observatory project, DALES is currently being extended so that it is suitable for running
realistic LES on domains of ~100-200 km at 100 m resolution.
For the experiments over the Randstad, time varying CO 2 emissions from the Dutch emission
registry will be used. These emissions are available at a 1 x 1 km 2 resolution and have been
postprocessed to a 100 x 100 m2 resolution using high resolution human activity data. An
example is shown in Figure 6. In addition, point source emissions (including the relevant
variables required to calculate plume rise) are available for the largest industrial facilities.
Combined with the CHTESSEL based land surface model, which includes the A-Gs scheme
to account for the vegetation assimilation and soil respiration of CO 2, it is possible to study
both the anthropogenic sources and biogenic sources and sinks of CO 2. The model output will
include the background, anthropogenic, and total CO2 concentrations.
The model domain is equal to the area shown in Figure 6, and consists of 1728 x 1152 grid
points in the horizontal, which – with a horizontal grid spacing of 100 m – results in a domain
of 172.8 x 115.2 km2.
DALES is open-source software, available at: https://github.com/dalesteam/dales
Figure 6: Example CO2 emissions (in kg CO2 / h) for the Randstad area, on 19-08-2017,
12:00 UTC
D4.1 Definition of simulation cases and model system for building a library of plumes 15CoCO2 2021
4.1.7 MicroHH
MicroHH is a direct numerical simulation (DNS) and large eddy simulation (LES) model,
capable of running on both CPUs and GPUs, coded in C++/CUDA-C (Van Heerwaarden et
al., 2017). The current version includes a basic emission module, which allows for stationary
or moving, constant and/or time varying point or line sources for scalars. In addition, simplified
chemistry can be added using the Kinetic Pre-Processor Software package. Within COCO2
we will streamline the chemistry with WP3 such that MicroHH can use boundary conditions
from the IFS system, and “adds” an isolated plume. Focus will be on:
• Turbulent dispersion of plumes, depending on wind and atmospheric stability
• Chemical decay of NOx in the plume, depending on large-scale fields of e.g. ozone
• Possible effects of plume rise
MicroHH is open-source software, available at https://github.com/microhh/microhh and
www.microhh.org
D4.1 Definition of simulation cases and model system for building a library of plumes 16CoCO2 2021
5 Simulation protocol
As outlined in the CoCO2 Data Management Plan, all model output will be made available in
NetCDF-4 format, compliant with CF conventions. To simplify the comparison of different
models, the NetCDF files should (as a minimum) include the variables and follow the
conventions summarized in Table 7 and Table 8. Output frequency should be minimal 15
minutes.
Table 7: Overview NetCDF dimensions
Name Description
longitude Number of grid points in zonal direction
latitude Number of grid points in meridional direction
level Number of full (cell center) vertical levels
levelh Number of half (cell edge) vertical levels
time Number of time steps
Table 8: Overview NetCDF variables
Variable Description Units Dimensions
time Time UTC time
longitude Zonal location degrees latitude, longitude
latitude Meridional location degrees latitude, longitude
p Air pressure at cell center Pa time, level, latitude, longitude
z Height above surface at cell center m time, level, latitude, longitude
ph Air pressure at cell edge Pa time, levelh, latitude, longitude
zh Height above surface at cell edge m time, levelh, latitude, longitude
ta Air temperature K time, level, latitude, longitude
hus Specific humidity kg kg-1 time, level, latitude, longitude
ua Eastward wind m s-1 time, level, latitude, longitude
va Northward wind m s-1 time, level, latitude, longitude
wa Vertical velocity m s-1 time, level, latitude, longitude
co2 -1 time, level, latitude, longitude
CO2 dry air mole fraction mol mol
ps Surface pressure Pa time, latitude, longitude
zsurf Surface elevation m time, latitude, longitude
tracer -1 time, level, latitude, longitude
Chemical tracer mole fraction mol mol
D4.1 Definition of simulation cases and model system for building a library of plumes 17CoCO2 2021
6 References
Ahmadov, R., Gerbig, C., Kretschmer, R., Koerner, S., Neininger, B., Dolman, A. J., and Sarrat, C.:
Mesoscale covariance of transport and CO2 fluxes: Evidence from observations and simulations
using the WRF-VPRM coupled atmosphere-biosphere model. Journal of Geophysical Research:
Atmospheres, 112(D22), 2007.
Beck, V., T. Koch, R. Kretschmer, J. Marshall, R. Ahmadov, C. Gerbig, D. Pillai, and M. Heimann,
(2011): The WRF Greenhouse Gas Model (WRF-GHG). Technical Report No. 25, Max Planck
Institute for Biogeochemistry, Jena, Germany.
Bréon, F. M., Broquet, G., Puygrenier, V., Chevallier, F., Xueref-Remy, I., Ramonet, M., Dieudonné,
E., Lopez, M., Schmidt, M., Perrussel, O., and Ciais, P.: An attempt at estimating Paris area
CO2 emissions from atmospheric concentration measurements. Atmospheric Chemistry and
Physics, 15(4): 1707-1724, 2015.
Brunner, D. (2020). Protocol for CoMet Power Plant Plume Simulations.
Chevallier, F.: Validation report for the inverted CO2 fluxes, v18r1 - version 1.0.
https://atmosphere.copernicus.eu/sites/default/files/2019-01/CAMS73_2018SC1_D73.1.4.1-
2017-v0_201812_v1_final.pdf, 2018.
Grell, G. A., Grell, G. A., Peckham, S. E., Peckham, S. E., Schmitz, R., Schmitz, R., McKeen, S. A.,
McKeen, S. A., Frost, G., Frost, G., Skamarock, W. C., Skamarock, W. C., Eder, B., & Eder, B.
(2005). Fully coupled online chemistry within the WRF model. Atmospheric Environment, 39(37),
6957–6975. https://doi.org/10.1016/j.atmosenv.2005.04.027
Hakkarainen, J., Szeląg, M. E., Ialongo, I., Retscher, C., Oda, T., & Crisp, D. (2021). Analyzing
nitrogen oxides to carbon dioxide emission ratios from space: A case study of Matimba Power
Station in South Africa. Atmospheric Environment: X, 10, 100110.
https://doi.org/10.1016/j.aeaoa.2021.100110
Heus, T., Van Heerwaarden, C. C., Jonker, H. J. J., Pier Siebesma, A., Axelsen, S., Van Den Dries,
K., Geoffroy, O., Moene, A. F., Pino, D., De Roode, S. R., & De Arellano, J. V. G. (2010).
Formulation of the Dutch Atmospheric Large-Eddy Simulation (DALES) and overview of its
applications. Geoscientific Model Development, 3(2), 415–444. https://doi.org/10.5194/gmd-3-
415-2010
Klausner, T., Mertens, M., Huntrieser, H., Galkowski, M., Kuhlmann, G., Baumann, R., Fiehn, A.,
Jöckel, P., Pühl, M., & Roiger, A. (2020). Urban greenhouse gas emissions from the Berlin area:
A case study using airborne CO2 and CH4 in situ observations in summer 2018. Elementa, 8(1).
https://doi.org/10.1525/ELEMENTA.411
Lian, J., Wu, L., Bréon, F. M., Broquet, G., Vautard, R., Zaccheo, T. S., Dobler, J., and Ciais, P.:
Evaluation of the WRF-UCM mesoscale model and ECMWF global operational forecasts over
the Paris region in the prospect of tracer atmospheric transport modeling. Elem Sci Anth, 6:64,
2018.
Lian, J., Bréon, F. M., Broquet, G., Zaccheo, T. S., Dobler, J., Ramonet, M., Staufer, J., Santaren, D.,
Xueref-Remy, I., and Ciais, P.: Analysis of temporal and spatial variability of atmospheric CO2
concentration within Paris from the GreenLITE™ laser imaging experiment. Atmospheric
Chemistry and Physics, 19, 13809-13825, 2019.
Lian, J., Bréon, F.M., Broquet, G., Zheng, B., Ramonet, M., and Ciais, P.: Quantitative evaluation of
the uncertainty sources for the modeling of atmospheric CO2 concentration within and in the
vicinity of Paris city, Atmos. Chem. Phys. Discuss., accepted, 2020.
Liu, Y., Gruber, N., & Brunner, D. (2017). Spatiotemporal patterns of the fossil-fuel CO2 signal in
central Europe: results from a high-resolution atmospheric transport model. Atmospheric
Chemistry and Physics, 17(22), 14145-14169. https://doi.org/10.5194/acp-17-14145-2017
Lorente, A., Boersma, K.F., Eskes, H.J. et al. Quantification of nitrogen oxides emissions from build-
up of pollution over Paris with TROPOMI. Sci Rep 9, 20033 (2019).
https://doi.org/10.1038/s41598-019-56428-5
Manders, A. M. M., Builtjes, P. J. H., Curier, L., Denier van der Gon, H. A. C., Hendriks, C., Jonkers,
D4.1 Definition of simulation cases and model system for building a library of plumes 18CoCO2 2021
S., Kranenburg, R., Kuenen, J. J. P., Segers, A. J., Timmermans, R. M. A., Visschedijk, A. J. H.,
Wichink Kruit, R. J., van Pul, W. A. J., Sauter, F. J., van der Swaluw, E., Swart, D. P. J., Douros,
J., Eskes, H., van Meijgaard, E., van Ulft, B., van Velthoven, P., Banzhaf, S., Mues, A. C., Stern,
R., Fu, G., Lu, S., Heemink, A., van Velzen, N., and Schaap, M.: Curriculum vitae of the
LOTOS–EUROS (v2.0) chemistry transport model, Geosci. Model Dev., 10, 4145-4173, 2017.
https://doi.org/10.5194/gmd-10-4145-2017
Oda, T. and Maksyutov, S.: A very high-resolution (1 km × 1 km) global fossil fuel CO2 emission
inventory derived using a point source database and satellite observations of nighttime lights,
Atmos. Chem. Phys., 11, 543-556, 2011.
Pregger, T., & Friedrich, R. (2009). Effective pollutant emission heights for atmospheric transport
modelling based on real-world information. Environmental Pollution, 157(2), 552–560.
https://doi.org/10.1016/j.envpol.2008.09.027
Rieger, D., Bangert, M., Bischoff-Gauss, I., Förstner, J., Lundgren, K., Reinert, D., ... & Vogel, B.
(2015). ICON–ART 1.0–a new online-coupled model system from the global to regional
scale. Geoscientific Model Development, 8(6), 1659-1676.
Roches, A. and Fuhrer, O.: Tracer module in the COSMO model, COSMO Technical Report, available
online at http://cosmo-model.org, 2012. https://doi.org/10.5676/DWD_pub/nwv/cosmo-tr_20
Staufer, J., Broquet, G., Bréon, F. M., Puygrenier, V., Chevallier, F., Xueref-Rémy, I., Dieudonné, E.,
Lopez, M., Schmidt, M., Ramonet, M., Perrussel, O., Lac, C., Wu, L., and Ciais, P.: The first 1-
year-long estimate of the Paris region fossil fuel CO2 emissions based on atmospheric
inversion. Atmospheric Chemistry and Physics, 16(22): 14703-14726, 2016.
Van Heerwaarden, C. C., Van Stratum, B. J. H., Heus, T., Gibbs, J. A., Fedorovich, E., & Mellado, J.
P. (2017). MicroHH 1.0: A computational fluid dynamics code for direct numerical simulation and
large-eddy simulation of atmospheric boundary layer flows. Geoscientific Model Development,
10(8), 3145–3165. https://doi.org/10.5194/gmd-10-3145-2017
Wu, L., Broquet, G., Ciais, P., Bellassen, V., Vogel, F., Chevallier, F., Xueref-Remy, I., and Wang, Y.:
What would dense atmospheric observation networks bring to the quantification of city CO2
emissions?, Atmospheric Chemistry and Physics, 16(12): 7743-7771, 2016.
D4.1 Definition of simulation cases and model system for building a library of plumes 19CoCO2 2021
Document History
Version Author(s) Date Changes
0.1 Maarten Krol & Bart van 24/06/2021 initial version
Stratum (Wageningen
University)
1.0 Maarten Krol & Bart van 07/07/2021 Included feedback
Stratum (Wageningen from 2 reviewers.
University)
Internal Review History
Internal Reviewers Date Comments
Pierre Vanderbecken (ENPC) dd/mm/yyyy
Jonilda Kushta (CyI) 07/07/2021 Approved with comments
Estimated Effort Contribution per Partner
Partner Effort
WUR 1
Total 1
This publication reflects the views only of the author, and the Commission cannot be held responsible for any use
which may be made of the information contained therein.
D4.1 Definition of simulation cases and model system for building a library of plumes 20You can also read