Why using ESG helps you build better portfolios
←
→
Page content transcription
If your browser does not render page correctly, please read the page content below

ETF insights | Measuring ETF impact on financial markets

  ETF
  RESEARCH
  INSIGHTS

Why using ESG
helps you build better
portfolios

This document is for the exclusive use of
investors acting on their own account and
categorised either as “eligible counterparties”
or “professional clients” within the meaning
of markets in financial instruments directive
2014/65/EU

July 2019

Welcome

Marlene Hassine Konqui                      Francois Millet      Serge Darolles
Head of ETF Research                        Head of Strategy,    Professor of Finance
                                            ESG and Innovation   Paris Dauphine University

Why using ESG helps you build better portfolios        3

Q1: What’s driving the rise in interest in ESG?        4

Q2: How much demand is there for active
or passive ESG funds?                                  6

Q3: Do ESG investors have to compromise
on performance?                                        8

Conclusion
what are the key takeaways for investors?             11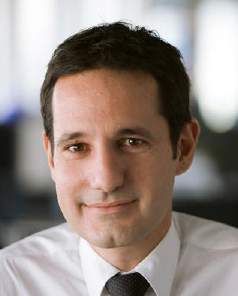
ETF RESEARCH INSIGHTS | Why using ESG helps you build better portfolios

Why using ESG
helps you build better
portfolios
Increasingly, investors are integrating ESG considerations into their portfolios. However, there’s
still a widespread belief that investing sustainably means giving up on potential returns. In this
paper, we focus on the role of ESG in portfolio construction and whether adding an exposure to
ESG can be as good for a portfolio as it is for the world around us.

In this paper, we examine the following key topics.

Q1: DRIVERS - What is driving the rise in interest in ESG? How robust is the quality of
publicly available ESG-related information and what are the trends in this area? Does it make
sense to invest in ESG using a passive approach? Could the rising interest in ESG have an
impact on the composition of benchmarks in the future?

Q2: DEMAND - How much demand is there for active or passive ESG funds? What do ETF
flows tell us about ESG demand?

Q3: PERFORMANCE - Does an investment in ESG degrade a portfolio’s performance?
What kind of biases does a positive ESG screening strategy introduce? Are there factors that
work better than others?

To answer those questions, we use Lyxor expertise and highlight the findings of a recent
academic study sponsored by the Lyxor Dauphine Research Academy and arrive at the following
conclusions:

An ESG focus does not have to mean compromising on performance

 	Development of ESG is driven both by bottom-up pressure from asset owners and by
   top-down policy initiatives. More and more investors are now focused on maximising
   ESG performance subject to risk-return constraints, arguably inverting the traditional
   investment paradigm of prioritising risk-adjusted returns.

 	Cash flows into ESG funds are accelerating, both for active and passive funds. Passive
   vehicles, with their strong focus on cost, transparency and a data-driven approach,
   are entirely consistent with a focus on ESG goals.

 	ESG investors do not have to compromise on performance. A positive screening
   strategy based on ESG scores can raise the ESG profile of both passive and active
   portfolios, without reducing risk-adjusted returns.

This is the third in a series of papers from the Lyxor Dauphine Research Academy on the evolution
of the asset management industry. In the first paper, published in 2017, we looked at the impact
of ETF on the underlying market. In the second paper, published in 2018, we investigated on the
role passive funds have left for active funds.

                                                                   3
ETF RESEARCH INSIGHTS | Why using ESG helps you build better portfolios
Q1: What’s driving the rise
in interest in ESG?
Investors see socially responsible investment based on ESG criteria as a way to manage risks
better and to generate more sustainable long-term returns.
Financial crises and individual company controversies have shown how harmful it can be
to focus on the short term and to neglect shareholder stewardship and the screening
of companies based on their governance, environmental and social practices.
Most investors acknowledge that the devastating effect of climate change or the political
and social risks resulting from increased levels of inequality are major threats to society and,
ultimately, to financial stability. They understand that supporting the low carbon transition or
enabling more sustainable societies is a condition to continue delivering long-term returns
for the benefit of all stakeholders.
Investors are additionally being pushed by regulators, such as those in the European Union, who
integrate the management and disclosure of ESG risks, alongside market and financial risks, in
the fiduciary duty of investment managers and advisors.
The rising interest in ESG can be demonstrated by commitments to the United Nations’ Principles
for Responsible Investment (PRI), to which most of the world’s largest asset managers are now
signatories.
Around 2,370 investment institutions, with assets under management of $86Trn, have
demonstrated their commitment to the PRI. That’s a huge increase since a decade ago.
PRI Signatory growth
Assets under management (US$ trillion) N° Signatories
100 2,750
90 2,500
80 2,250
2,000
70
1,750
60
1,500
50
1,250
40
1,000
30
750
20 500
10 250
0 0
2006 2007 2008 2009 2010 2011 2012 2013 2014 2015 2016 2017 2018 2019
Asset under management (US$ trillion) Number of AOs
AO* AUM ($ US trillion) Number of Signatories
(*) Asset owner
Source: UN PRI, as at end of June 2019.
Important recent political initiatives on sustainability include the agreement reached at the
2015 Paris climate change conference (“COP21”), where 195 countries committed themselves to
limit global warming to a maximum of 2 percent above pre-industrial levels.
In many countries, this commitment now underpins national legislations. In France, for example,
Article 173 of the law on Energy Transition requires a wide range of investors to report on how
they integrate environmental, social and governance factors into their investment policies and on
how they are incorporating climate change considerations.
4ETF RESEARCH INSIGHTS | Why using ESG helps you build better portfolios
Some of the world’s largest pension and sovereign wealth funds have made allocations to ESG-
focused strategies during the last few years, while younger investors also prioritise sustainability
in their investment allocations: the millennial generation in particular has a very high demand for
ESG investment products1.
How robust is publicly available ESG information?
Publicly available ESG information is becoming richer and more extensive, helping analysts
assess the performance of companies according to environmental, social and governance
criteria.
The scope of mandatory ESG disclosure requirements has steadily been widened in recent
years.
For example, under the European Union’s Non-Financial Reporting Directive, from January 2017
all listed EU companies with more than 500 employees have had to disclose in their annual
reports a variety of information relating to environmental, social and employee matters, respect
for human rights and corruption.
Voluntary ESG disclosure requirements, such as the Carbon Disclosure Project (CDP),
the Financial Stability Board’s Task Force on Climate-related Financial Disclosures (TCFD),
and the Science-Based Targets (SBT) initiative, are also attracting increased compliance.
For example, over 7,000 companies with over $3.3trn of purchasing power in their supply chains
now provide voluntary reports to the CDP.
Meanwhile, specialised ESG databases run by governments, NGOs and academic
institutions, as well as proprietary ESG scoring and ratings systems operated
by extra-financial agencies, are also helping investors build a much more granular picture
of companies’ ESG performance.
Does it make sense to use a passive investment approach for ESG?
Although many ESG investors use an active stock selection approach, passive (index-based)
investment approaches are well-suited for ESG. The indices underlying passive ESG strategies
can be used to express a variety of different investment approaches, including ESG integration,
convictions on sustainability or thematic goals.
Passive investment strategies have democratised access to the financial markets at a low cost,
features that are entirely consistent with a focus on ESG goals. And both passive and ESG
investment approaches are data-driven.
The overall shift to ESG indices has been massive. For example, MSCI estimates that $180bn
was allocated to its ESG indices between 2014 and Q2 2019.
A remarkable evolution in investment approach has been observed from some large asset
owners. For example, institutions like Swiss Re in Switzerland2 or AP43 in Sweden have shifted
their whole policy benchmark to ESG indices.
Lyxor expects the role of financial indices in the area of sustainable investing to increase further.
Benchmarks are now being used by policymakers as instruments to orient investor choices and
to redirect investment flows.
And rather than just serving as a way to measure ESG risks, a new generation of ESG benchmarks
is being developed to have a measurable impact: such as helping to meet climate transition
goals under the Paris COP21 framework.
1. A
2017 FactSet study of high net worth investors says that 90% of millennials want to direct their allocations to responsible investments
in the next five years. See MSCI, ‘Swipe Right to Invest: Millennials and ESG’, November 2017.
2. https://www.swissre.com/media/news-releases/2018/nr_20180626_swissre_analysis_confirms_esg_benchmarks_make_economic_
sense.html
3 https://www.ap4.se/en/about-ap4/letter-from-the-ceo/
5ETF RESEARCH INSIGHTS | Why using ESG helps you build better portfolios
Q2: How much demand is there
for active or passive ESG funds?
Global trends
Worldwide, the Global Sustainable Investment Alliance reports that sustainable investment
assets, including both actively and passively managed ESG funds and including ESG integration
in traditional investment, reached more than $31trn at the end of 2018, up 34 percent since 2016. ESG funds
This represents a 39 percent share of global professionally managed assets4. represent 39% of
Focusing exclusively on funds whose main objective is ESG related, the global ESG mutual fund global managed
industry at the end of June 2019 reached $2trn, 6% of total assets. assets.
ESG funds in Europe – active, passive or ETF?
Historically, many investors’ approach to ESG investing has been active in nature. However,
passively managed ESG funds now make up an increasing share of the total.
In Europe, for example, assets invested in ESG funds reached €1.1trn at the end of June 2019,
based on data from Morningstar. This represented a 12 percent per annum growth rate over the
previous 5 years, compared with an 8 percent growth rate for the overall funds industry. In Europe ESG
The European fund total can be subdivided into €935bn for active investments in ESG, fund assets
€104bn for ESG index funds and €17bn for ESG ETFs. Over all, this represents more than reached €1.1trn
10 percent of total assets under management in Europe, according to Morningstar. at the end of
However, while passive funds still have a minority share of overall European ESG fund investments, June, 12% of all
their growth rate is significantly above that of active funds. Passive ESG fund assets have grown at assets managed.
a rate of 33 percent per annum over the past 5 years, compared with 11 percent for active funds.
It is split between
Assets in European ESG funds by management style (€bn) 89% active funds
1,200 and 11% passive
17 funds.
1,000 7 10 104
82 85
4
935
800 63 862 841
in EURbn
761
600
1
10
400 435
Passive funds
200
have grown
signficantly, at
0
2010 2016 2017 2018 2019 33% per annum
Active funds Index funds ETFs over the past 5
Source: Morningstar data from 01/01/2010 to 30/06/2019. years vs 11% of
active funds.
European ESG fund flows
European ESG funds have gathered €306bn of inflows during the past 10 years (ending June
2019): €236bn for active ESG funds, €55bn for ESG index funds and €14bn for ESG ETFs.
Flows into ESG funds were inconsistent until 2014, when inflows escalated quickly. Starting
mid-2014, the annualised 5-year growth rate of net new assets was 90 percent for ESG ETFs,
33 percent for ESG index funds and 30 percent for active ESG funds.
4. Global assets under management totalled $79.2trn in 2017, according to Boston Consulting Group.
6ETF RESEARCH INSIGHTS | Why using ESG helps you build better portfolios
2018 was not the best year for ESG inflows, with only €28bn in inflows, compared to the €50bn
yearly average from 2014 to 2017. But so far in 2019, €29bn has already been collected by active
and passive investments in ESG.
In summary, the trend of increasing flows into ESG funds is recent, but the growth rate is
significant again after a pause in 2018.
Inflows into European ESG funds by management style (€bn)
70
60 3 Flows have
50
11 accelerated, with
46
€29bn in H1 2019,
more than the
in EURbn
40 10
30
whole of 2018.
32
4 5
20 1 7 5
18
10 17 19
0
2010 2016 2017 2018 2019
Active funds Index funds ETFs
Source: Morningstar data from 01/01/2010 to 30/06/2019.
Focus: ESG ETF flows in Europe
Responsible investing also commands an increasing share of the European ETF market.
In 2018, we saw €4bn of inflows into Europe-listed ESG ETFs, which is equivalent to 9 percent
of all flows into the region’s ETFs. The total net purchases were almost double 2017’s inflows
of €2.2bn.
At the end
So far in 2019, flows have increased even further: H1 inflows into ESG ETFs in Europe were of H1 2019,
3 times higher than in the same period a year earlier. By the end of June 2019, ESG ETF net new
assets reached €5bn, a record high in the European ETF market.
European ESG
ETF flows
Cumulative net new assets invested in ESG ETFs in Europe (€m, by year) reached a record
6,000 high of €5bn.
5,000
4,000
3,000
2,000
1,000
0
Jan Fev Mar Apr May Jun Jul Aug Sep Oct Nov Dec
2014 2015 2016 2017 2018 2019
Source: Lyxor ETF, Bloomberg, data from 01/01/2014 to 30/06/2019.
Lyxor expects both active and passive flows into ESG funds in Europe to be sustained, supported
by investors’ increasing interest in ESG, as well as by regulation.
For example, in March 2018 the European Commission announced an action plan to finance
sustainable growth. Among other considerations, this will compel all investors to include ESG
criteria in their investment decisions.
7ETF RESEARCH INSIGHTS | Why using ESG helps you build better portfolios
Q3: Do ESG investors have to
compromise on performance?
Instead of maximising financial performance from ESG criteria, more and more investors are
now focused on maximising ESG performance subject to risk-return constraints.
But does investing sustainably necessarily mean giving up on potential returns? Some
researchers have claimed in the past that excluding so-called sin stocks (typically, companies
involved in alcohol, tobacco and gambling) from portfolios has exactly this effect.
The Lyxor Dauphine Research Academy sponsored Fabio Alessandrini and Eric Jondeau of
the University of Lausanne to look at the link between ESG investing and broader investment
performance. Their results are published in a new paper, called ‘ESG Investing: From Sin Stocks
to Smart Beta’.
What questions did the researchers study?
Does an investment in ESG degrade a portfolio’s performance?
What kinds of biases does a positive ESG screening strategy introduce?
Are there some factors that work better than others?
What conclusions did the researchers reach?
ESG investors do not have to compromise on performance. A positive screening
strategy based on ESG scores can raise the ESG profile of both passive and active
traditional and smart beta portfolios, without reducing risk-adjusted returns.
A screening strategy based on ESG scores, applied over the past 10 years, has led to
substantial geographical and sectoral bets.
How did the researchers reach these conclusions?
Using the ESG scores of firms belonging to the MSCI All Country World universe,
Alessandrini and Jondeau measured the impact of exclusion strategies on both
passive investment and smart beta strategies.
They looked at the geographical and industry bets implied by ESG filtering and
examined the effects of screening on portfolios’ exposure to factors and on the
performance of traditional and smart beta portfolios.
The researchers defined the stock universe and the ESG scoring
approach
The researchers analysed a broad set of risk and return characteristics for up to 7000 global
stocks from the MSCI All Country World Index over the period from January 2007 to December
2018.
Each firm was awarded a score from 0-10 in each of the three ESG ‘pillars’ or ‘dimensions’–
environmental, social and governance–as well as a composite ESG score.
These scores showed quite wide variations in different regions and over time.
They then looked at the effect of excluding stocks according to ESG
criteria
Alessandrini and Jondeau then looked at the effect of excluding progressively more stocks from
the starting universe, depending on their ESG scores.
8ETF RESEARCH INSIGHTS | Why using ESG helps you build better portfolios
They did this by reporting the performance statistics of value-weighted portfolios of global, US,
European, Pacific, and Emerging country equities, with companies excluded at the following
intervals: The improvement
No exclusions observed in
10 percent of stocks with the lowest overall ESG scores excluded the ESG profile
25 percent of stocks with the lowest overall ESG scores excluded of portfolios
50 percent of stocks with the lowest overall ESG scores excluded
does not seem
Taking a portfolio of global stocks as an example, the researchers found (unsurprisingly) that a to happen at
policy of progressively excluding the worst ESG performers led to an improvement in the average the expense of
ESG score of the remaining portfolio constituents. However, the risk-return characteristics
showed neither an improvement or a deterioration.
risk-adjusted
performance.
The researchers then looked at the effect of screening portfolio constituents according to their
environmental, social or governance scores and arrived at a broadly similar conclusion: the
improvement observed in the ESG profile of portfolios does not seem to happen at the expense
of risk-adjusted performance.
They analysed the geographical and industry bets implied by ESG
filtering
A more aggressive
Alessandrini and Jondeau deliberately used a bottom-up approach unconstrained by industry
or by country. This differs from most current approaches by index providers that use industry-
approach to ESG
relative ratings, and global indices aggregating regions. This allows to highlight key biases scores in a global
resulting from an ESG selection. portfolio means:
We must take care to notice the geographical and industry bets that can arise from such a (1) overweighting
screening approach, say Alessandrini and Jondeau. Europe and
For example, the researchers say, when a progressively higher percentage of firms are excluded underweighting
from the ESG portfolios, the overall weights of companies based in the US and emerging markets the US and
decrease, while more European firms are included. emerging
This reflects the lower absolute ESG scores of firms in the US and emerging markets relative markets;
to those based in Europe and the Pacific region, say Alessandrini and Jondeau. (2) overweighting
Put another way, the more aggressive the ESG screening approach, the larger the resulting bias the IT and
towards European and Pacific region stocks, and against US and Emerging markets stocks. industrial
Similarly, progressively excluding stocks with the lowest ESG scores leads to an underweighting sectors and
of stocks in the financial and energy sectors and an overweighting of stocks in the information underweighting
technology and industrial sectors, measured relative to the starting portfolio (the MSCI ACWI the financial and
index). energy sectors.
Impact on portfolio performance of excluding firms with the lowest ESG scores, by region*
ACWI EM US Europe Pacific
ESG = ++ + ++ =
*measured by the evolution of the Sharpe ratio when excluding from between 0 to 50% of firms with the lowest ESG
Scores: = Neutral impact, + positive impact, ++ very positive impact. Source: ESG Investing: From Sin Stocks to Smart
Beta, Alessandrini, Jondeau, June 2019.
For example, excluding 50% of firms with the lowest ESG ratings from a European equity
portfolio (represented by the MSCI Europe index) added 0.8% a year in returns over 10 years,
while decreasing volatility by around 0.7%. This had the effect of increasing the Sharpe ratio
by 0.05 points.
Impact of ESG screening on MSCI Europe index
MSCI Europe 50% excluded
Annualised returns 3.63% 4.42%
Annualised volatility 18.93% 18.23%
Sharpe ratio 0.15 0.20
Source: ESG Investing: From Sin Stocks to Smart Beta Alessandrini, Jondeau, June 2019.
9ETF RESEARCH INSIGHTS | Why using ESG helps you build better portfolios
Thirdly, they examined the effect of ESG screening on portfolios’
exposure to factors
A more aggressive
The researchers also found that excluding more companies from portfolios according to their
ESG scores results in two important factor biases: the average market capitalisation and the
approach to ESG
average price-to-book value ratio of the firms included in the portfolio usually increase. scores in a global
portfolio means
Expressed in the language of factors, ESG screening tends to lead to a lower exposure to the
size factor premium and to the value factor premium. loading on large,
profitable, and
Generally speaking, becoming more aggressive on ESG scores means loading on large,
profitable, and conservative companies, Alessandrini and Jondeau conclude. conservative
companies.
Finally, they examined the effect of ESG screening on smart beta
portfolio performances
The researchers also examined the impact of using an ESG filter on the performance of risk
factor portfolios. Their observations showed that, in most cases, ESG filtering results in an
improvement in portfolio performance, even on a risk-adjusted basis. This is shown by an A more aggressive
increase in the Sharpe ratio of most of the smart beta strategies (as shown in the table below). approach to ESG
Impact of excluding firms with lowest ESG score on factor portfolio performance*
scores in a global
portfolio means
ACWI EM US Europe Pacific an improvement in
Quality + + + + - the performance
Momentum + + + + + of most risk factor
Value + - + + + portfolios.
Size + - + + +
High yield + + + + +
Low beta + + + + +
*measured by the evolution in the Sharpe ratio when excluding from 0 to 50% of firms with the lowest ESG Scores.
Scores: = Neutral impact, + positive impact, - negative impact. Source: ESG Investing: From Sin Stocks to Smart
Beta, Alessandrini, Jondeau, June 2019.
For example, excluding 50% of firms with the lowest ESG ratings from a European equity size
portfolio added 0.19% per annum of return over 10 years, while removing 0.9% of volatility,
therefore increasing the Sharpe ratio by 0.05 points.
Impact of ESG screening on MSCI Europe size portfolio
MSCI Europe 0% excluded 50% excluded
Annualised return 3.20% 4.39%
Annualised volatility 23.56% 22.65%
Sharpe ratio 0.11 0.16
Source: ESG Investing: From Sin Stocks to Smart Beta, Alessandrini, Jondeau, June 2019.
10ETF RESEARCH INSIGHTS | Why using ESG helps you build better portfolios
Conclusion
What are the key
takeaways
for investors?
ESG investing is on the rise worldwide, driven by top-down policy initiatives and bottom-up
demand from investors of all sizes.
The global ESG mutual fund industry, focusing exclusively on funds whose main objective is ESG
related, reached $2trn at the end of June 2019, 6% of total assets.
In Europe, those assets reached €1.1trn at the end of June 2019, 12% of all assets. Although
passive flows still represent a minority, they are growing quickly: 33% per annum over the past
5 years vs 11% of active funds.
Lyxor expects both active and passive flows into ESG funds in Europe to be sustained, supported
by investors’ increasing interest in ESG, as well as by regulation.
As the availability and reliability of ESG information improves, more and more index-based
strategies are being created with embedded ESG characteristics. Lyxor views ETFs and ESG as
a natural fit and expects this segment of Europe’s ETF market to grow substantially.
A key question for investors is whether a preference for sustainable, socially responsible investing
means giving up on opportunities for portfolio performance.
The project sponsored by this year’s ETF Research Academy answers this question in the
negative: based on an analysis of the past performance of a universe of stocks from the
MSCI All Country World index, a policy of exclusion based on companies’ ESG scores did not
impact portfolio performance negatively. In some cases, it led to superior risk-adjusted returns
compared to the starting universe.
However, ESG screening tends to result in pronounced geographical, sector and industry biases.
It also tends to generate increased exposure to large, profitable, and conservative companies.
There is fertile ground for further research on the integration of smart beta and ESG, in particular
with respect to the single ESG dimensions, and in building algorithms that optimise the ESG
profile of portfolios while keeping exposures to various risk factors under control.
LYXOR’S VIEW
Lyxor expects both active and passive flows into ESG funds in Europe to be sustained.
Lyxor views ETFs and ESG as a natural fit and expects this segment of Europe’s ETF
market to grow substantially.
Improving the ESG profile of a portfolio does not happen at the expense of risk-adjusted
performance. In some cases, it can even lead to superior risk-adjusted returns.
11ETF RESEARCH INSIGHTS | Why using ESG helps you build better portfolios
About Lyxor ETF
Lyxor has been running ETFs since 2001, longer than any other European provider. Our pioneering spirit helped shape the market
as you know it today. Over the last 18 years, we’ve become one of Europe’s three largest ETF managers. And we’ve built one of its
most far-reaching ranges, which spans all asset classes, and includes some of the lowest cost, largest and most efficient* ETFs.
We now offer more than 220 ways to explore the markets. So, whether investors are seeking essential, low cost core index
exposure, or reaching out for more tactical opportunities in specific sectors or markets, we have a product to match their needs.
Staying true to our pioneering heritage, we continue to expand the frontiers of fixed income ETFs, and develop new solutions for
ESG, Smart Beta or income investors.
Our aim from the start has been to create ETFs of the highest calibre that can be trusted in any market. In 2011, we introduced
our ETF Quality Charter to ensure that every one of our 220+ funds meets the same exacting standards for tracking precision,
product liquidity, risk management and transparency.
*Source: Lyxor International Asset Management. Efficiency data over one year as at 30/06/2019. Performance data based on the efficiency indicator created
by Lyxor ‘s research department in 2013. It examines 3 components of performance: tracking error, liquidity and spread purchase/sale. Each peer group
includes the relevant Lyxor ETF share-class and the 4 largest ETF share-classes issued by other providers, representing market-share of at least 5% on
the relative index. ETF sizes are considered as an average of AUM levels observed over the relevant time period. Detailed methodology may be found in
the paper ‘Measuring Performance of Exchange Traded Funds’ by Marlène Hassine and Thierry Roncalli. Past performance is no guide to future returns.
Discover the Lyxor/Dauphine
Research Academy
A NEW FRAMEWORK FOR THE ETF INDUSTRY
LYXOR DAUPHINE RESEARCH ACADEMY FOUNDED BY
DAUPHINE & LYXOR
The idea for the Research Academy originally came about That’s why in 2015 we created the Research Academy
because of the lack of regular, high-quality academic in partnership with the Paris-Dauphine University’s House
research on passive management, especially in comparison of Finance. We wanted to encourage top international
with that produced on the active management segment. researchers from the most renowned universities to work
It was necessary to carry out in-depth analyses and hold on subjects related to passive management. Since then,
discussions to tackle some of the issues facing the market, the Academy’s subjects have been extended to cover broader
especially those linked to the world of ETFs and, ultimately, topics surrounding portfolio construction.
to provide some answers addressing investors’ needs.
The Academy’s objective is to promote high-quality academic
At Lyxor, we have a strong culture of innovation and a solid research on issues associated with changes in asset
financial engineering track record. As one of the leaders management. The idea behind the initiative was to establish
within the European ETF market, it was only natural for links between universities and the asset management industry
Lyxor to get involved in these discussions, at the juncture to provide concrete academic answers and offer a perspective
between academic research and genuine investor concerns. on some of the real issues that investors face.
THIS DOCUMENT IS DIRECTED AT PROFESSIONAL INVESTORS ONLY
This document is for the exclusive use of investors acting on their own account and categorized either as “eligible counterparties” or “professional clients” within the meaning of Markets
Ref. (A) 720822 - Studio Societe Generale - 07/2019
in Financial Instruments Directive 2014/65/EU. It is not directed at retail clients. In Switzerland, it is directed exclusively at qualified investors.
This material reflects the views and opinions of the individual authors at this date and in no way the official position or advices of any kind of these authors or of Lyxor International Asset
Management and thus does not engage the responsibility of Lyxor International Asset Management nor of any of its officers or employees. This research is not an offer to sell or the solicitation
of an offer to buy any security in any jurisdiction where such an offer or solicitation would be illegal. It does not constitute a personal recommendation or take into account the particular
investment objectives, financial situations, or needs of individual clients. Clients should consider whether any advice or recommendation in this research is suitable for their particular
circumstances and, if appropriate, seek professional advice, including tax advice. Our salespeople, traders, and other professionals may provide oral or written market commentary or trading
strategies to our clients and principal trading desks that reflect opinions that are contrary to the opinions expressed in this research. Our asset management area, principal trading desks and
investing businesses may make investment decisions that are inconsistent with the recommendations or views expressed in this research.
Find out more www.lyxoretf.comYou can also read