Splunk IT Service Intelligence - Presentation Subhead (on two lines, if you need it)
←
→
Page content transcription
If your browser does not render page correctly, please read the page content below

© 2017 SPLUNK INC.

Splunk IT Service Intelligence
Presentation Subhead
(on two lines, if you need it)

Presenter’s Name | Title & Specialization

Date | Location

© 2017 SPLUNK INC.

                            Forward-Looking Statements
During the course of this presentation, we may make forward-looking statements regarding future events or
the expected performance of the company. We caution you that such statements reflect our current
expectations and estimates based on factors currently known to us and that actual events or results could
differ materially. For important factors that may cause actual results to differ from those contained in our
forward-looking statements, please review our filings with the SEC.

The forward-looking statements made in this presentation are being made as of the time and date of its live
presentation. If reviewed after its live presentation, this presentation may not contain current or accurate
information. We do not assume any obligation to update any forward-looking statements we may make. In
addition, any information about our roadmap outlines our general product direction and is subject to change
at any time without notice. It is for informational purposes only and shall not be incorporated into any contract
or other commitment. Splunk undertakes no obligation either to develop the features or functionality
described or to include any such feature or functionality in a future release.
Splunk, Splunk>, Listen to Your Data, The Engine for Machine Data, Splunk Cloud, Splunk Light and SPL are trademarks and registered trademarks of Splunk Inc. in
the United States and other countries. All other brand names, product names, or trademarks belong to their respective owners. © 2017 Splunk Inc. All rights reserved.
© 2017 SPLUNK INC.

                  Challenges Facing Today’s IT

                                                             $
                                                                 $
                                                                     $

High cost of IT     Inefficient use of   Lower customer   Lost revenue
  Operation            resources           satisfaction
© 2017 SPLUNK INC.

         Desired Outcomes for IT Operations

 Reduce tool     Become more      Use resources   Optimize the
complexity and   predictive and     efficiently    consumer
   costs          preventative                     experience
© 2017 SPLUNK INC.

How IT Operates                         Applications, business/mission services
Today: IT Stack POV
▶   The way many in IT think of their
    world                               Web Server (Apache, TomCat)
▶   Each layer is a silo
                                        App Server (WebLogic, JBoss EAP, WebSphere)
▶   A dedicated team of experts
    (with domain tools) focus just on   Database (Oracle, SQL Server, MySQL)
    the health of that layer
▶   Their view of the health of that    Guest OS (Windows/Linux/*Nix)
    layer is based on the aggregated
    health of each component in the     Hypervisor (ESX, HyperV, Citrix)
    layer
▶   If 2 out of 100 DBs are             Physical Server (Dell, HP, CISCO blades or servers)
    struggling, you’re still having a
    good day                            SAN/NAS Storage (EMC, NetApp)

                                        Network
© 2017 SPLUNK INC.

What’s Needed:                               Service/App                 Claims          Outage!
Service/App POV
                                                                                          Status
▶   The aggregated health of the
    layer is irrelevant               Web Server           (1,2,3,4,5,6,7,8,9,10…N)     100%
▶   Dependencies now matter
                                      App Server           (1,2,3,4,5,6,7,8,9,10…N)     100%
▶   The health of the app depends
    on the health of each             Database             (1,2,3,4,5,6,7,8,9,10…100)   98%
    component of each layer that
    that app depends upon
                                      Guest OS             (1,2,3,4,5,6,7,8,9,10…N)     100%
▶   If your app depends on 1 or
    more of those 2 struggling DB     VM/Hypervisor        (1,2,3,4,5,6,7,8,9,10…N)     95%
    servers, you’re about to have a
    bad day!                          Physical Server      (1,2,3,4,5,6,7,8,9,10…N)     100%
▶   What about those VMs that are
    red?                              SAN/NAS Storage      (1,2,3,4,5,6,7,8,9,10…N)     100%

                                      Network                                           100%
© 2017 SPLUNK INC.

   Rethink and Improve How IT Operates
              Using Artificial Intelligence for IT Operations

                                                         0101101
                                                         0010101

       Traditional IT                             Data-Driven IT
▶Structured   data                         ▶Structured and unstructured data
▶Brittle tools and integrations            ▶Robust data integrations

▶Obsession with “faults” and “traps”       ▶Real-time insights from big data

▶Focus on components parts                 ▶Focus on the whole service

▶Search oriented                           ▶Machine learning-driven analytics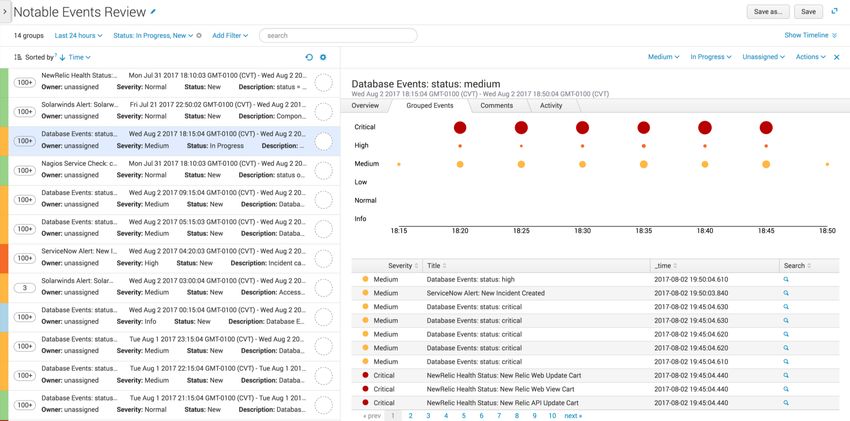
© 2017 SPLUNK INC.

                        What Is Service Intelligence?

Enabling a business-aware IT
Measuring and reporting on indicators that matter

                                                    Unlocking operational efficiencies
                                                    Collaborating across silos to improve service operations

                     Data-based decision making
                     Solving problems and anticipating pitfalls with sophisticated
                     analytics and powerful insights
Connecting the “Data Dots” for
                                                                                                            © 2017 SPLUNK INC.

                Service Intelligence
          Incident      Incident                         Service          Root-cause            Business-
         detection       triage    Investigation       restoration         analysis             driven IT

                                                   Maintain high service levels and availability, prevent
                                                   outages and recover quickly when things break down
     Data-driven
      decisions

                                                   Improve productivity and share understanding of
Unlocking operational
                                                   business service criticality, impact and incident
     efficiencies

                                                   Monitor, visualize and present real-time insights into
                                                   service health against KPIs to drive operational and
  Business-aware                                   business decisions
        IT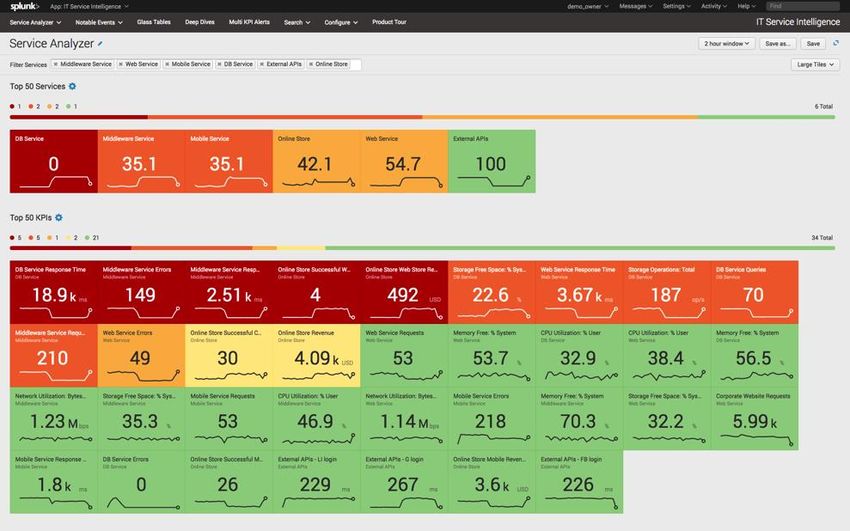
© 2017 SPLUNK INC.

         Artificial Intelligence for IT Operations
Powered by machine learning and analytics for real-time service insights,
            simplified operations and root-cause isolation
© 2017 SPLUNK INC.
Splunk ITSI: Multiple Use Cases, One Solution
SERVICE INSIGHTS EVENT ANALYTICS
Service health scores Service insights on events to
calculated from KPIs prioritize triage and
investigation
Baseline KPI trends based
on operational patterns and Machine learning to reduce
identify abnormal conditions noise and find alerts on root
causes of issues
Organized view of KPIs
and trends for fast triage Sophisticated analytics and
and analysis incident workflow to
automate managing events
Deep insights into
technology domains to Initiate incident response
speed investigation and remediation actions© 2017 SPLUNK INC.
Breadth of Machine Learning Capabilities
Make IT Effective, Proactive and Predictive
Dynamic Thresholding Event Clustering
Thresholds adapt in real time Detect and highlight the
Trend and alert on anomalous events that matter
behavior Prioritize events that need
Prevent service degradation action taken
Anomaly Detection Prediction
Alerts triggered automatically Predict outages and anomalies
by anomalous activity before they occur
Incident responders can see Act on these predictions so
across all silos to find a your services are not affected
quicker MTTR
Platform for Machine Data© 2017 SPLUNK INC.
Predict and Prevent
Time Hurts© 2017 SPLUNK INC.
Time Hurts
Events
Existing
NOC alerted MTTR
$ Impact
Impacting
Fault
Time© 2017 SPLUNK INC.
Effective
Clustering: Order from Chaos
▶ Effective
• Respond to alerts associated together using Machine Learning clustering
• Provide starting point or inference for business-impacting event cause
▶ Results
• Reduce employee churn
• Increase of time investment for strategic projects
▶ Example
• Leidos decreased event noise 95-98%
• 3,500-5,000 alerts per day down to 100-200 actionable events© 2017 SPLUNK INC.
Event Analytics – Become More Effective
Events
Existing
NOC alerted MTTR
Effective MTTR
Splunk Event Analytics
$ Impact
Impacting
Fault
Time© 2017 SPLUNK INC.
Proactive
Anomalies in the Now
▶ Proactive
• Respond to alerts with Service Context
• Engage the right IT partners the 1st Time for faster resolution
• Engage in the automation (self healing) of high fidelity/high confidence incident
▶ Results
• Respond to alerts with Service Context
• Engage the right IT partners the 1st Time for resolution
• Engage in the automation (self healing) of high fidelity/high confidence incident
▶ Example
• Molina Healthcare gained visibility and correlation across its stack, which reduced the number
of IT incidents by 30-45% and MTTR by 70-90%.© 2017 SPLUNK INC.
Move to a Proactive Posture
Events
Existing
NOC alerted MTTR
Effective MTTR
Automated
Resolution
Proactive
MTTR
(add logs and metrics) Splunk ML Alert
$ Impact
Impacting
Fault
Time© 2017 SPLUNK INC.
Predictive
It’s Like We Know the Future
▶ Predictive
• Predict your Services Health Score ~ 30min into the FUTURE
• Leverage Key Performance Indicators (KPIs) and Dependency Modeling
• Respond to business-impacting events BEFORE they CAN occur
▶ Results
• Reduction in MTTR, problems and changes
• Provide the business early warning of revenue-impacting events
• Instill confidence in the business for operations teams
• Re-invest time given back to team in the organization’s strategy
▶ Example
• Your organization!© 2017 SPLUNK INC.
Prevent Incidents From Occurring
Events
Existing
NOC alerted MTTR
Effective MTTR
Automated
Resolution
Proactive
MTTR
(add logs and metrics) Splunk ML Alert
Predictive
NO MTTR !!
$ Impact
Cost of Impact
Time Return
to Business
Time© 2017 SPLUNK INC.
Machine Learning in ITSI
KPIs ANOMALY DETECTION INTELLIGENCE
Network logs
Adaptive Thresholds
Clustered Notable
Any Time
Events
Series in
Splunk Anomaly Detection
Metrics* Automated Actions
Machine
Cohesion Detection Machine
Server logs Assisted Deep Dive
Learning Learning
Investigation
MLTK Customization
Application
logs
Custom from MLTK Other Events & Alarms© 2017 SPLUNK INC.
Splunk Customer Examples
Effective Proactive Predictive
95-99% reduction in event Reduce the number of IT Predict their Service Health
noise, taking 3,500-5,000 incidents by 30-40%, Score’s impact 20-30
down to 50-200 actionable decrease MTTR by 70-90% minutes into the future
events© 2017 SPLUNK INC. Splunk ITSI Demo
© 2017 SPLUNK INC.

       Personalized Visualizations of Your Services

▶   Visualize contextual inter-relationships
    across service delivery components
▶   Illustrate business and service activity
    using indicators aligned
    to strategic goals
▶   Drive decisions by monitoring service
    health against performance indicators
▶   Create sophisticated dashboards
    in minutes
© 2017 SPLUNK INC.
Organized View of Performance Indicators
▶ Organize and correlate KPIs to speed
up investigations and diagnosis
▶ Compare performance over time and in
real time to understand trends and
identify issues
▶ Enable broad and deep investigation
with contextual drill-downs
▶ Investigate anomalous activity in your
KPIs to proactively address emerging
issues© 2017 SPLUNK INC.
Real-Time View of Service and KPI Health Scores
▶ Get early warning of emerging
incidents with a heat map of service
health and KPI scores, metrics,
sparklines and alerts
▶ Drill down into service and entity
details for in-depth triage© 2017 SPLUNK INC. Insights Into the Origin of Service Disruptions Profile an entity to troubleshoot Identify contributing services and outages and service degradations entities of the worst performing KPIs
© 2017 SPLUNK INC.

Correlation Rules Generate Notable Events

   Run predefined correlation searches against learned indicators to
    generate notable events based on status and composite scores
© 2017 SPLUNK INC.
Sophisticated Event Analytics
▶ Reduce event clutter and false positives
with multivariate anomaly detection
▶ Use machine learning Smart Mode to
group related events and generate
human-scale alerts
▶ Create custom aggregation policies to
filter event noise
▶ Easily sift through events by filtering,
tagging and sorting
▶ Enrich and add context to events to
prioritize investigation and ensure
business-service availability© 2017 SPLUNK INC.
Fast Incident Review and Investigation
1
Risk-based
security
Triage notable events by criticality, trigger new alert actions and
automatically initiate defined incident and remediation responses© 2017 SPLUNK INC.
Machine Learning Made Mainstream
Adaptive Thresholds Anomaly Detection Event Correlation
Manage and maintain KPI thresholds by dynamically adapting to changing operational patterns
Catch issues that thresholds can’t—baseline normal operations and alert on anomalous conditions
Reduce event clutter, false positives and rules maintenance by auto-grouping related events© 2017 SPLUNK INC.
Baseline Operational Patterns and Adapt Thresholds
Use machine learning to dynamically Maintain and preserve learned thresholds
adapt KPI thresholds by time to monitor KPI and service behavior© 2017 SPLUNK INC. Detect Normal and Abnormal Behavior Baseline normal operations and Identify abnormal trends and alert on anomalous conditions patterns in KPI data
© 2017 SPLUNK INC.

                  Reduce Event Clutter

 Elicit patterns and real-time correlations to cluster and group relevant
events with easy-to-use and sophisticated machine learning algorithms
© 2017 SPLUNK INC.
Integrate With Existing Incident Workflows
Leverage inbuilt integrations Easily build custom integrations,
Automatically initiate
with ServiceNow, BMC execute remedial actions and
defined incident and
Remedy, xMatters, PagerDuty extend functionality with
remediation responses
to initiate incident resolution powerful APIs© 2017 SPLUNK INC.
Deep Service-Oriented Insights Into Technology Domains
▶ Fast-track data collection without
costly add-ons, customizations
and manual configurations
▶ Gain deep service-oriented
insights with built-in dashboards
▶ Simplify creation and deployment
of third-party and custom
modules© 2017 SPLUNK INC.
Reduce the Administrative Hurdle
Eliminate manual rules management with built-in machine learning to
ML-Powered AI group related events and establish normal vs. abnormal patterns
Fast Search Enable mass changes to thresholds and searches with templates,
Performance reducing the number of searches and improving performance
Maintenance Set services and entities into “maintenance” to suppress alerts and
Windows accurately reflect health scores
Backup and Create highly available Splunk ITSI environments, revert configurations
Restore to previous versions and ensure continuous delivery
Role-Based
Manage granular permissions and authorize access to various views
Access Controls© 2017 SPLUNK INC.
Splunk IT Service Intelligence
Machine Learning
▶ Adaptive threshold automation to minimize false alerts
▶ Behavior anomaly alerts to proactively address issues
▶ Automatic correlation of data into intelligence, mitigating SME dependency
Dynamic Service Model
▶ Visualize entire tech stack – bare metal through business layer
▶ View the entire ecosystem with customized views for execs
▶ Apply context to events to prioritize investigation based on impact
Search-Based KPIs
▶ Accelerators minimize SPL coding
▶ Trend aggregation to enable rapid visualization
▶ Multi KPI Alerts for proactive irregularity identification
Operational Intelligence
Platform for Operational Intelligence Search and Proactive Operational
Real-Time
Business
Investigation Monitoring Visibility
▶ Time Series Index Insights
▶ Schema on Read
▶ Handle any and all data Enterprise
Scalability© 2017 SPLUNK INC.
What Makes Splunk
ITSI Different© 2017 SPLUNK INC.
Built on a Scalable Platform
Desktop to Datacenter Schema on-the-Fly Universal Data Platform Agile reporting, analytics
and visualizations
Operate in a single Apply structure to data Reliably collect, index and Flexible, easy-to-use
datacenter or globally at search time, enabling store any type of data, at interface to create ad hoc
across multiple customizable pivots on any volume, from tens of reports and custom
datacenters, on-premises any and ALL data thousands of sources, in dashboards for IT and
or in the cloud real time business users on-the-fly
and on demand© 2017 SPLUNK INC.
Unified Insights for Data-Driven Actions
Full Fidelity Service Mathematical From Data to Reduced Complexity
Health Sophistication Intelligence
Move seamlessly from Apply data science and Deliver actionable intelligence Fewer tools, fewer
business service reports to sophisticated algorithms for to IT and the business with administrators and reduced
investigation to remediation an analytics-driven IT service insights and event infrastructure capacity
operations analytics© 2017 SPLUNK INC.
Unified Insights for Data-Driven Actions
Simplified rules Improved incident
Service Context Machine Learning
management workflows
Deliver context on events Alert on anomalous Eliminate command-line Use built-in integrations into
to prioritize alerts and conditions based on rules configurations and incident management tools
events based on business operational baselines to JavaScript vulnerabilities with powerful APIs to
impact reduce event clutter enable custom integrations© 2017 SPLUNK INC.
Splunk ITSI for Event Analytics
Simplify Your Operations With Artificial Intelligence and Service Context
Service Context Artificial Intelligence Scalable Platform
1001001 0101001
0100010 1001101
0110010111000110
1101011101010110
0010011101011000
Find and fix the most Transform IT operations with Get a full view of your IT
important issues machine learning environment
Separate valuable signal Respond collaboratively
Contextualize and prioritize
in noise and simplify operations
Reduce time-to-resolution on Enable IT with intelligence for Share customized insights across the
business-critical services data-driven decisions enterprise to enable business-centric IT© 2017 SPLUNK INC.
Splunk IT Service Intelligence
Data-driven service monitoring and analytics
Dynamic At-a-Glance Early Warning Simplified Incident
Event Analytics
Service Models Problem Analysis on Deviations Workflows
Splunk IT Service Intelligence
Platform for Operational Intelligence
Common
Time-Series Index Schema-on-Read Data Model
Information Model© 2017 SPLUNK INC. Case Studies
© 2017 SPLUNK INC.

         ONLINE SERVICES – CLOUD SOLUTIONS, IT OPERATIONS

Real-Time Car Auctions Delivered
        With Intelligence
“With Splunk ITSI, we have proactive infrastructure
 monitoring to ensure a consistent level of customer service
 for interested buyers to bid on cars.”
    – VP Technology Application Development & Operations, Cox Automotive

▶   Reduced time-to-investigate and resolution with
     real-time insights
▶   Reduced incidents across global auctions by 90%
▶   Improved end-user experience and service reliability
▶   Scaling the implementation with Splunk Cloud
© 2017 SPLUNK INC.
HEALTHCARE – IT OPERATIONS, BUSINESS ANALYTICS
AdvancedMD: Strengthening
Customer Satisfaction
“ Splunk ITSI ensures customer satisfaction by giving us service-
centric health reporting, end-to-end visibility and advanced
analytics to detect patterns, anomalies and trends.”
– Director, Platform Operations, AdvancedMD
▶ Ability to monitor network resources leads to improved
service delivery
▶ Greater customer satisfaction via service-centric
health reporting, end-to-end visibility and advanced
analytics to detect patterns, anomalies and trends
▶ More efficient IT operations with full visibility into
complex processes© 2017 SPLUNK INC.
TECHNOLOGY – IT OPERATIONS
Improved Satellite Operations With
Real-Time Infrastructure Visibility
“ Using Splunk ITSI has helped us to understand our IT network in
a way we weren’t able to previously. This has directly led to
improvements in areas such as troubleshooting and security
awareness.”
– Daniel Nye, CTO, Surrey Satellite
▶ Improved service accessibility, reliability and security
▶ Enhanced ability to troubleshoot persistent service
problems
▶ Gained end-to-end visibility into overall IT
performance© 2017 SPLUNK INC.
FINANCIAL SERVICES – IT OPERATIONS
Modernizing Enterprise Monitoring at the
International World Development Bank
▶ Enhanced service reliability and incident response
Financial
▶ Ease and flexibility in creating business level
Services
dashboards ad hoc and on-the-fly
▶ Integrations with BMC Remedy to simplify incident
response and action
▶ Tracing business transactions end to end© 2017 SPLUNK INC.
TECHNOLOGY – IT OPERATIONS
Supporting, Monitoring and
Securing Services 24/7
▶ Reduce time-to-resolution
• Consolidated services view across entire IT infrastructure
▶ Identify anomalous activity and ensure governance
• Adaptive thresholds and alerts improve security posture
▶ Proactively improve customer experience
• Comprehensive analytics to reduce service disruption© 2017 SPLUNK INC.
COMMUNICATIONS – IT OPERATIONS
Splunk IT Service Intelligence
at Vodafone
“Splunk IT Service Intelligence gives Vodafone a real-
time understanding of how our services are
performing overall and at the more granular level.”
– Oliver Hoppe, solutions architect, Vodafone
▶ Unified insights: data integrations from other tools
▶ Reduced incident tickets
▶ Usage baselines to identify anomalies© 2017 SPLUNK INC.
FINANCIAL SERVICES – IT OPERATIONS
Splunk IT Service Intelligence at
Fiserv
▶ Server-based to ▶ Top-down and
services-based deep-dive service
monitoring insights
▶ Flexible creation and
▶ 200+ services and modification of services
1,500+ KPIs monitored
and KPIs
▶ Alerting on service KPIs ▶ Real-time, holistic and
instead of server proactive “client” view
performance© 2017 SPLUNK INC.
HEALTHCARE – IT OPERATIONS
Molina Healthcare: Splunk ITSI as
Platform for Multiple Use Cases
“You can derive value from Splunk at any level of the
business, from the CEO down to any user the first
day starting out.”
– Enterprise Infrastructure Leader, Molina Healthcare
▶ Operational visibility and real-time views into
enterprise infrastructure and application management
▶ Comprehensive insight into business intelligence and
performance metrics
▶ Tracking call center management
▶ MTTR, customer service and troubleshooting© 2017 SPLUNK INC.
Splunk IT Service Intelligence
Strategic, Data-Centric
Accelerated
Business-Centric Approach to Service
Value for IT
View of IT Mapping© 2017 SPLUNK INC.
How Do You Get Splunk ITSI?
Online Sandbox Value Assurance
7 days of access to a free, personal Engage in a proof-of-concept to index
environment in the cloud, with your data and experience Splunk ITSI
prepopulated data© 2017 SPLUNK INC.
Splunk-Sponsored Guided Workshop
What is it? Define methods for:
▶ 1-day on-site workshop ▶ Proactive service
▶ Tightly linked with value monitoring
▶ Reduced risk and
▶ Collaborative approach
failures
▶ Build your own Splunk
▶ Faster issue resolution
ITSI Glass Table
▶ Increased business
performance© 2017 SPLUNK INC. Thank You
© 2017 SPLUNK INC.

Backup
© 2017 SPLUNK INC.

                 Splunk is the Backbone of IT
                     Broad ecosystem of integrations
Infrastructure
                                              Network

                                                             Server
Applications
                                Cloud

Development

                     Project & Issue
                        Tracking                                      Storage

                           Code Repository                Applications
                                             Automation
© 2017 SPLUNK INC.
Remediation Solution Architecture
ARTIFICIAL ANOMALY
PATTERN DETECTION CLUSTERING PREDICTION
INTELLIGENCE DETECTION
Automation Tools Service Mgmt Tools
SOLUTIONS (THIRD PARTY) (THIRD PARTY)
Monitoring
Event Analytics Service Insights
INFRASTRUCTURE MONITORING APPLICATION ANALYTICS
Infrastructure Troubleshooting Cloud Monitoring & Optimization Custom App Troubleshooting Release Analytics
Container Monitor & Troubleshoot Server Monitor & Troubleshooting Custom Experience Monitoring Build Analytics
Troubleshooting
PLATFORM Platform for Machine Data
TOOLS & APIs Cloud APM Open Source Database CMDB Automation
DATA METRICS Server Host Container Hypervisor Application
SOURCES LOGS Storage Network OS Application Mobile Wire Data© 2017 SPLUNK INC.
What We Hear From Our Customers!
“My CIO is demanding we look at IT from a business service perspective.”
“I need everyone to be able to see the same thing at the same time.”
“Splunk is great for break/fix, but I need to show we’re meeting SLAs.”
“I just want to throw data at Splunk and have it find problems for me.”
“Show me what my data can do for me!”© 2017 SPLUNK INC.
Why Another Splunk Solution?
A data-centric approach is needed
Service context maximizes Splunk value
An integrated solution accelerates customer success© 2017 SPLUNK INC.
Augment Conventional Monitoring
Deliver Insights Based on Integrated Data, Not Integrated Products
Splunk IT Service Intelligence
Operations and
APM NPM Infrastructure Domain Tools
Management© 2017 SPLUNK INC.
Splunk IT Service Intelligence
Define services,
Monitor and Analyze and
Get data entities and
troubleshoot detect
KPIs
Data-Defined, Data-Driven Service Insights© 2017 SPLUNK INC. Pricing
© 2017 SPLUNK INC.

                    Splunk ITSI

      $                              $
Splunk Enterprise                 Splunk ITSI
       or
  Splunk Cloud
© 2017 SPLUNK INC.
Volume Discounts Built In
Daily Peak Indexing Splunk IT Service $/GB Built-in Volume
Volume (GB) Intelligence Discount
1 $5,000 $5000
2 $7,500 $3750 25%
5 $12,500 $2500 50%
10 $18,000 $1800 64%
20 $27,000 $1350 73%
50 $47,500 $950 81%
100 $60,000 $600 88%
200 $90,000 $450 91%
500 $162,500 $325 93.5%
1000 $300,000 $300 94%© 2017 SPLUNK INC.
Splunk Quick Start for Service Intelligence
Enterprise Splunk ITSI Education Professional .conf
License License Services Passes
Value
Assurance *
Edition
Services
Edition
Platform
Edition
* Splunk ITSI 6-month license© 2017 SPLUNK INC.
Key Terminology
Set of actions
Logical performed with Component Metrics used
grouping of specific business required to deliver to evaluate
operations goals a service success
EXAMPLES EXAMPLES EXAMPLES EXAMPLES
Online banking, Sell products, Hosts, users, Service health,
authentication, fulfill orders, OS processes order revenue,
virtualization process payroll latency
Services Business Entities Key Performance
Processes Indicators© 2017 SPLUNK INC.
Splunk IT Service Intelligence – Core Concepts
Services
Technical Services Business Services
Requests Customer Requests
Services
Web
Responses Transactions Responses
Mobile Requests Requests
Support Desk
API/Middleware Responses Responses
Requests
DNS
Responses© 2017 SPLUNK INC.
Splunk IT Service Intelligence – Core Concepts
Services
Technical Services Business Services
Requests Customer Requests
Web
Customer Transactions Responses Transactions Responses
API/Middleware
DNS
Support Desk
API Services
Mobile
Web Services In Splunk ITSI, a service
Web
RDBMSs is a logical group of
technology components
Hypervisor and Hosts that a user deems need to
be monitored together
Storage Tier
Packet Network© 2017 SPLUNK INC.
What’s an Entity?
▶ An entity is an optional sub-element of a KPI
▶ A KPI can be filtered by entities and viewed
on a per-entity basis or as an aggregate
▶ KPI web requests might use web servers as
entities; user logins could use accounts
▶ Splunk ITSI can import entities from CMDBs
& other sources© 2017 SPLUNK INC.
Service Health Scores
▶ A health score is a score from 0-100 (0 = critical and 100 = normal)
that helps determine the health of a service.
▶ It is calculated based on importance and status (e.g., green, orange, red)
of all KPIs, once every minute.© 2017 SPLUNK INC.
What’s an Event?
▶ Self descriptive message that tells a Example Event
user that something happened. 1502642822 src_host="splunk_sh-
▶ Usually contain some sort of title, 01" omd_site ="SJC"
severity, and description. perfdata="SERVICEPERFDATA"
▶ Used to determine in the moment name="check_dhcp" severity="OK"
health. attempt="1" statetype="HARD"
▶ Often very noisy. executiontime="0.000"
▶ Think alarm data coming out of tools latency="0.000" reason="OK:
like Nagios, Solarwinds, APM, Received 1 DHCPOFFER(s), max
Netcool, etc. lease time = 600 sec." result="OK"You can also read


