AN ANALYSIS OF CELCOM AXIATA BERHAD-A REVIEW OF STRATEGIC PLAN - ULLAH, NAZIM MUNICH PERSONAL REPEC ARCHIVE
←
→
Page content transcription
If your browser does not render page correctly, please read the page content below
Munich Personal RePEc Archive

An Analysis of Celcom Axiata Berhad-A
Review of Strategic Plan

ULLAH, NAZIM

USIM

1 January 2021

Online at https://mpra.ub.uni-muenchen.de/108578/
MPRA Paper No. 108578, posted 05 Jul 2021 06:31 UTC
An Analysis of Celcom Axiata Berhad-A Review of Strategic Plan

                                         NAZIM ULLAH1

Abstract
Celcom is the first mobile operator in Malaysia. The aim of the study is to analyse Celcom
Axiata Berhad and review its strategic plan. The study analyses 5 years key performance
indicators (KPIs), SMART, PESTLE, Porter’s 5 Force Model and SWOT analysis of Celcom.
The findings show that Celocm should modify their current corporate strategy to cope with the
competitive market. The study is the direction for the stakeholders of the Celcom.

Keywords: Celcom, KPIs, SMART, PESTLE, Porter’s 5 Force Model, SWOT

1
    PhD. Candidate, Universiti Sains Islam Malaysia (USIM), E-mail: kmnazim_90@yahoo.com

                                                                                           1|Page
1.0 Introduction
Strategic planning is an organization's process of defining its strategy, or direction, and making
decisions on allocating its available resources to pursue organization’s VMO2. It leads to a
comprehensive and effective strategy which guides organizations to apply knowledge
strategically to meet the business needs and goals. The main purpose of the study is to analyse
the corporate strategic plan for Celcom telecom (Jasni, Yusoff, Zain,, Yusoff, and Shaffee,
2019)
1.1 Objectives of Study
The purpose of the study is to discuss strategic plan of the Celcom Axiata Berhad which is a
reputed mobile company in Malaysia. Being analyse its corporate strategy, a number of factors
such as macro and micro, financial are discussed and reviewed.
1.2 Background Information of Celcom Axiata Berhad
Celcom, a member of the Axiata Group of Companies, is the first mobile operator in Malaysia
which is launched its journey in 1988. Celcom offers the widest and most extensive 2G, 3G
and 3.5G coverage, serving 98% of populated areas, while it's 4G covers 76% of population.
Moreover, Celcom is a proud partner to 6 Mobile Virtual Network Operators (MVNO),
offering roaming services in 197 countries via more than 462 network partners worldwide.
1.3 Celcom’s Current Strategic Challenge
Table 1 shows five years information of number of customers, volume of revenue, and
EBITDA of Celcom Axiata berhad. After reviewing the table, it is shown that customers and
revenue have dropped in 2019 while EBITDA increase. Therefore, it is the greatest and red
signal for Celcom to focus on the customer and then to revenue.Because these impacts would
affect following year, 2020. Unfortunately, 2020 is the pandemic year. Therefore, we can
conclude two big challenges for Celcom namely,Curbing subscriber outflow and strives to keep
Malaysians connected during challenging times.
2
VMO: Vision, Mission, and Objectives
2|PageTable 1: Customers, Revenues, and EBITDA Scenario of Celcom Axiata Berhad
Indicators/Year Customers (m) Revenue (b) EBITDA (b)
2015 8.5 7.3 2.7
2016 9.1 6.6 2.3
2017 9.5 6.6 2.3
2018 9.1 7.3 1.9
2019 8.4 6.7 2.6
Figure 1: Customers, Revenue, and EBITDA of Celocm Axiata Berhad
Customers, Revenue, and EBITDA of Celcom Axiata Berhad
10 9.1 9.5 9.1
8.5 8.4
8 7.3 7.3
6.6 6.6 6.7
6
4 2.7 2.3 2.3 2.6
1.9
2
0
2015 2016 2017 2018 2019
Customers (m) Revenue (b) EBITDA (b)
Two main challenges for Celocm Axiata Berhad.
I. Curbing Subscriber Outflow Remains A Challenge For Celcom
It is said that the largest profit contributor is the Celcom. But whole subscriber outflow depends
on the network coverage by the Celcom. Since there are many other competitors like Telekom
Malaysia; Celcom; Maxis Communications; Time dotcom;U Mobile; U Telecom; DiGi; TM
Touch; TM Cellular; TRI Celcom; Keretapi Tanah Melayu Berhad (KTMB); TMNet;
MyRepublic etc. Therefore, to generate a handsome subscriber outflow remains challenges for
Celcom among the competitors.
II. Celcom Strives to Keep Malaysians Connected During Challenging Times
3|PageTo support all Malaysians during the COVID-19 pandemic, Celcom Axiata Berhad (Celcom)
is dedicated to ensuring its customers can remain connected while staying safe at home during
these hard times. As many Malaysians would also be working from home, contributing to social
distancing efforts, Celcom extends its support via digital online services and additional special
relief initiatives for all customers, during the Movement Control Order period.
1.4 The Vision, Mission, And Objectives (VMO) And Value Statements of
Celcom
Mission
Vision
New generation Advancing Asia
digital champion
by 2020
Celcom Axiata
Berhad
Values
Objective
Uncompromising
The 4Ps exceptional
performance
1.5 Focus, Clear and Motivate Analysis for Vision and Mission Statements
Focus, clear and motivation are the most important elements for gaining VMO of any
organization. A company should be more proactive in terms of achieving the VMO. In line
with that Maxis should be more focus to their target, more focus to their activities, and be
motivated to achieve those activities (Johnson et al., 2016),
1.6 SMART Analysis of The Goals and Objectives
SMART is an acronym that can be used to guide goal setting of any units. Its criteria are
commonly attributed to Peter Drucker's Management by Objectives concept. The first known
use of the term occurs in the November 1981 issue of Management Review by George T.
4|PageDoran. Since then, Professor Robert S. Rubin (Saint Louis University) wrote about SMART in
an article for The Society for Industrial and Organizational Psychology. He stated that SMART
has come to mean different things to different units. SMART analysis for Celcom following
vision, mission and objectives are given below.
Table 1: SMART Analysis of Celcom
Celcom vision, mission, and To build a profitable enterprise that maximizes investors
objective statement return. employer. standing abroad. To maintain the highest
levels of transparency, integrity and professionalism
providing services in the telecom industry, Malaysia.
S = Specific Celcom’s vision, mission and objective appear specific as it
desires to the market leader in Malaysia.
M = Measurable Ultimate goal of the Celcom is to maximize stakeholder’s
values and so it should be countable, percentage, and
measurable.
A = Attainable Whatever Celcom do make plan, it should be attainable and
to be gained. Therefore, VMO should be towards the
direction. It can segment the target like for each quarter. It
would be the easier to achieve the VMO.
R =Realistic Celcom must be focus on the realistic. It has to check
whether it achieve its expected and targeted goal or not.
More specially, target should be close to the real values.
T = Time-bound Time budgeting is the most important approach for any kind
of activities. Celcom should be more specific in fixing time.
Proposed Vision and Mission Statement for Celcom:
“To be responsible digital global market leader in ASIA and to be the best employer of the
people by the year 2025”
5|Page2.0 Macro Environmental Analysis – PESTLE
There are a number of reasons why PESTLE is important for the organization. PESTLE
analysis is a method that helps to reduce probable business risk and threats. By examining the
PESTLE, firms will gain valuable advantages potential support to run the business properly.
These advantages help with the idea phase, product development, product launching, content
marketing strategies, and other factors, to increase success.
Table 2: PESTEL Analysis
Political scenario of Malaysia compared to other ASEAN countries i.e.,
Bangladesh, India, Pakistan, Indonesia etc. is very good and favorable for
business activities. in line with that Maxis is getting good support from the
government in doing business.
Political
6|PageInterest rates, inflation, GDP, and taxes affect the telecommunication
industry. Those factors directly and indirectly affect the business activities.
Inflationary impact force the company to raise the value of the products,
however, it negatively impacts on the business activities. GDP of any country
motivate company for making investment and expand their operation. It
positively impacts to the business activities. Taxes negatively impact business
Economic activities while they impose it to the final users or customers.
Social culture is another important factor impacting to the business activities.
without integration of the society, any business cannot be gain or success in
life. Because society is the part and parcel of the business life.
Social cultural
Technology means advancement of the world. At present it has brought a
remarkable change in the business activities. It has reduced the manpower,
Technology time, money, increase efficiency, skill, productivity, speed of the works, etc.
therefore, nobody can ignore or deny the importance of the technology.
7|PageLegal system is a procedural system that should be followed by all companies.
By the way, telecom industry needs to abide by the rules and regulation of the
Legal region. Specially for the Celcom, it has to follow the rules and regulation that
formulated by the government of Malaysia. Legal system helps them to
protect the rights of suppliers, buyers, others concerned parties and in doing
international business.
Climate changes and global warming can affect how telecommunication
Environmental products reach customers. In terms of employment, with technology
advancing, employees need to adapt to changes.
8|Page3.0 Micro Environmental Analysis – Porter’s 5 Forces
Table 3: Porters 5 Forces Model
The main bargaining power of the supplier implies, anytime they can
move to other company. This is the main concept of the bargaining
power of subscribers. Following table shows the two years subscriber
rate.
Subscribers(m)
Bargaining power of
Celcom Digi Maxis
subscribers
2019 8.4 11.28 9.68
2018 9.1 11.66 9.87
Based on the above table, number of subscribers for Celcom is lower
compared to its competitors, Digi and Maxis. Therefore, Celcom need
to give more focus on their corporate strategy. They have to focus of
their customers interest at the time formulating corporate strategy.
Bargaining power of The bargaining power of the suppliers imply that they have available
suppliers and good quality materials, information, low switching cost, however,
they enforce the terms and condition against the company.
Threats of newcomer into the market and tries to get market share. For
example, another new operator can come to the market and divers the
Threat of new entrant
services to the customers. More number of new competitors will make
it difficult to exploit the market opportunity of new market.
Threat of substitute Competitors provide same types of products. Whereas customer will get
product the options to choose the products.
9|PageWars among the telecom industry for gaining customers share to
increase revenue and profit. For an example competitor want to reduce
call price so that they can get good customer response towards the
company.
Five years comparative analysis of Celcom, Digi and Maxix
Inventory turnover Asset Turnover
Competitive rivalry
Year Celcom Digi Maxis Celcom Digi Maxis
2015 1.751 1.226 2.327 0.380 0.640 0.460
2016 1.597 1.224 2.453 0.340 0.640 0.450
2017 1.636 1.240 2.751 0.350 0.610 0.450
2018 1.602 1.178 2.608 0.360 0.560 0.470
2019 1.491 1.243 2.670 0.380 0.520 0.450
As shown above table, inventory turnover rate is lower compared to
maxis, asset turnover rate is lower compared to digi and maxis and
leverage. Therefore, it concluded that competitive of Celcom is in better
positive. So, it becomes threats of competitive rivalry.
4.0 Capability Analysis
4.1 Value Chain
Value chain is the most important system for any company. This defines as the system that
create value for the company. For example, in case of Celcom, there are a number value chain
process such as inbound logistics, operation, outbound logistics, sales and marketing and sales.
All are impact on the Celcom operation and ultimately on its performance simultaneously.
Details explanation are given below.
Table 4: Value Creation Process of Celcom
Enterprise resource planning of Celocm. This is one the most
Inbound logistics (supplier) important part of the Celcom. It must properly handle this
part. Since its whole operations depend on it.
10 | P a g eEnterprise resource management of Celcom. How Celcom
process their products and services for the customers. Their
performance is also mostly depending on here. How they can
Operations
efficiently and effectively handle their operation, cost
minimize, and smartly use of its available resources.
Enterprise resource planning of Celocm. After operation,
Outbound logistics (dealer) Celcom provides their products and services to the
customers.
Website and database management system. This is another
important tool. Celcom must make advertisement in
Sales and marketing
effective and efficient way so that they can show their
products and services better than others
Website, M-commerce, and customer relationship
management. How Celcom able to reach customers. How
they can provide services to customers. Based on their
services, customer switching cost would depend. Better
services mean higher switching cost and vice versa.
Service
11 | P a g e4.2 Resource Audit
Resources Competencies
1.Celcom is operated in Malaysia under 1.Their tremendous and quality
the mother company of Axiata Group services make them to access to
Berhad. This is basically ASEAN based cross countries. More specially,
telecom company operated in 10 counties Celocm operated in Malaysia
along with 290 million subscribers. and it works in all states of
Malaysia.
2. Financial position of Celcom from 2015 to
2019 is reported in the following table. 2. Based on the financial
information that is reported in
2015 2016 2017 2018 2019
Threshold the table, it is implies that
Net margin 7.02 10.22 8.32 11.53 11.32
Return on asset managerial skill and their
(ROA) 8.8 12.82 9.47 13.77 13.11
Return on
invested capital competency cannot be denied.
(ROIC) 12.61 18.1 13.15 18.64 17.45
Quick ratio 1.58 1.54 1.61 1.86 2.16
Intellectual capital such as
Financial
leverage 1.62 1.57 1.6 1.55 1.48 technological capital and human
Days sales
outstanding 42.63 48.51 50.28 46.13 43.53 capital help Celcom to be a
Payable days 36.91 52.6 56.24 51.01 45.76
leading telecom services
provider among other computers
in Malaysia.
Celcom wins best consumer satisfaction Celcom committed to provide
award from Malaysian Communication better and better services to the
and Multimedia Commission (MCMC). customers, however, try to make
According to the Telco, the award greatly them loyal customers for the
Distinctive signifies the company’s steadfast brand company. Their efforts,
promise to constantly improve customer efficiency, and hard work make
experience and ensure digital protection as them to have great award named
the Telco’s utmost priority and “customer satisfaction award”
importance. from MCMC.
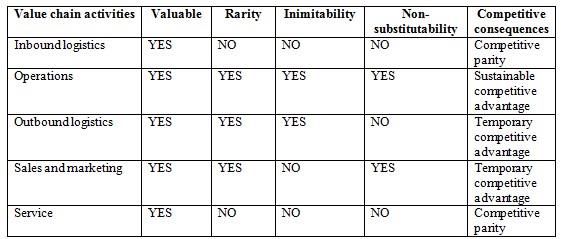
12 | P a g e4.3 Valuable, Rare, Inimitable, and Organization (VRIO)
I. Valuable:
Valuable implies that unique services are provided by the Celcom. That can benefit them to
have potentiality from the market. Celcom provides valuable things meanwhile customer able
to pay money in-exchange.
II. Rare:
Rare states that whatever Celcom provides now are limited by them and so other operators have
limited access to this. This can help Celcom to have competitive advantages as well. in this
situation, Celcom get earn a large number margin yearly.
III. Inimitable:
Inimitable implies that whatever Celcom is providing to the customer those products and
services patent licence and nobody can imitate that. For example, H&M, P&G Adidas, Puma
etc.
IV. Organizational Focus:
“Are a firm’s other policies and procedures organized to support the exploitation of its
valuable, rare, and costly to imitate resources?” Organizational focus, then, refers to integrated
and aligned managerial practices, routines, and processes.
4.3.1 VRIN Based on The Value Chain Analysis Above
Following table shows the value chain process along with VRIN factors
13 | P a g e4.3 Key Performance Indicators (KPIs) Benchmarking
I. Average Revenue Per User (ARPU)
Average revenue per user (ARPU), sometimes known as average revenue per unit, is a measure
used primarily by customers, defined as the total revenue divided by the number of subscribers
(McCloughan, and Lyons, 2006).Based on the following figure, there is a tremendous growth
in APRU from 2016 to 2019. Meaning that Celcom is doing well along with compare with Digi
of their business strategy. Among the figures, the lowest ARPU is in 2016 while the highest
ARPU is in 2019.
Figure 1: Average Revenue Per User (ARPU) of Celcom
60
50
40
30 Celcom
20 Digi
10
0
2015 2016 2017 2018 2019
II. Churn Rate
14 | P a g eChurn rate is one kind of measurement of customers leaving the company in a specific given
time. In a broader sense, in a year how many people leaving Celcom that is called the Churn
rate. This is the most important for the company since it provides a hint to the company to
calculate their probable and potential customers for the particular time. Current churn rate of
Celcom is 6.7% per month. But they should minimise it by increasing ARPU rate, however,
there is an inverse relationship between churn rate and ARPU (Dahiya, and Bhatia, 2015)
B. Other Performance Indicators of Celcom and Digi
Following table shows 7 performance indicators for the Celcom and Digi. Based on that 7
figures have been drawn (e.g., Figure B1- FigureB7)
Table 5: Others Performance Indicators of Celcom and Digi
Indicators/ Years Celcom Digi
2015 2016 2017 2018 2019 2015 2016 2017 2018 2019
Net margin 7.02 10.22 8.32 11.53 11.32 19.2 21.5 24 26.7 21.7
Return on asset (ROA) 8.8 12.82 9.47 13.77 13.11 18.9 22.8 27.1 28.5 19.3
Return on invested capital
(ROIC) 12.61 18.1 13.15 18.64 17.45 30.2 34.7 41 42 26.1
Quick ratio 1.58 1.54 1.61 1.86 2.16 2.74 2.01 1.61 1.5 1.68
Financial leverage 1.62 1.57 1.6 1.55 1.48 1.5 1.57 1.52 1.49 1.68
Days sales outstanding 42.63 48.51 50.28 46.13 43.53 24.6 24.8 18.3 19 25.7
Payable days 36.91 52.6 56.24 51.01 45.76 79 81.3 75.5 74.4 74.5
Sources: Annual Report Axiata and Digi
Net margin
100
50
0
2015 2016 2017 2018 2019
Celcom 36.91 52.6 56.24 51.01 45.76
Digi 79.02 81.31 75.48 74.39 74.54
Celcom Digi
Figure B-1: Net margin
15 | P a g eReturn on asset (ROA)
100
50
0
2015 2016 2017 2018 2019
Celcom 36.91 52.6 56.24 51.01 45.76
Digi 79.02 81.31 75.48 74.39 74.54
Celcom Digi
Figure B-2: Return on asset (ROA)
Return on invested capital (ROIC)
100
80
60
40
20
0
2015 2016 2017 2018 2019
Celcom 36.91 52.6 56.24 51.01 45.76
Digi 79.02 81.31 75.48 74.39 74.54
Celcom Digi
Figure B-3: Return on invested capital (ROIC)
Quick ratio
100
80
60
40
20
0
2015 2016 2017 2018 2019
Celcom 36.91 52.6 56.24 51.01 45.76
Digi 79.02 81.31 75.48 74.39 74.54
Celcom Digi
Figure B-4: Quick ratio
16 | P a g eFinancial leverge
100
80
60
40
20
0
2015 2016 2017 2018 2019
Celcom 36.91 52.6 56.24 51.01 45.76
Digi 79.02 81.31 75.48 74.39 74.54
Celcom Digi
Figure B-5: Financial leverage
Days sales outstadings
100
80
60
40
20
0
2015 2016 2017 2018 2019
Celcom 36.91 52.6 56.24 51.01 45.76
Digi 79.02 81.31 75.48 74.39 74.54
Celcom Digi
Figure B-6: Days sales outstanding
Payable days
100
80
60
40
20
0
2015 2016 2017 2018 2019
Celcom 36.91 52.6 56.24 51.01 45.76
Digi 79.02 81.31 75.48 74.39 74.54
Celcom Digi
Figure B-7: Payable days
5.0 Proposed Strategy
This strategy is discussed based on the based on the SWOT, TOWS, and Ansoff matrix. Details
discussion of those are given below.
17 | P a g e5.1 Strength, Weakness, Opportunity, and Threats (SWOT) Analysis for Celcom
In the following table 6, SWOT analysis is divided into two parts namely internal and external.
Mikhaylova, Balynin, and Nizhneva, (2019), and Gupta, Raghav, and Dhakad, (2019)
Table 6: SWOT Analysis of Celcom
Internal analysis
Strength: Cheapest post-paid plan Weakness: Market share
This plan is most suitable for user Celcom lost their market share
who are only allocated with compared to the operators. It only
minimum budget for the monthly subscribes only 31%
phone bill.
Offer the lowest post-paid plan in
Malaysia with commitment fees as
low as RM20 per month
External analysis
Opportunity: Growth in global tele Threats: Subscriber war business
connection industry practises
Celcom claims to have the widest and
the most expensive coverage To responds to the user needs, the
nationwide, compared to other industry engaged in
cellular services in Malaysia
Expansion of users
5.2 Threats, Opportunity, Weakness and Strength (TOWS) Analysis for Celcom
Following Table 7 shows the TOWS analysis for the Celcom.
Table 7: TOWS Analysis of Celcom
Strength Weakness
18 | P a g eSO-maxi-maxi strategy WO-mini – maxi strategy
Strategies that use strengths to Strategies that use to minimize threats
Opportunities maximize potential and other unexpected future
opportunities. occurrences.
ST-maxi-mini strategy WT- mini-mini strategy
Threats Strategies that minimize Strategies that use to minimize
weaknesses by taking weaknesses and avoid threats.
advantage of opportunities.
Sources: Jayashree, Abdelelah, and All, (2010)
I. Strength and Opportunity (SO-Maxi-Maxi) Strategy
Maxi- maxi implies the win-win situation of the company. At the same time, they can apply or
use strength and potential opportunities of the company. Those companies able to apply this
maxi-maxi condition, they can get their optimum outcome. Any company would like to be in
a position where it can maximize both, strengths, and opportunities (Jayashree, Abdelelah, and
All, 2010).
II. Strength and Threats (ST-Maxi-Mini) Strategy
By applying the corporate strategy, Celcom tries to avoid probable threats and risk. Therefore,
it is called maxi-mini strategy. Moreover, this strategy is based on the strengths of the
organization that can deal with threats in the environment (Jayashree, Abdelelah, and All,
2010).
III. Weakness and Opportunity (WO-Mini-Maxi) Strategy
The second strategy attempts to minimize the weaknesses and to maximize the opportunities.
A company may identify opportunities in the external environment but have organizational
weaknesses which prevent the firm from taking advantage of market demands (Jayashree,
Abdelelah, and All, 2010).
19 | P a g eIV. Weakness and Threats (WT-mini-mini) Strategy
In general, the aim of the WT strategy is to minimize both weaknesses and threats. A company
faced with external threats and internal weaknesses may indeed be in a precarious position. In
fact, such a firm may have to fight for its survival or may even have to choose liquidation. But
there are, of course, other choices (Jayashree, Abdelelah, and All, 2010).
5.3 Ansoff’s Matrix
Ansoff matrix is important and necessary matrix that benefits a company by knowing current
and existing products and market. Following Table 7 and discuss state that how Ansoff matrix
work.
Table 7: Ansoff Matrix of Celcom
Existing Market Product
penetration development
Market
New Market development Diversification
Existing New
Products
I. Market Penetration
Market Penetration is the lowest risk since it combines existing products and existing market.
In case of the Celcom, they play with their current products and within the current market share.
The company Celcom Berhad held about 27 percent of the mobile telecommunications market
revenue in Malaysia. By comparison, Maxis Bhd ranked first with a market share of about 34
percent (Moussetis, 2011) and (Mecha, 2007).
20 | P a g eII. Product Development
Product development is the strategy suggested by the Ansoff matrix. It encourages the company
to introduce new product in the current market. This strategy suggests the product portfolio
expansion to the companies. In the telecom industry, companies adopt this strategy by investing
more on R&D and get to know the needs and demands of the market. For example, in end of
2015, Celcom launched two products such as Xpax and Magic sim (Moussetis, 2011) and
(Mecha, 2007).
III. Market Development
It is a moderate risk strategy that show company can play around with the current market but
new products. Meanwhile company’s R&D division should be more proactive in terms of
launching new products. They need to check weather market wants that products or not
(Moussetis, 2011) and (Mecha, 2007).
IV. Diversification
This strategy is recognized as the high risk for the company since works with the new products
and new market. Although company expand their operation, high probable risk would be there.
R&D division of the Celcom should work strongly before starting initiative for launching new
products into new market (Moussetis, 2011) and (Mecha, 2007).
6.0 Strategy Evaluation
There are three criteria for the strategic evaluation such as sustainability, suitability, and
feasibility. SAFe criteria and techniques of evaluation are discussed in the following.
Table 8: Strategy Evaluation of Celocm
21 | P a g eI. Suitability of Proposed Strategies
Suitability is concerned with whether an alternative addresses the key issues relating to the
strategic position of the Celcom. It depends on the several criteria such as techniques: PESTEL,
5-Forces, Strategic Groups, Value Chain, Core Competences, Stakeholder Mapping, Cultural
Web. Relative suitability: SWOT analysis, ranking, decision trees, scenarios.
II. Acceptability of Proposed Strategies
Acceptability is concerned with the expected performance outcomes of a strategic option.It
depends on the several criteria. Such as Return: profitability, cost-Benefit. real Options-
Strategic Flexibility (redefinition of industry attractiveness & analysis of resources and
capabilities). Example: hotel industry, shareholder Value Analysis (Total Shareholder Return
& Economic Value Added), risk such as financial Ratios Projections and sensitivity Analysis
andstakeholder reactions.
III. Feasibility of Proposed Strategies
Feasibility is concerned with whether Celcom has the resources and capabilities to deliver a
strategy; in other words, if it could work in practice.It depends on the several criteria namely,
funds Flow Forecasting, Break-Even Analysis, and resource deployment, for staying in
business and for competing successfully.
22 | P a g e7.0 Conclusion and Recommendation
This assignment is conducted on Celcom Axiata Berhad, specially focusing on the strategy.
Two main current strategic challenges [i.e, curbing subscriber outflow and Celcom strives to
keep Malaysians connected during challenging times (COVID-19)] are discussed. For details
discussion of the strategy of Celcom several analyses are reviewed and discussed. To the name
of few, macro analysis (PESTEL), micro analysis (Porters five force model), capability
analysis, proposed strategy, and strategic evaluation. Celcom needs to focus on the discussed
factors so that they can provide competitive and superior products and services to the
customers.
References
Alharbi, M., Dowling, P.J. and Bhatti, M.I., 2019. Strategic planning practices in the
telecommunications industry: evidence from Saudi Arabia. Review of International
Business and Strategy.
Almossawi, M.M., 2012. Customer satisfaction in the mobile telecom industry in
Bahrain: Antecedents and consequences. International Journal of Marketing Studies,
4(6), p.139.
Antoni, Y. and Asvial, M., 2019, June. Strategy of National Fiber Optic Backbone
Network Utilization Enhancement in Rural Area of Indonesia. In 2019 IEEE
International Conference on Innovative Research and Development (ICIRD) (pp. 1-8).
IEEE.
Asadpourian, Z., Rahimian, M. and Gholamrezai, S., 2020. SWOT-AHP-TOWS
Analysis for Sustainable Ecotourism Development in the Best Area in Lorestan
Province, Iran. Social Indicators Research, pp.1-27.
Asadpourian, Z., Rahimian, M. and Gholamrezai, S., 2020. SWOT-AHP-TOWS
Analysis for Sustainable Ecotourism Development in the Best Area in Lorestan
Province, Iran. Social Indicators Research, pp.1-27.
23 | P a g eBuzdar, M.F., Janjua, S.Y. and Khurshid, M.A., 2016. Customer-based brand equity
and firms' performance in the telecom industry. International Journal of Services and
Operations Management, 25(3), pp.334-346.
Dahiya, K. and Bhatia, S., 2015, September. Customer churn analysis in telecom
industry. In 2015 4th International Conference on Reliability, Infocom Technologies
and Optimization (ICRITO)(Trends and Future Directions) (pp. 1-6). IEEE.
Ghosh, D.P., 2019. Commercial & Industrial sector for Energy Storage Solutions in
India: A Case Study of Exicom Power Solutions.
Gizelis, C.A., Mavroeidakos, T., Marinakis, A., Litke, A. and Moulos, V., 2020, June.
Towards a Smart Port: The Role of the Telecom Industry. In IFIP International
Conference on Artificial Intelligence Applications and Innovations (pp. 128-139).
Springer, Cham.
Gupta, A., Raghav, K. and Dhakad, P., 2019. The Effect on the Telecom Industry and
Consumers after the Introduction of Reliance Jio. International Journal of Engineering
and Management Research (IJEMR), 9(3), pp.118-137.
http://docshare.tips/swot-analysis-for-celcom_57523f80b6d87f227e8b45a6.html,
accessed on 16/07/2020
https://ansoffs.com/ansoff-matrix-of-telecom-industry/, accessed on dated 19/07/2020
https://pestleanalysis.com/pestle-analysis-of-the-telecommunication-industry/,
accessed on dated 16/7/20
https://www.coursehero.com/file/p1ppvuhv/Celcom-Axiata-Berhad-is-a-subsidiary-
company-under-Axiata-Group-Berhad-The/, accessed on 18/07/2020
https://www.uhu.es/45122/temas/P&SC/Theme4_P&SC.pdf, accessed on dated
20/07/2020
24 | P a g eJasni, N.S., Yusoff, H., Zain, M.M., Yusoff, N.M. and Shaffee, N.S., 2019. Business
strategy for environmental social governance practices: evidence from
telecommunication companies in Malaysia. Social Responsibility Journal.
Jayashree, S., Abdelelah, M.E. and All, S., 2010, November. A TOWS analysis of
wireless telecommunication industry for global market expansion strategies—A case
study. In 2010 International Conference on Education and Management Technology
(pp. 586-590). IEEE.
Jayashree, S., Abdelelah, M.E. and All, S., 2010, November. A TOWS analysis of
wireless telecommunication industry for global market expansion strategies—A case
study. In 2010 International Conference on Education and Management Technology
(pp. 586-590). IEEE.
Mecha, P.M., 2007. A study of strategy choice at the Kenya Pipeline Company using
Ansoff's grand strategies matrix (Doctoral dissertation, University of Nairobi).
Moussetis, R., 2011. Ansoff revisited. Journal of Management History.
25 | P a g eYou can also read


