Research on Differential Metabolites in Distinction of Rice (Oryza sativa L.) Origin Based on GC-MS
←
→
Page content transcription
If your browser does not render page correctly, please read the page content below

Hindawi
Journal of Chemistry
Volume 2019, Article ID 1614504, 7 pages
https://doi.org/10.1155/2019/1614504

Research Article
Research on Differential Metabolites in Distinction of Rice (Oryza
sativa L.) Origin Based on GC-MS

          Yuchao Feng,1 TianXin Fu,1 Liyuan Zhang ,1,2 Changyuan Wang ,1,2
          and Dongjie Zhang 1,2
          1
              College of Food Science, Heilongjiang Bayi Agricultural University, Xinfeng Lu 5, Daqing 163319, China
          2
              Key Laboratory of Agro-Products Processing and Quality Safety of Heilongjiang Province, Daqing 163319, China

          Correspondence should be addressed to Changyuan Wang; byndwcy@163.com and Dongjie Zhang; byndzdj@126.com

          Received 14 October 2018; Accepted 18 December 2018; Published 15 January 2019

          Academic Editor: Victor David

          Copyright © 2019 Yuchao Feng et al. This is an open access article distributed under the Creative Commons Attribution License,
          which permits unrestricted use, distribution, and reproduction in any medium, provided the original work is properly cited.
          The analytical method for the metabolomics of the 60 rice seeds from two main rice origins in Heilongjiang Province was
          developed based on gas chromatography coupled with mass spectrum. The specific differential metabolites between two rice
          origins were identified, and the distinguish of the two main origins was illustrated by using the R software platform with XCMS
          software package for gas chromatography coupled with mass spectrum data processing, combined with multivariate statistical
          analysis software. The result indicated that the 173 peaks were detected, and 54 of which were structurally identified, covering
          amino acids, aliphatic acid, sugar, polyols, and so on. By comparing the data of Wuchang and Jiansanjiang origins, it was found
          that there were 9 special metabolites in Wuchang origin and 8 special metabolites in Jiansanjiang origin. The 10 differential
          metabolites with significant changes (P < 0.05, VIP ≥ 1) were filtrated. It is indicated that the differential metabolites of rice carry
          information of their origin and there are the differences in the metabolites of rice in two main origins. The proposed method is
          expected to be useful for the metabolomic researches of rice.

1. Introduction                                                          platform for the identification of agricultural products.
                                                                         Nicholson et al. had studied the metabolomics of Arabi-
Metabonomics is the science of taking low-molecular weight               dopsis thaliana in different origins and found that the dif-
metabolites in biological samples (such as organic acids, fatty          ferences of the growth environment could make differences
acids, amino acids, and sugar) as the research object,                   in the amino acids and sugars of Arabidopsis thaliana [7].
through high-throughput detection and data processing,                   Giansante et al. [8] analyzed composition and content of
information integration, and biomarker identification [1].                fatty acid of olive oil from four different origins in an Italian
Since the concept of metabolomics was put forward by                     by using gas chromatography. The results showed that the
Oliver [2] in 1997, metabolomics has been widely applied in              content of palmitic acid and linoleic acid in the olive oil
various fields, becoming a powerful means to explore the                  existed significant differences in different origins. With high
inner mechanism of matter [3]. As people emphasis on food                resolution,      sensitivity,   and     reproducibility,     gas
safety, identification or trace of origin of agricultural                 chromatography-mass spectrometry (GC-MS) has become
products becomes the focus of research in recent years, and              one of the main analytical platforms in metabolomic re-
mineral elements fingerprints analysis [4] and isotope fin-                search [9].
gerprint analysis [5] are a commonly used means.                             Rice (Oryza sativa L.) is an important food crop, rich in
    And metabolomics, from the point of view of biology,                 nutrients and essential trace elements, suitable for human
the overall qualitative and quantitative study on all the                needs [10] and has become a hot topic in plant metabolomics
endogenous metabolites in plant, and explain the metabolite              research in recent years [11–16].
changes from the angle of systems biology and biological life                The environment of origin has an important influence on
activity phenomenon [6], will become an effective analytical              the growth of rice, so variety and content of the metabolites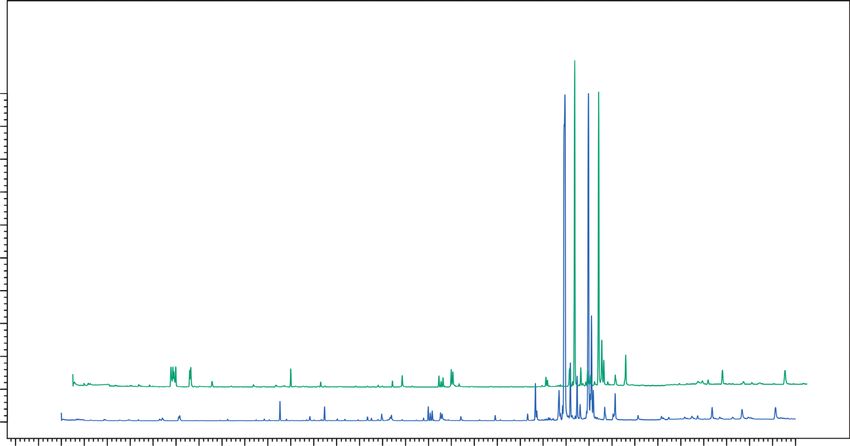
2                                                                                                         Journal of Chemistry

in rice may have the information of origin. The metabolites      of 20 mg·ml−1 methoxyamine hydrochloride in pyridine)
of rice in different origins may exist obvious differences.        followed adding 30 µL BSTFA to derive for 60 min at 70°C.
    In this work, rice seeds from two main rice origins,         All samples were analyzed within 24 h after derivatization
Wuchang farm (WC) and Jiansanjiang farm (JSJ), in Hei-           treatment.
longjiang Province were comparatively analyzed based on the
metabolomics by GC-MS. The results provide a theoretical
basis for the origin identification and distinguish of rice.      2.5. GC-MS Analysis. 1 µL of sample volume was injected
                                                                 with autosampler. Gas chromatography was performed on a
2. Materials and Methods                                         30 m HP-5 ms column with 0.25 mm inner diameter and
                                                                 0.25 mm film thickness (Agilent J&W Scientific). Injection
2.1. Plant Material. Rice plants, Oryza sativa L., were col-     temperature was 280°C, the interface was set to 250°C, and
lected from the two geographical indication rice reserves,       ion source was adjusted to 230°C and quadrupole to 150°C.
which are located in Jiansanjiang farm (JSJ) and Wuchang         Helium (>99.999% purity) was used as the carrier gas set at a
(WC) in Heilongjiang Province. The main varieties were           constant flow rate of 2 mL·min−1. The temperature was 2 min
randomly collected with the checkerboard sampling method         isothermal heating at 80°C, followed by a 10°C·min−1 oven
according to the representative sampling principle [17] in       temperature ramp to 320°C and a final 6 min heating at
the scope of protection. In each sampling point, rice panicles   320°C. The system was then temperature equilibrated for
(Japonica rice, 1-2 kg) were collected according to different     6 min at 80°C prior to injection of the next sample. Full
directions. 30 samples were selected from each origin.           scanning mode was used, and scanning range was 50–550
                                                                 (m/z).
2.2. Chemicals and Materials. Methanol and pyridine
(≥99.0% purity) (chromatographic grade) were purchased           2.6. Data Analysis. GC-MS data analysis was performed at
from Aladdin Reagent Co., Ltd. (Shanghai, China). 2-             Suzhou Bionovogene (Suzhou, China). The original data of
Chlorophenylalanine (98.5% purity), methoxyamine hydro-          GC-MS were pretreated with XCMS software packages in
chloride (98.5% purity), and N,O-bis(trimethylsilyl)             the R software platform. Then, the edited data matrix was
trifluoroacetamide (99%BSTFA + 1%TMCS) were purchased             imported into SIMCA-P software (Umetrics AB, Umea,
from Macklin Reagent Co., Ltd. (Shanghai, China). HPLC-          Sweden) for principal component analysis (PCA) and partial
grade water was obtained from a Milli-Q water purification        least squares-discriminant analysis (PLS-DA) and other
system (Millipore Corp., USA) and used to prepare all aqueous    multivariate statistical analysis. The differences of the sample
solutions. All other reagents of analytical grade were pur-      metabolome between the groups were analyzed through the
chased from Beijing Chemical Factory (Beijing, China).           analysis of PCA and PLS-DA score map, and the difference
                                                                 metabolites were screened according to the difference be-
2.3. Apparatus. The 7890A/5975C GC-MS (Agilent J&W               tween the value of group contribution (VIP) and the sig-
Scientific, USA) equipment was used. Chromatographic              nificance (P < 0.05). Compared with the standard spectrum
separation of metobolites was performed on an HP-5 ms            library of National Institute of Standards and Technology
(30 m × 0.25 mm × 0.25 μm) (Agilent J&W Scientific). Ter-         (NIST) and Wiley Registry metabolomic database, most
movap Sample Concentrator (Automatic Science In-                 metabolites were analyzed. The paraffin retention index of
strument Co., Ltd., China), DHG-9123A drying oven of             metabolites is further qualitative identified based on the
electric heating (Jinghong Laboratory Equipment Co., Ltd.,       retention index provided by the Golm Metabolome Data-
Shanghai, China), FC2K Rice huller (Dazhu Production Co.,        base (GMD). At the same time, most substances were further
Ltd., Japan), Incubator (Senxin Instrument Co., Ltd.,            confirmed by standard products.
Shanghai, China), and TGL-16B High speed centrifuge
(Anting Instrument Co., Ltd., Shanghai, China) were used in      3. Results and Discussion
the experimental procedure.
                                                                 3.1. The Result Analysis of GC-MS

2.4. Sample Preparation. The sample processing method and        3.1.1. GC-MS Total Ion Chromatogram. In all samples, 173
chromatographic method refer to the literatures [18, 19]         peaks were detected, and 54 metabolites (Table 1), including
with slight modifications.                                        11 kinds of sugars, 9 kinds of fatty acids, 12 kinds of polyols,
     Under liquid nitrogen, rice seed was pulverized to obtain   14 kinds of other derivatives, 14 kinds of organic acid, 2
the powdered samples. 50 mg of powdered samples, 800 µL          kinds of amino acids, 1 kind of phosphoric acid, and 1 kind
of methanol, and 10 µL of internal standard (2-chlorphe-         of nucleotide, were identified by analysis of GC-MS raw data.
nylalanine) were mixed by vortex for 30 s. Subsequently, the         The comparison and analysis of the total ion flow
mixture solution was centrifuged at 12,000 rpm for 15.0 min      chromatogram of two groups of samples (Figure 1) showed
at 4°C. After centrifugation, 200 µL supernatant was trans-      that the total ion chromatogram of rice in different origins is
ferred to a GC bottle (1.5 mL automatic sample bottle), and      similar but slightly different. As can be seen from Figure 1,
then the bottle was dried with nitrogen blowing. The dried       the baseline of the peak diagram is stable and the instrument
residue was completely dissolved for 90 min at 37°C (in 30 µL    is in good stability.
Journal of Chemistry                                                                                                               3

        Table 1: Special metabolites of rice in two origins.        group. There are two reasons for the anomaly. One is the
rt                         m/z                  Name                error in the sample pretreatment process, and the other is
                                                                    caused by the large individual difference between the sample
JSJ origin
6.8                    105.08                Benzoic acid           itself and other samples. According to the PCA score map,
15.17                  245.04                Fumaric acid           the samples in the JSJ origin are distributed on the left side of
15.26                  160.09                   Xylose              the confidence interval, and the samples in the WC origin
15.89                  307.06                   Xylitol             are mostly distributed on the right side of the confidence
18.51                  118.10                  Glucose              interval. Explain that there are differences between the two
20.07                  129.13                Myo-inositol           origin samples. There is overlap in the sample group of the
25.62                  319.15                  Sorbitol             Jiansanjiang origin, indicating that the similarity between
33.69                  193.00                  Raffinose              the samples is large, and there is also a large distance between
WC origin                                                           the sample points. It shows that the similarity between
12.72                   60.02             Pentanoic acid            samples is small and the difference is large. Comparison of
19.58                  118.10             Glucopyranose             samples from both regions and comparisons between
22.83                  143.12            Octadecanoic acid
                                                                    samples from the same place indicate differences between
23.51                  138.15             Eicosanoic acid
25.93                  151.09             Docosanoic acid
                                                                    samples.
26.45                  201.04        1-Monohexadecanoylglycerol          For intergroup samples, the samples from the JSJ origin
27.93                  361.13                Trehalose              are distributed on the left side of the confidence interval, while
30.18                  209.00              β-Tocopherol             the samples from the WC origin are mainly distributed on the
33.49                  107.12               β-Sitosterol            right of the confidence interval. It is showed that there were
rt: retention time, min.                                            significant differences between the two groups of samples, but
                                                                    there was still overlap between the samples of similar groups.
                                                                    Through unsupervised principal component analysis, rice
3.1.2. The Differential Metabolites of Rice in Two Origins.          samples from different origins could not be distinguished.
The metabolites common in 30 rice samples were found with
the statistical analysis. A total of 26 metabolites were found in
the WC origin, and 25 were found in the JSJ origin. Remove          3.2.2. PLS-DA Analysis. At the same time as the reducing
the same metabolites, and ultimately, the nine kinds of             dimension, PLS-DA (Figure 3) combines with regression
characteristic metabolites, including pentanoic acid, pyran         model and makes a discriminant analysis of regression results
glucose, stearic acid, eicosanoic acid, docosanoic acid, 1-         with a certain discriminant threshold, which is conducive to
monooctadecyl glycerol, trehalose, β-tocopherol, and β-si-          more efficient discovery of intergroup differences and dif-
tosterol, respectively, were found in WC origin. The 8 kinds of     ferential compounds. This analysis has two main components,
characteristic metabolites, including benzoic acid, fumaric         R2X � 0.715, R2Y � 0.87, and Q2 � 0.629, and the values of the
acid, xylose, xylitol, glucose, inositol, sorbitol, and raffinose,    two principal components are similar. When PLS-DA is used
respectively, were found (Table 1).                                 for data correlation or discriminant model analysis, the re-
                                                                    placement test mode can be used (Figure 4). As can be seen
3.2. The Differences Analysis of Rice Metabonomics in                from Figure 4, the abscissa indicates the displacement re-
     Two Origins                                                    tention of the permutation test (the ratio that coincides with
                                                                    the order of the original model Y variable, and the point where
3.2.1. PCA Analysis. PCA [20] can degrade the data,                 the permutation retention is equal to 1 is the R2Y and Q2
eliminate overlapping information, and explain most in-             values of the original model). The ordinate indicates the value
formation with a small number of factors, so as to distin-          of R2Y or Q2. The green dot indicates the R2Y value obtained
guish similar variables and find differences. A PCA analysis          by the displacement test. The blue square point indicates the
(SIMCA-P) was performed for processing the data of rice             Q2 value obtained by the displacement test. The two broken
samples from two groups to research the effect of different           lines represent the regression lines of R2Y and Q2, respectively.
growth environment on rice metabolites. This analysis has           The original model R2Y is 0.87. Between 0.5 and 1, closer to 1,
three main components. In the PCA part of this paper, the           indicating that the established model is more in line with the
cumulative R2X � 0.664 and Q2 � 0.572. The values of R2X            real situation of the sample data. The original model Q2 is
and Q2 are both greater than 0.5, and the difference between         0.629, which is greater than 0.5, indicating that if a new
the two is less than 0.2. The metrics of the two indicators         sample is added to the model, an approximate distribution
given in the comprehensive literature [21] indicate that the        will be obtained. In general, the original model can better
PCA model has good fit and predictability, and there is no           explain the difference between the two sets of samples. The Q2
overfitting. It is indicated that the fitting accuracy of the         value of the random test for the displacement test is smaller
model is better. As can be seen from Figure 2, except for the 5     than the Q2 value of the original model. The regression line of
abnormal samples, the remaining 55 rice samples are in the          Q2 and vertical axis intercept is less than zero. At the same
confidence interval. The data of the abnormal sample rep-            time, as the retention decreases, the proportion of the
resent that the sample data are quite different from the other       substituted Y variable increases, and the Q2 of the stochastic
sample data of the same group, so the display in the figure          model gradually decreases. It shows that the original model
shows that it is far away from other samples in the same            has good robustness and there is no overfitting phenomenon.
4                                                                                                                                                                          Journal of Chemistry

                                              100
                            Relative intensity (%)   90
                                                     80
                                                     70
                                                     60
                                                     50
                                                     40
                                                     30
                                                     20
                                                     10

                                                           3 4 5 6 7 8 9 10          12   14        16    18 20 22 24             26       28   30   32       34      36
                                                                                                         Retention time (min)
                                                           JSJ17, TIC: 7.29e + 07
                                                           WC23, TIC: 4.48e + 07
                                                                                    Figure 1: GC-MS total ion chromatogram.

         8                                                                                                                 8
         6                                                                                                                 2
         4
                                                                                                                           1
         2
                                                                                                                           0
                                                                                                                   t (2)
t (2)

         0
                                                                                                                       –1
        –2
                                                                                                                       –2
        –4
        –6                                                                                                             –3

        –8                                                                                                             –4
          –15         –10                             –5         0           5      10         15                       –15          –10        –5        0            5      10     15
                                                                     t (1)                                                                                    t (1)

                JSJ                                                                                                            JSJ
                WC                                                                                                             WC

          Figure 2: PCA score plot of samples in two origins.                                                              Figure 3: PLS-DA score plot of samples in two origins.

    In view of the above, it shows that the PLS-DA model has                                                      variable importance in the projection (VIP, the threshold
better predictability and there is no overfitting. Compared                                                        value > 1) of the PLS-DA model coupled with the P value of
with the PCA score chart (Figure 2), Q2 is increased, which                                                       Student’s t-test (t-test, the threshold value ≤ 0.05) were used
indicates that the concentrated repeatability of test is well,                                                    for looking for the metabolites of differential expression. The
and the accuracy of the model is very high.                                                                       rice samples of two origins were analyzed, and the ten
    Figure 3 shows that samples of two groups completely                                                          differential metabolites with significant changes were
separate, no overlapping samples. For intergroup samples, the                                                     screened, covering 4 kinds of fatty acids, 3 kind of other
samples from the JSJ origin are distributed on the left side of                                                   derivatives, a kind of polyols, a kind of sugars, and a kind of
the confidence interval, while the samples from the WC origin                                                      nucleotides, the differences metabolites contain both pri-
are mainly distributed on the upper of the confidence interval.                                                    mary metabolites and also contains the secondary metab-
There are two abnormal samples that are not within the                                                            olites (Table 2). Among the two rice origins, eight differential
confidence interval. It is proved that different origins (growth                                                    metabolites were higher in rice in the WC origin than in the
environment) have a great influence on rice metabolites.                                                           JSJ origin and were upregulated and increased by 1.51–4.24
                                                                                                                  times. The content of glycerol and α-D-Methylfructofur-
                                                                                                                  anoside was lower than in rice in the WC origin than in the
3.2.3. Exploration and Identification of Differential Metab-                                                        JSJ origin and were downregulated and decreased by 0.52
olites between the Two Groups. In this experiment, the                                                            and 0.06 times, respectively.
Journal of Chemistry                                                                                                                                        5

                                                  R2 = (0.0, 0.379), Q2 = (0.0, –0.23)

                                            0.8

                                            0.6

                                            0.4

                                            0.2

                                              0

                                           –0.2

                                           –0.4

                                           –0.6
                                              –0.2        0       0.2     0.4      0.6    0.8             1
                                                                 100 permutations 4 components

                                                     R2
                                                     Q2
                                                     Figure 4: The PLS-DA replacement test chart.

                                            Table 2: The difference metabolites of rice in two origins.
                            Name                              rt (min)             m/z             VIP                P value               log2fc_WC/JSJ
1                         Glycerol                               8.83            205.07           1.069            0.016954881                 −0.9309
2                           Indole                               9.28            117.10           1.130            0.000526404                 +0.6507
3             2,4,6-Tri-tert-butylbenzenethiol                  13.38            117.10           1.050           5.53286E − 08                +2.0843
4                        Thymidine                              14.88             81.07           1.073           4.31061E − 08                +1.6066
5              1,6-Anhydro-beta-D-glucose                       15.82            204.05           1.046           5.18568E − 07                +1.1412
6            alpha-D-Methylfructofuranoside                     16.46            346.05           1.832             0.00037704                 −4.1031
7                    Tetradecanoic acid                         16.64            228.13           1.012            1.3111E − 08                +1.6579
8                9,12-Octadecadienoic acid                      21.10            153.14           1.292            0.004032978                 +0.5987
9            9,12-(Z,Z)-Octadecadienoic acid                    22.48             81.09           1.007            0.003338612                 +1.1760
10                9-(Z)-Octadecenoic acid                       22.54            112.10           1.063           1.59641E − 07                +1.5769
rt: retention time; VIP: the contribution rate of different substances to the PLS-DA model; P value: a significance value for t-test; log2fc_WC/JSJ: log2 of the
ratio of the mean value of the WC origin to the construction of the JSJ origin; +: rising; −: falling.

3.2.4. Hierarchical Cluster Analysis. The data set is scaled by                       The 10 kinds of differential metabolites in two origins
the pheatmap package in R software (v3.3.2), and the bi-                          were analyzed through retrieval of metabolic pathways, and
directional clustering analysis of samples and metabolites                        five differential metabolites, including glycerol, indole,
was conducted. Figure 5 is a hierarchical clustering diagram                      thymidine, myristic acid, and 9-(Z)-octadecanoic acid, were
of relative quantitative values of metabolites in this exper-                     found in target metabolic pathways. The metabolic path-
iment. As can be seen from Figure 5, the heat map is divided                      ways, including the biosynthesis of fatty acids, glycerol
into two parts: red and green, indicating that the content of                     metabolism, the biosynthesis of phenylalanine, tyrosine, and
metabolites is very different, and the difference between                           tryptophan, galactose metabolism, and pyrimidine meta-
them is obvious. At the top of the graph is the clustering of                     bolism, were found and matched. It is indicated that the
samples in two origins, and it can be found that the clus-                        difference of origins has an obvious effect on the various
tering effect is very good, the samples on the left are from                       terminal metabolic pathways of rice.
mainly JSJ origin, and the samples on the right are from the
WC origin. It can be seen that, through ten differential                           4. Conclusions
metabolites of the selection, the samples in two origins can
be distinguished and the results are good.                                        In this experiment, the metabonomics of rice seeds in two
                                                                                  main rice origins (JSJ and WC) in Heilongjiang Province
                                                                                  were researched based on the GC-MS, 173 peaks were de-
3.2.5. The Pathway Analysis of Differential Metabolites.                           tected, and 54 metabolites were identified. Compared with
The related metabolic pathway analysis was carried out on                         the two origins, 9 unique metabolites were found in WC
the differential metabolites of two rice origins by using the                      origin, 8 of which were unique metabolites in JSJ origin, and
enrichment analysis of MetaboAnalyst and metabolic                                the 10 differential metabolites of distribution between JSJ
pathway retrieval of KEGG [22]. Five metabolic pathways                           and WC origins were selected. It is proved that the me-
were found, and the specific information is shown in Table 3.                      tabolites of rice in a different origin carry the information of
6                                                                                                                                    Journal of Chemistry

                                                                                                                            Class
                                                                                                                            2,4,6-Tri-tert-butylebenzenethiol     4
                                                                                                                            thymidine
                                                                                                                            1,6-Anhydro-beta-D-glucose            2
                                                                                                                            tetradecanoic acid
                                                                                                                                                                  0
                                                                                                                            9,12-(Z,Z)-Octadecadienoic acid
                                                                                                                            9-(Z)-Octadecenoic acid               –2
                                                                                                                            indole
                                                                                                                            9,12-Octadecadienoic acid             –4
                                                                                                                            Glycerol
          JSJ1
          JSJ2
          JSJ13
          WC7
          JSJ12
          JSJ5
          JSJ10
          JSJ23
          JSJ6
          JSJ9
          JSJ11
          JSJ8
          JSJ24
          JSJ20
          JSJ22
          JSJ19
          JSJ17
          JSJ21
          JSJ15
          JSJ18
          JSJ14
          WC19
          JSJ26
          JSJ7
          WC8
          WC20
          JSJ16
          JSJ25
          JSJ3
          JSJ4
          WC21
          WC9
          JSJ27
          WC22
          WC4
          JSJ30
          JSJ29
          WC11
          JSJ28
          WC10
          WC16
          WC29
          WC2
          WC25
          WC15
          WC17
          WC14
          WC13
          WC23
          WC12
          WC3
          WC24
          WC26
          WC27
          WC1
          WC28
          WC30
          WC29
          WC4
          WC6
          W18
          WC5
                                                                                                                            alpha-D-Methylfructofuranoside

         Class
                 JSJ

                 WC

                                      Figure 5: The hierarchical cluster diagram of differential metabolites.

                                           Table 3: Metabolic pathways of the differential metabolites.
Metabolic pathways                                                Total       Expected         Hits        Raw p          Compounds                             Pathway
Fatty acid biosynthesis                                            47          0.20668          2         0.01545        C00712, C06424                         osa00061
Glycerolipid metabolism                                            14         0.061566          1         0.06017           C00116                              osa00561
Phenylalanine, tyrosine, and tryptophan biosynthesis               22         0.096746          1         0.09323           C00463                              osa00400
Galactose metabolism                                               26          0.11434          1         0.10941           C00116                              osa00052
Pyrimidine metabolism                                              39           0.1715          1          0.1604           C00214                              osa00240
Total: the total number of metabolites in the target metabolic pathway; hits: the number of differential metabolites in the target metabolic pathway; raw p: P
value of the hypergeometric distribution test; Holm adjust: P value after false-positive correction; compounds: number of differential metabolites in KEGG;
pathway: number of metabolic pathways in KEGG.

their origin, and the difference of metabolites is feasible for                   Changyuan Wang and Yuchao Feng drafted the manuscript.
the distinguishing of rice origins. The purposed method is                       Dongjie Zhang revised the manuscript.
feasible for the separation and identification of metabolites
in rice seeds. Compared with the literatures [19, 23], the
origin has an effect on rice metabolites, and the metabolites
                                                                                 Acknowledgments
will be different in different origins. The method can be used                     This study was funded by the Heilongjiang Province Post-
for the isolation and identification of metabolites in rice                       doctoral Science Foundation (Grant no. LBH-Z15217),
seeds. The analysis of metabolic pathways shows that the                         Science and Technology Research Project of Heilongjiang
difference of origins has an obvious effect on the various                         Agricultural Reclamation Administration (Grant no.
terminal metabolic pathways of rice. This research provides a                    HNK135-05-01), Special Funding of Postdoctoral in Hei-
reference for plant metabolomics. So it seems possible to                        longjiang Bayi Agricultural University, the Innovation Fund
extend this method to the separation and identification of                        of Postgraduate in Heilongjiang Bayi Agricultural Univer-
the metabolites in other similar samples by varying the                          sity, and Program for Young Scholars with Creative Talents
experimental conditions.                                                         in Heilongjiang Bayi Agricultural University (Grant no.
                                                                                 CXRC2017011).
Data Availability
The data used to support the findings of this study are                           References
available from the corresponding author upon request.
                                                                                  [1] P. F. Wang, Q. Q. Wang, X. E. Li, and M. J. Qin, “Metabolites
                                                                                      research of Corydalis yanhusuo tubers with gas
Consent                                                                               chromatography-mass spectrometry,” Chinese Bulletin of
Informed consent was obtained from all individual partic-                             Botany, vol. 47, no. 2, pp. 149–154, 2012.
                                                                                  [2] S. G. Oliver, “Yeast as a navigational aid in genome analysis,”
ipants included in the study.
                                                                                      Microbiology, vol. 143, no. 5, pp. 1483–1487, 1997.
                                                                                  [3] S. Rezzi, Z. Ramadan, F.-P. J. Martin et al., “Human metabolic
Conflicts of Interest                                                                 phenotypes link directly to specific dietary preferences in
The authors declare that they have no conflicts of interest.                           healthy individuals,” Journal of Proteome Research, vol. 6,
                                                                                      no. 11, pp. 4469–4477, 2007.
Authors’ Contributions                                                            [4] B. M. Franke, R. Hadorn, J. O. Bosset, G. Gremaud, and
                                                                                      M. Kreuzer, “Is authentication of the geographic origin of
Changyuan Wang and Dongjie Zhang conceived and designed                               poultry meat and dried beef improved by combining multiple
the study. Yuchao Feng and Tianxin Fu performed acquisition                           trace element and oxygen isotope analysis?,” Meat Science,
of data. Liyuan Zhang and Changyuan Wang analyzed the data.                           vol. 80, no. 3, pp. 944–947, 2008.
Journal of Chemistry                                                                                                                         7

 [5] S. Benson, C. Lennard, P. Maynard, and C. Roux, “Forensic          [21] A. Ji-ye, J. He, and R. B. Sun, “Multivariate statistical analysis
     applications of isotope ratio mass spectrometry—a review,”              for metabolomic data: the key points in principal component
     Forensic Science International, vol. 157, no. 1, pp. 1–22, 2005.        analysis,” Acta Pharmaceutica Sinica, vol. 53, pp. 929–937,
 [6] W. Chen, Biochemistry and Genetical Bases of Rice Metab-                2018.
     olome, Huazhong Agricultural University, Hubei, China,             [22] M. Kanehisa and S. Goto, “KEGG: Kyoto encyclopedia of
     2015.                                                                   genes and genomes,” Nucleic Acids Research, vol. 28, no. 1,
 [7] J. K. Nicholson, E. Holmes, J. C. Lindon, and I. D. Wilson,             pp. 27–30, 2000.
     “The challenges of modeling mammalian biocomplexity,”              [23] L. Wang, Metabolomic Research of Genetically Modified Rice,
     Nature Biotechnology, vol. 22, no. 10, pp. 1268–1274, 2004.             Beijing University of Chemical Technology, Beijing, China,
 [8] L. Giansante, D. Di Vincenzo, and G. Bianchi, “Classification            2013.
     of monovarietal Italian olive oils by unsupervised (PCA) and
     supervised (LDA) chemometrics,” Journal of the Science of
     Food and Agriculture, vol. 83, no. 9, pp. 905–911, 2003.
 [9] L. X. Duan and X. Q. Qi, “GC-MS-based plant metabolomics
     researches,” Chinese Bulletin Life Sciences, vol. 27, pp. 971–
     977, 2015.
[10] N. N. Wang, X. W. Feng, Y. P. Sung, P. S. Gong, and L. Zhu,
     “Determination of the storage time and geographical origin of
     rice by GC and chemometrics,” Analysis and Testing Journal,
     vol. 32, pp. 1227–1231, 2013.
[11] M. Suzuki, M. Kusano, H. Takahashi et al., “Rice-arabidopsis
     FOX line screening with FT-NIR-based fingerprinting for
     GC-TOF/MS-based metabolite profiling,” Metabolomics,
     vol. 6, no. 1, pp. 137–145, 2009.
[12] M. N. Calingacion, C. Boualaphanh, V. D. Daygon et al., “A
     genomics and multi-platform metabolomics approach to
     identify new traits of rice quality in traditional and improved
     varieties,” Metabolomics, vol. 8, no. 5, pp. 771–783, 2011.
[13] H. Redestig, M. Kusano, K. Ebana et al., “Exploring molecular
     backgrounds of quality traits in rice by predictive models
     based on high-coverage metabolomics,” BMC Systems Bi-
     ology, vol. 5, no. 1, p. 176, 2011.
[14] F. Matsuda, Y. Okazaki, A. Oikawa et al., “Dissection of
     genotype-phenotype associations in rice grains using
     metabolome quantitative trait loci analysis,” The Plant Jour-
     nal, vol. 70, no. 4, pp. 624–636, 2012.
[15] W. Chen, L. Gong, Z. Guo et al., “A novel integrated method
     for large-scale detection, identification, and quantification of
     widely targeted metabolites: application in the study of rice
     metabolomics,” Molecular Plant, vol. 6, no. 6, pp. 1769–1780,
     2013.
[16] E. S. Jung, S. Lee, S.-H. Lim, S.-H. Ha, K.-H. Liu, and
     C. H. Lee, “Metabolite profiling of the short-term responses of
     rice leaves (Oryza sativa cv. Ilmi) cultivated under different
     LED lights and its correlations with antioxidant activities,”
     Plant Science, vol. 210, pp. 61–69, 2013.
[17] J. Bao, “Quality control of sampling links of agricultural
     products inspection and testing organizations,” Ningxia
     Journal of Agriculture and Forestry Science and Technology,
     vol. 59, pp. 44–53, 2018.
[18] J. Zhou, S. Y. Wang, Y. W. Chang et al., “Development of a gas
     chromatography-mass spectrometry method for the metab-
     olomic study of rice (Oryza sativa L.) grain,” Chinese Journal
     of Chromatography, vol. 30, no. 10, pp. 1037–1042, 2012.
[19] J. H. Cheng, Z. H. Sang, H. J. Li, S. M. Wu, Q. Xia, and
     F. T. Dong, “Metabolomic analysis of bt-transgenic and pa-
     rental rice based on gas chromatography—mass spectrome-
     try,” Journal of Instrumental Analysis, vol. 35, pp. 1271–1224,
     2016.
[20] H. Wen, Study on the Mechanism of Propolis and Grape Seed
     Active ingredients on Diabetes Mellitus Based on Metab-
     olomics, Shanxi University of Science and Technology, Xi’an,
     China, 2017.
Nanomaterial
Nanomaterials
         Journal of

                                          Journal of
                                                                             The Scientific
                                                                                                                                                                     Photoenergy
                                                                                                                                                                               International Journal of
                                          Analytical Methods                                                                Journal of

Hindawi
                                          in Chemistry
                                          Hindawi
                                                                             World Journal
                                                                             Hindawi Publishing Corporation
                                                                                                                            Applied Chemistry
                                                                                                                            Hindawi                                  Hindawi
www.hindawi.com            Volume 2018    www.hindawi.com      Volume 2018   http://www.hindawi.com
                                                                             www.hindawi.com                  Volume 2018
                                                                                                                     2013   www.hindawi.com            Volume 2018   www.hindawi.com                      Volume 2018

Advances in                                                                                                                                                          International Journal of
Physical Chemistry
Hindawi
                                                                                                                                                                     Medicinal Chemistry
                                                                                                                                                                     Hindawi
www.hindawi.com             Volume 2018                                                                                                                              www.hindawi.com                      Volume 2018

                                                            Submit your manuscripts at
                                                               www.hindawi.com

Bioinorganic Chemistry                                                                                                                                               Journal of
and Applications
Hindawi
                                                                                                                                                                     Materials
                                                                                                                                                                     Hindawi
www.hindawi.com             Volume 2018                                                                                                                              www.hindawi.com                      Volume 2018

Advances in                               Journal of                         BioMed                                         International Journal of                 International Journal of
Tribology
Hindawi
                                          Chemistry
                                          Hindawi
                                                                             Research International
                                                                             Hindawi
                                                                                                                            Spectroscopy
                                                                                                                            Hindawi
                                                                                                                                                                     Electrochemistry
                                                                                                                                                                     Hindawi
www.hindawi.com             Volume 2018   www.hindawi.com      Volume 2018   www.hindawi.com                  Volume 2018   www.hindawi.com            Volume 2018   www.hindawi.com                      Volume 2018

International Journal of                  Journal of                         Journal of                                     Enzyme                                   Biochemistry
Analytical Chemistry
Hindawi
                                          Spectroscopy
                                          Hindawi
                                                                             Nanotechnology
                                                                             Hindawi
                                                                                                                            Research
                                                                                                                            Hindawi
                                                                                                                                                                     Research International
                                                                                                                                                                     Hindawi
www.hindawi.com             Volume 2018   www.hindawi.com      Volume 2018   www.hindawi.com                  Volume 2018   www.hindawi.com            Volume 2018   www.hindawi.com                      Volume 2018

You can also read