Modelling of hot-air and vacuum drying of persimmon fruit (Diospyros kaki) using computational intelligence methods
←
→
Page content transcription
If your browser does not render page correctly, please read the page content below
Agronomy Research 18(S2), 1323–1335, 2020
                                                     https://doi.org/10.15159/AR.20.095

    Modelling of hot-air and vacuum drying of persimmon fruit
    (Diospyros kaki) using computational intelligence methods
        A.Y. Khaled1,*, A. Kabutey1, C. Mizera1, P. Hrabe2 and D. Herák1
1
 Department of Mechanical Engineering, Faculty of Engineering, Czech University of
Life Sciences Prague, Kamýcká 129, CZ165 00 Praha-Suchdol, Czech Republic
2
 Department of Material Science and Manufacturing Technology, Faculty of
Engineering, Czech University of Life Sciences Prague, Kamýcká 129, CZ165 00 Praha-
Suchdol, Czech Republic
*
  Correspondence: f_yahya87@hotmail.com

Abstract. The study evaluated the feasibility of applying computational intelligence methods as
a non-destructive technique in describing the drying behaviour of persimmon fruit using vacuum
drying (VD) and hot-air-drying (HAD) methods and to compare the results with thin layer
mathematical models. Drying temperatures were 50, 60 and 70 °C. Kinetic models were developed
using semi-theoretical thin layer models and computational intelligence methods: multi-layer
feed-forward artificial neural network (ANN) and support vector regression (SVR). The statistical
indicators of coefficient of determination (R2) and root mean square error (RMSE) were used to
assess the suitability of the models. The thin-layer mathematical models namely page and
logarithmic accurately described the drying kinetics of persimmon slices with the highest R2 of
0.9999 and lowest RMSE of 0.0031. ANN showed R2 and RMSE values of 1.0000 and 0.0003,
while SVR showed R2 of 0.9999 and RMSE of 0.0004. The validation results indicated good
agreement between the predicted values obtained from the computational intelligence methods
and the experimental moisture ratio data. Based on the study results, computational intelligence
methods can reliably be used to describe the drying process of persimmon fruit.

Key words: persimmon fruit, drying methods, computational intelligence methods, artificial
neural network model, support vector regression model.

                                     INTRODUCTION

     Persimmon (Diospyros kaki) is an edible fruit that grows in subtropical and warm
temperate climates and it is considered an important fruit in many countries such as
China, Japan and Korea and Turkey. It has a high nutritional value such as vitamin A,
C, carotenoid and phenolic compounds (Bozkir et al., 2019). The high moisture content
of the fruit leads to rapid deterioration even at refrigerator temperatures. Therefore,
drying is considered as one of the processes to increase persimmon shelf life. This
indicates that persimmon can be used as an ingredient in products such as breakfast
cereals and snacks (Doymaz, 2012).
     Drying of agricultural products causes the enzymatic reactions to be inactivated as
a result of heat and mass transfer leading to a reduction of the moisture content inside
the product (Tomsone et al., 2018). Drying methods such as hot-air drying (HAD),
                                             1323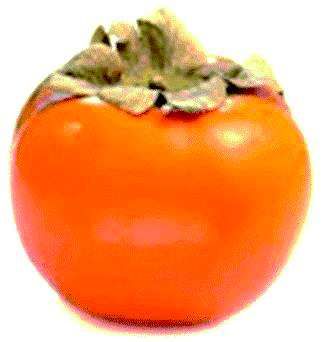
freeze-drying (FD), vacuum drying (VD), microwave drying (MWD) and infrared
drying (IRD) have been used in drying agricultural products (Doymaz, 2012; Karaman
et al., 2014). However, HAD is the most commonly used technique due to the uniformity
of the dried product and non-toxicity (Onwude et al., 2016b; Ozola & Kampuse, 2018).
In the VD method, the use of low temperatures in the absence of oxygen can preserve
heat-sensitive and easily oxidizable foods where discoloration and decomposition of the
flavor and some nutritional substances are prevented (Tekin & Baslar, 2018; Karasu et
al., 2019). Both HAD and VD can also affect the physical and phytochemical properties
of the food products. Hence, the determination of the optimum operating parameters,
drying conditions and the determination of suitable drying models are important for
achieving the nutritional value along with minimum product cost and maximum yield
(Tomsone et al., 2018).
       Some studies have explored several thin-layer drying models to describe the drying
processes of fruits and vegetables. The thin-layer drying models are empirical, semi-
theoretical and theoretical models based on the assumption of mass diffusivity,
conductivity and geometry (Akoy, 2014; Aboltins et al., 2018). Theoretical models have
followed the fundamentals of mass and heat transfer laws during the drying process and
their parameters have a physical meaning (Górnicki et al., 2020). In practical, according
to (Kaleta & Górnicki, 2010) theoretical models normally take a long time due to the
complexity of the diffusion equations governing the process. Semi-theoretical models
offer a compromise between theory and ease of application and they are deduced from
simplified versions of Fick’s second law of diffusion (Ashtiani et al., 2017). Empirical
models are basically built between the direct relationship between the curve of moisture
content and drying time and does not need to consider the theory during the drying
process (Kaleta et al., 2013). These models, however, do not produce accurate results
(Onwude et al., 2016b). Thus, researchers are considering new drying modelling
approaches or computational tools.
       Computational tools such as artificial neural networks (ANN) and support vector
regression (SVR) are considered as complex tools for complex systems and dynamic
modelling (Khaled et al., 2018). Application of ANN and SVR offer many advantages
compared to conventional modeling techniques due to the learning ability, increased
flexibility, online non-destructive measurements, reduced assumptions, suitability to the
nonlinear process and tolerance of incomplete data (Rodríguez et al., 2014). The
difference between ANN and SVR is fundamentally based on how the non-linear data is
classified. For example, ANN applies a multi-layer connection and different activation
functions to deal with nonlinear problems. While SVM employs nonlinear mapping to
make the data linear separable using kernel functions (Khaled et al., 2020).
       ANN and SVR have been successfully applied in modelling and optimizing the
drying processes of fruits and vegetables such as pomelo (Kırbaş et al., 2019), ginkgo
biloba seeds (Bai et al., 2018), mushroom (Omari et al., 2018), celeriac slices (Beigi &
Ahmadi, 2018), pepper (Jafari et al., 2016), eggplant (Bahmani et al., 2016), tea leaves
(Xie et al., 2014), tomato (Movagharnejad & Nikzad, 2007). In view of this, ANN and
SVR techniques can be applied to the drying kinetics of persimmon fruit under HAD
and VD, and this knowledge is limited in the literature. This modelling technique can
also be useful for assessing the drying parameters in real conditions, optimum processing
conditions and drying efficiency.

                                         1324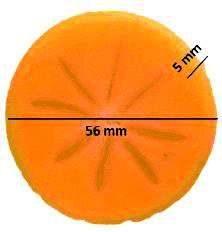
The objectives of this study are to evaluate the feasibility of applying ANN and
SVR modelling as a non-destructive technique in describing the drying behaviour of
persimmon fruit under different drying conditions and to compare the results with thin
layer mathematical models. Also, to investigate the color change kinetics of persimmon
slices under different drying conditions during the VD and HAD.
MATERIALS AND METHODS
Samples preparation and moisture content determination
Persimmon fruits (Diospyros kaki) bought from a market in Prague, Czech
Republic, were used for the experiment. A total of 30 samples were selected based on
similar physical appearances (shape
color and size). Prior to each
experiment, the samples were peeled
and washed under running tap water.
Then they were sliced into thickness
and diameter of 5 mm and 56 mm,
respectively, using a Sencor slicer
(SFS 4050SS, Czech Republic). The
persimmon fruit with a sliced section
of dimension 56 mm and thickness of Figure 1. Persimmon fruit with a sliced section
5 mm used in the study is shown in of diameter 56 mm and thickness of 5 mm.
Fig. 1. The initial moisture content of
the fresh samples was determined as 3.98 kg kg-1 (dry basis), according to ASABE
standard (ASAE, 2005), by drying 25 g of selected samples at 70 °C for 24 h using the
conventional oven.
Drying experiments
In this study, two different drying processes were used include VD and HAD to dry
the persimmon sliced samples.
Vacuum drying
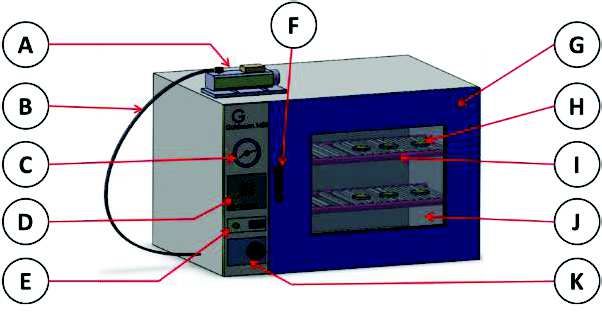
The VD technique was carried
out using a laboratory-scale drying
unit (l 450 Goldbrunn, Poland) as
shown in Fig. 2. For VD, the vacuum
was regulated by a vacuum pump
(VE 135, RoHS, China) at a 50 mbar
ultimate pressure and 2 Ls-1 pump
speed. It is worth noting that the
pressure was monitored through the
vacuum gauge which was unstable Figure 2. Schematic diagram of the vacuum dryer;
during the drying process. This A: vacuum pump; B: pipe; C: vacuum gauge;
D: temperature regulator; E: ON/OFF master switch;
problem was solved manually by
F: door handle; G: door; H: sample; I: shelves;
fixing the pressure at approximately J: inspection window and K: vacuum valve.
50 mbar. This meant that when the
1325pressure increased above or decreased below 50 mbar, the pump was opened for the
adjustment. The VD operates by heating the samples with a conduction heat from a
heater plate in the container. The vacuum pump reduces the pressure around the sample
to be dried and further ensures less atmospheric pressure. This decreases the boiling
point of the water inside that product and thereby increases the rate of evaporation
significantly. The sliced samples were dried at three temperatures (50 °C, 60 °C, and
70 °C). Prior to the experiments, the VD was set-up to the required temperature for 30
min to enable the dryer temperature to reach equilibrium with the surrounding air
temperature. The weight of the persimmon sample was measured 1 hour interval using
a digital scale (HR-250AZ, A&D Company Limited) weighing balance of 252 g 0.1 mg-1
precision. The weight of the samples was measured during the drying process every
1 hour. The experiments were carried out in triplicate and the average values used in
further analyses.
Hot-air drying
A laboratory-scale convective HAD (UF 110, Memmert, Germany) was used.
Similar to VD, three temperatures (50 °C, 60 °C, and 70 °C) with a constant air velocity
of 1.10 ms-1, until constant weight between two successive readings was attained. The
air velocity was measured using a Thermo–Anemometer (Model 451104, EXTECH
Instruments, Taiwan). Before starting the experiments, the HAD was set-up to the
required temperature for 30 min to enable the dryer temperature to reach equilibrium
with the surrounding air temperature. Similar to the VD, the weight of the persimmon
sample was measured 1 hour interval using a digital scale weighing balance, whereby
the samples were removed from the dryer and measured and then returned to the dryer.
The mass interval was expressed as the moisture ratio as illustrated in Fig. 4. The
experiments were conducted in triplicate and the average values used in further analyses.
Drying kinetics
The variation in moisture content during VD and HAD techniques was expressed
in the form of moisture ratio (dimensionless) as described in Eq. 1.
ሺܯ௧ െ ܯ ሻ
ܴܯൌ (1)
ሺܯ െ ܯ ሻ
where Mt, Me and Mo are the moisture content of the samples at time t, equilibrium
moisture content and initial moisture content, respectively.
According to Aghbashlo et al. (2009), Me values did not change because they were
relatively low compared to Mt and Mo values, resulting in negligible error during
simplification, thus the moisture ratio was expressed as shown in Eq. 2:
ܯ௧
ܴܯൌ (2)
ܯ
Mathematical modelling
The experimental drying data measured were fitted to 5 selected thin-layer drying
models. The selected mathematical models, namely, Newton, Page, Logarithmic,
Two-term and Modified Henderson and Pabis as listed in Table 1 using the non–linear
least squares regression analysis using Sigma Plot software (Version 12.0, Systat
Software Inc., California, USA). The use of these models gives a better prediction with
fewer assumptions (Onwude et al., 2018).
1326Table 1. Thin layer mathematical drying models
Model
Model name Model expression Reference
no.
1. Newton model MR = exp(-kt) (Lewis, 1921)
2. Page model MR = exp(-ktn) (Page, 1949)
3. Logarithmic model MR= aexp(-kt)+c (Yagcioglu, 1999)
4. Two-term model MR=aexp(-k1t)+bexp(-k2t) (Henderson, 1974)
5. Modified Henderson MR=aexp(-kt)+bexp(-gt)+cexp(-ht) (Karathanos, 1999)
and Pabis model
Computational intelligence methods
Artificial neural network
Artificial Neural Network (ANN) is a powerful and complex modelling tool for
processing model information based on biological neural networks (Khaled et al., 2018).
In general, ANNs are created with three layers (input, hidden and output layer). In this
study, a multilayer feed-forward network structure was used with three input parameters
(drying techniques, temperature and drying time), 1–2 hidden layers and one output
parameter (moisture ratio) as shown in Fig. 3. Algorithms applied to the training of the
model were the Levenberg-Marquardt back propagation transfer function choice and
sigmoid function as given in Eq. 3.
ͳ
݂ሺݔሻ ൌ (3)
ͳ ݁ ି௫
The datasets were prepared by randomly dividing the data into training (70%) and
testing (30%). The total number of data used in this study was 137 with 96 was used to
build the model and 41 was used for testing the model. The chosen hidden layer
architectures were [3], [6], [3, 3], [6, 6] matrix, where for example, [3, 3] represents the
2 hidden layers with 6 neurons (Fig. 3). The software Weka 3.6 (Hamilton, New
Zealand) was used to analyse the ANN model. In this study, the error was used as the
criteria to stop training to prevent the overtraining of ANN structure. This means that
when the error against the iterations shows no change and it’s saturated, then the ANN
training is stopped.
Figure 3. Artificial Neural networks topology.
1327Support vector regression
Support Vector Regression (SVR) is a supervised learning model which combines
theoretical solutions with numerical algorithms used for regression method (Das &
Akpinar, 2018). SVR as a regression method is considered as an effective approach due
to its capability of capturing nonlinear relationship in the feature space. The SVR used
for the moisture ratio values was determined by the SMOreg sequence in the Waikato
Environment for Knowledge Analysis (WEKA) software, whereby, the SMOreg
implements SVR for regression. The three input variables used for the SVR model were
drying techniques, temperature and drying time with the output as the moisture ratio. In
addition, two filter types were applied, namely normalize and standardize in order to
determine how/if the data need to be transformed. Furthermore, three different kernel
models: polynomial, Pearson universal and Radial Basis Function (RBF) were used to
construct the predictive model of the calculated moisture ratio values.
Color measurements
Color is one of the most important quality evaluation attributes for fruits and
vegetables during drying. For the color measurements, first the image of fresh (reference)
and dried samples obtained from VD and HAD methods were captured using smartphone
camera (Oppo F7, Dongguan, China). The smartphone camera consisted of a 16 mega-
pixel charged-coupled device (CCD). Persimmon slices were put in a glass plate located
on the white paper as a background during image capture for more focus, and the distance
between sample and smartphone camera was set-up to be 22 cm vertically. Then the
images were transferred to ImageJ software, which is an open-source software available
to the public domain (http://rsb.info.nih.gov/ij/). Also, it can operate on Linux, Mac OS
X, and Windows, in both 32-bit and 64-bit modes. ImageJ has different tools to analyse
the images. In this study, ImageJ was used to determine the color parameters: lightness
(L*), redness/greenness (a*) and yellowness/blueness (b*). The total color difference
(∆E) was estimated based on Eq. 4. For each sample, three replications were performed.
ο ܧൌ ඥሺ כܮെ כܮ ሻଶ ሺܽ כെ ܽ כሻଶ ሺܾ כെ ܾ כሻଶ (4)
where Lo*, ao* and bo* indicate the reference values of fresh samples.
Statistical analysis for mean comparison
Statistical analysis was performed using the Statistical Analysis System software
(SAS version 9.2, Institute, Inc., Cary, N.C.). Duncan test was used to compare the mean
significant differences between quality attributes (L*, a*, b* and ΔE) for different drying
time intervals and at different drying techniques (VD and HAD). The findings of
replicate measurements were presented with mean ± standard error values. The fit
accuracy of experimental data to the thin layer, ANN and SVR models was determined
by the coefficient of determination (R2) and root mean square error (RMSE). They are
computed mathematically as given in Eqs 5 and 6:
σே
ୀଵሺܸௗ െ ܸ௫ ሻ
ଶ
ܴଶ ൌ ͳ െ (5)
σேୀଵሺܸௗ െ ܸ ሻ
ଶ
σே
ୀଵሺܸௗ െ ܸ௫ ሻ
ଶ
ܴ ܧܵܯൌ ඨ (6)
ܰ
1328where Vpred is the predicted value, Vexp is the actual observation from experimental data,
Vm is the mean of the actual observation, and N is number of observations.
From the values of R2 and RMSE, the higher the value of R2 and the lower the
RMSE value, the better the goodness of fit.
RESULTS AND DISCUSSION
Behaviour of drying process of persimmon fruit slices
The variations of moisture ratio with time for VD and HAD techniques at different
temperatures (50 °C, 60 °C, and 70 °C) are illustrated in Fig. 4. The moisture ratio of the
samples for all techniques decreased with an increase in drying time. The drying rates
for VD and HAD methods occurred in the falling rate period. Based on Fig. 4, a, it is
clear that the drying time thus reduces as the drying temperature increases. The moisture
ratio values of 0.18 and 0.22 were determined at a drying time of 170 min and at
temperatures of 70 °C and 60 °C. At a drying time of 360 min was found the moisture
ratio of 0.22 at 50 °C. Similar results were observed using HAD (Fig. 4, b). The results
indicate that the moisture transfer rate from the inner layers to its surface thus increases
as the drying air temperature increases. The rate of moisture evaporation at the surface
of the persimmon sample to the atmosphere also increases as the temperature increases,
leading to the higher drying rate. For this, the drying time for persimmon samples using
HAD was different from VD. The results are in agreement with other researchers on the
drying behaviour of various varieties of persimmon (Çalışkan & Dirim, 2015; Bozkir et
al., 2019).
Figure 4. Drying characteristics of persimmon fruit sliced samples; [a] VD and [b] HAD.
Comparison between the mathematical modelling
The mathematical models were applied to describe the drying kinetic of persimmon
slices during VD and HAR methods. Table 2 shows the selected mathematical models
that fitted the experimental moisture content data. Although all the selected five models
adequately fitted the experimental data, the logarithmic model sufficiently described the
drying kinetics of the samples with R2 values between 0.9964 and 0.9980 and RMSE
values between 0.0146 and 0.0206 for VD technique at all drying temperatures. For
HAD technique, Page and logarithmic models significantly described the drying kinetics
of the samples with R2 values between 0.9979 and 0.9999 RMSE values between 0.0031
1329and 0.0171. The validation of the logarithmic model by comparing the predicted moisture
data and those obtained from the experiments is presented in Fig. 5. The moisture ratio
data predicted using logarithmic model lied closely along a straight regression line for
different drying conditions indicating the suitability of the model for describing the VD
and HAD behaviours of persimmon fruit samples. Onwude et al., (2018) also reported
the adequacy of Page and logarithmic models for predicting the drying kinetics of sweet
potato. Similarly, Younis et al. (2018) indicated the appropriateness of page and
logarithmic models for describing the drying performance of garlic slices.
Table 2. Statistical evaluation of the mathematical drying models for persimmon samples of VD
and HAD
Drying Temp Model
R2 RMSE
method °C no Model parameters
VD 50 1 k = 0.2491 0.9577 0.0682
2 k = 0.1224, n = 1.4734 0.9940 0.2559
3 a = 1.5532, k = 0.1229, c = -0.5369 0.9980 0.0146
4 a = 0.5606, k1 = 0.2663, b = 0.5108, k2 = 0.2663 0.9650 0.0620
5 a = 0.3715, k = 0.2663, b = 0.3610, g = 0.2663, 0.9650 0.0620
c = 0.3388, h = 0.2663
60 1 k = 0.4503 0.9821 0.0457
2 k = 0.3292, n = 1.3069 0.9960 0.0217
3 a = 1.1435, k = 0.3445, c = -0.1331 0.9964 0.0206
4 a = 0.5347, k1 = 0.4632, b = 0.4988, k2 = 0.4632 0.9836 0.0438
5 a = 0.3531, k = 0.4632, b = 0.3503, g = 0.4632, 0.9836 0.0438
c = 0.3300, h = 0.4632
70 1 k = 0.6145 0.9957 0.0220
2 k = 0.5871, n = 1.0608 0.9963 0.0205
3 a = 1.0325, k = 0.5613, c = -0.0345 0.9974 0.0173
4 a = 0.5045, k1 = 0.6171, b = 0.5003, k2 = 0.6171 0.9958 0.0219
5 a = 0.3329, k = 0.6171, b = 0.3408, g = 0.6171, 0.9958 0.0219
c = 0.3312, h = 0.6171
HAD 50 1 k = 0.5737 0.9986 0.0120
2 k = 0.5514, n = 1.0481 0.9990 0.0103
3 a = 1.0228, k = 0.5349, c = -0.0255 0.9998 0.0047
4 a = 0.5027, k1 = 0.5753, b = 0.5005, k2 = 0.5753 0.9987 0.0120
5 a = 0.3315, k = 0.5753, b = 0.3405, g = 0.5753, 0.9987 0.0120
c = 0.3313, h = 0.5753
60 1 k = 0.8838 0.9957 0.0235
2 k = 0.7945, n = 1.2519 0.9998 0.0047
3 a = 1.0409, k = 0.8064, c = -0.0359 0.9982 0.0152
4 a = 0.5142, k1 = 0.8898, b = 0.4950, k2 = 0.8898 0.9958 0.0232
5 a = 0.3401, k = 0.8898, b = 0.3409, g = 0.8898, 0.9958 0.0232
c = 0.3282, h = 0.8898
70 1 k = 0.9781 0.9943 0.0284
2 k = 0.8745, n = 1.3348 0.9999 0.0031
3 a = 1.0564, k = 0.8581, c = -0.0522 0.9979 0.0171
4 a = 0.5158, k1 = 0.9840, b = 0.4928, k2 = 0.9840 0.9944 0.0281
5 a = 0.3409, k = 0.9840, b = 0.3408, g = 0.9840, 0.9944 0.0281
c = 0.3270, h = 0.9840
Temp: Temperature.
1330Artificial neural network (ANN)
Time, temperature and drying
techniques were used to predict
moisture ratio using ANN model.
Table 3 shows the statistical results
related to the training and
validation of the multilayer feed-
forward network structure of
experimental data. The training
data set were used to assess the
optimum number of neurons and
hidden layers for multilayer neural
network modelling for determining
the best predictive power. The
results illustrated that the
Figure 5. Predicted versus experimental moisture
architecture with 2 hidden layers ratio data for logarithmic model at 50 °C for VD
and 6 neurons [3, 3], obtained the and HAD methods.
best results as compared to those of
1 hidden layer [3, 6 and 9 neurons] and 2 hidden layers (12 and 18 neurons), respectively.
Moreover, the networks were found to be susceptible to the number of neurons in
their hidden layers. Thus, smaller neurons led to under-fitting, while too many neurons
contributed to overfitting. From
the results produced from ANN Table 3. ANN model statistical evaluation
2
model, the highest R and the No. No. Training Testing
lowest RMSE values of 1.0000 and hidden Neurons
layer R2 RMSE R2 RMSE
0.0003, respectively as listed in
Table 3. These results indicated 1 3 0.9982 0.0167 0.9966 0.0290
that ANN found higher results 1 6 0.9992 0.0038 0.9879 0.0363
1 9 0.9986 0.0209 0.9876 0.0819
compared to page model
2 2 3.3 1.0000 0.0003 0.9978 0.0089
(R = 0.9999 and RMSE = 0.0031) 2 6.6 0.9999 0.0013 0.9969 0.0275
as shown in Table 2. Zenoozian et 2 9.9 0.9996 0.0019 0.9988 0.0269
al. (2014) found that 2 hidden
layers and 30 neurons adequately
predicted the moisture changes during the drying kinetics of pumpkin. ANN with 2
hidden layers has also been successful in predicting the drying behaviour of other fruits
and vegetables such as pumpkin, pepper, apple slices during microwave-vacuum drying
(Nadian et al., 2014; Jafari et al., 2016; Onwude et al., 2016a).
Support vector regression (SVR)
The statistical results related to the training and validation of the SVR of persimmon
drying experimental data are given in Table 4. Similar to ANN model, the training data
set was used to evaluate the best filter and kernel type modelling for determining the best
predictive power. The results showed that the normalize and standardize filter types with
pearson universal kernel obtained the best results as compared to those of normalize with
polynomial and RBF kernel and also standardize with polynomial, and RBF kernel,
respectively. From the results of Table 2 and Table 4, it is clear that the SVR model
produced the same value of R2 (0.9999) as compared to the highest values of theoretical
1331mathematical models. However, the SVR model found the lowest RMSE of 0.0013 as
compared to the lowest value of RMSE (0.0031) using page model from the theoretical
mathematical models. Few studies used SVR as a model in drying techniques. Das &
Akpinar, (2018) applied SVR to investigate pear drying performance by different ways
of convective heat transfer. The authors applied normalization and standardization filter
to the target attribute with three kernel models namely polynomial kernel, pearson
universal kernel and RBF kernel. They found that polynomial kernel found the lowest
RMSE of 0.3351. Generally, more efficient results for computational intelligence
methods can be obtained when the parameters of ANN and SVR are optimized (Khaled
et al., 2018).
Table 4. Statistical results for SVR model
Training Testing
Filter type Kernel type
R2 RMSE R2 RMSE
Normalize Polynomial kernel 0.9080 0.1538 0.8718 0.1601
Normalize Pearson universal kernel 0.9999 0.0013 0.9303 0.1197
Normalize RBF kernel 0.9976 0.0262 0.9364 0.2056
Standardize Polynomial kernel 0.9728 0.0780 0.8717 0.1604
Standardize Pearson universal kernel 0.9999 0.0004 0.9361 0.1094
Standardize RBF kernel 0.9973 0.0271 0.9360 0.1098
Color measurements
The quality properties of persimmon fruit slices during VD and HAD methods were
determined based on the change in color parameters of L*, a*, and b* and the total color
change ∆E as given in Table 5. It can be seen clearly from Table 5 that that the lightness
(L*) of the samples using VD and HAD methods decreased significantly (p ≤ 0.05)
compared to the fresh samples. However, there was no significant difference between
the lightness of samples using VD at 60 °C and 70 °C and also HAD from 50 to 70 °C
for fresh samples. Lightness of samples using VD at 50 °C was significantly different
compared to the fresh samples. Using VD significantly (p ≤ 0.05) reduced the lightness
of samples compared to HAD. VD at 50 °C showed the lowest lightness values of 52.560
± 3.680. The redness/greenness (a*) of samples reduced significantly (p ≤ 0.05) compared
to fresh samples. There was no significant difference between the redness/greenness of
samples using VD at 50 °C and HAD at 50 °C in comparison with fresh samples.
Generally, the values of redness/greenness (a*) using HAD were higher than VD, except
the value using VD at 60 °C. The lowest value of redness/greenness (a*) was 11.684 ±
0.259 using HAD at 60 °C. Similar results were found for the yellowness/blueness (b*),
where the color of all dried samples reduced significantly (p ≤ 0.05) compared to the
fresh samples. In addition, there was no significant difference between the b* of fresh
samples with those of dried samples using VD at 60 °C and 70 °C, and HAD from 50 to
70 °C respectively. Dried samples using VD at 50 °C showed yellowness/blueness mean
value of 56.040 ± 3.410. The values of total color change using the VD method were
higher compared to the HAD method. The highest value of 17.790 ± 4.100 was found
for VD at 50 °C. This could be due to the mechanisms involved in VD which thus
gradually sucks the air compared to HAD. Generally, the change of color properties of
the fresh samples under different drying methods is due to the increased sample
1332temperature resulting in increased enzymatic and non-enzymatic chemical reactions of
the product (Nozad et al., 2016).
Table 5. Drying methods and color parameters of persimmon fruit.
Drying Temp Color properties for different sample thickness
method ˚C L* a* b* ∆E
Fresh 61.425 ± 2.533a 26.282 ± 0.747a 65.698 ± 2.126a -
b ab
VD 50 52.560 ± 3.680 20.69 ± 1.95bc 56.040 ± 3.410b 17.790 ± 4.100a
60 56.161 ± 3.476ab 16.280 ± 3.598bc 61.073 ± 2.834ab 15.859 ± 1.822ab
70 59.646 ± 0.413ab 12.804 ± 0.764c 62.265 ± 0.076ab 14.568 ± 0.669ab
ab a
HAD 50 56.930 ± 1.152 23.438 ± 0.258 61.762 ± 1.088ab 9.528 ± 1.568b
a c
60 60.250 ± 2.229 11.684 ± 0.259 64.831 ± 2.231a 14.928 ± 0.680ab
ab bc
70 59.846 ± 1.149 17.259 ± 1.164 64.491 ± 0.750a 10.140 ± 0.405b
Temp: Temperature. Data represents the mean and three replicates (±standard error). Different letters at the
same column indicates statistical difference for Duncan test, p < 0.05 for drying temperature.
CONCLUSIONS
The study investigated the potential of using computational intelligence as a
modelling tool for predicting the drying process of persimmon fruit slices (samples). The
results showed that VD and HAD had a significant effect on the drying kinetics and color
properties of samples. As increase in drying temperature influenced the drying kinetics
using HAD and VD. Dried samples using HAD showed significant color attributes
compared to VD. The thin-layer modelling results showed that Page and logarithmic
model can adequately (R2 = 0.9999) described the drying kinetics of samples. Accurate
results were found using ANN (R2 = 1.0000) model. Computational intelligence
methods and theoretical models gave similar results. However, the ANN and SVR
models are able to describe a wider range of experimental data whereas the application
of theoretical models is limited to specific experimental conditions in most cases. Thus,
the ANN and SVR models may be considered as suitable alternative modelling methods
for describing the drying behaviour of samples. On the other hand, computational
intelligence methods can be successfully applied to industrial drying processes and
operations as well as online monitoring and control.
ACKNOWLEDGEMENTS. The authors gratefully appreciate Czech University of Life Sciences
Prague for the financial support provided under research grant (CZ.02.2.69/0.0/0.0/16_027/0008366).
REFERENCES
Aboltins, A., Rubina, T. & Palabinskis, J. 2018. Shrinkage effect on diffusion coefficient during
carrot drying. Agronomy Reseach 16(S2), 1301–1311.
Aghbashlo, M., Kianmehr, M.H., Khani, S., Ghasemi, M. & others. 2009. Mathematical
modelling of thin-layer drying of carrot. International Agrophysics 23(4), 313–317.
Akoy, E.O.M. 2014. Experimental characterization and modeling of thin-layer drying of mango
slices. International Food Research Journal 21(5).
ASAE. 2005. Moisture measurement – unground grain and seeds. American Society of
Agricultural and Biological Engineers 2–4.
1333Ashtiani, S.M., Salarikia, A. & Golzarian, M.R. 2017. Analyzing drying characteristics and
modeling of thin layers of peppermint leaves under hot-air and infrared treatments.
Information Processing in Agriculture 4(2), 128–139.
Bahmani, A., Jafari, S.M., Shahidi, S.-A. & Dehnad, D. 2016. Mass transfer kinetics of eggplant
during osmotic dehydration by neural networks. Journal of Food Processing and
Preservation 40(5), 815–827.
Bai, J., Xiao, H., Ma, H. & Zhou, C. 2018. Artificial neural network modeling of drying kinetics
and color changes of ginkgo biloba seeds during microwave drying process. Journal of
Food Quality 2018, 1–9.
Beigi, M. & Ahmadi, I. 2018. Artificial neural networks modeling of kinetic curves of celeriac
(Apium graveolens L) in vacuum drying. Food Science and Technology 2061, 1–6.
Bozkir, H., Rayman, A., Serdar, E., Metin, G. & Baysal, T. 2019. Ultrasonics - sonochemistry
influence of ultrasound and osmotic dehydration pretreatments on drying and quality
properties of persimmon fruit. Ultrasonics - Sonochemistry 54(December 2018), 135–141.
Çalışkan, G. & Nur Dirim, E. 2015. Freeze drying kinetics of persimmon puree. GIDA, 40(1),
9–14.
Das, M. & Akpinar, E.K. 2018. Investigation of pear drying performance by different methods
and regression of convective heat transfer coefficient with support vector machine. Applied
Sciences 8, 2–16.
Doymaz, I. 2012. Evaluation of some thin-layer drying models of persimmon slices (Diospyros
kaki L). Energy Conversion & Management 56, 199–205.
Górnicki, K., Kaleta, A. & Choińska, A. 2020. Suitable model for thin-layer drying of root
vegetables and onion. International Agrophysics 34(1), 79–86.
Henderson, S.M. 1974. Progress in developing the thin layer drying equation. Transactions of the
ASAE 17(6), 1167–1168.
Jafari, S.M., Ghanbari, V., Ganje, M. & Dehnad, D. 2016. Modeling the drying kinetics of green
bell pepper in a heat pump assisted fluidized bed dryer. Journal of Food Quality 39, 98–108.
Kaleta, A. & Górnicki, K. 2010. Some remarks on evaluation of drying models of red beet
particles. Energy Conversion and Management 51(12), 2967–2978.
Kaleta, A., Górnicki, K., Winiczenko, R. & Chojnacka, A. 2013. Evaluation of drying models of
apple (var. Ligol) dried in a fluidized bed dryer. Energy Conversion and Management 67,
179–185.
Karaman, S., Toker, O.S., Çam, M., Hayta, M., Kayacier, A., Karaman, S., … Kayacier, A.
2014. Bioactive and physicochemical properties of persimmon as affected by drying
methods. Drying Technology 32, 258–267.
Karasu, S., Akcicek, A. & Kayacan, S. 2019. Effects of different drying methods on drying
kinetics, microstructure, color, and the rehydration ratio of minced meat. Foods 8, 2–14.
Karathanos, V.T. 1999. Determination of water content of dried fruits by drying kinetics. Journal
of Food Engineering 39(4), 337–344.
Khaled, A.Y., Aziz, S.A., Bejo, S.K., Nawi, N.M., Jamaludin, D., Ul, N. & Ibrahim, A. 2020. A
comparative study on dimensionality reduction of dielectric spectral data for the classi fi
cation of basal stem rot (BSR) disease in oil palm. Computers and Electronics in
Agriculture 170, 105288.
Khaled, A.Y., Aziz, S.A., Bejo, S.K., Nawi, N.M. & Seman, I.A. 2018. Spectral features
selection and classification of oil palm leaves infected by Basal stem rot (BSR) disease
using dielectric spectroscopy. Computer and Electronics in Agriculture 144, 297–309.
Kırbaş, İ., Doğuş, A., Şirin, C. & Usta, H. 2019. Modeling and developing a smart interface for
various drying methods of pomelo fruit (Citrus maxima) peel using machine learning
approaches. Computer and Electronics in Agriculture 165(June), 2–8.
Lewis, W. 1921. The rate of drying of solid materials. The Journal of Industrial and Engineering
Chemistry 13(5), 427–432.
1334Movagharnejad, K. & Nikzad, M. 2007. Modeling of tomato drying using artificial neural
network. Computer and Electronics in Agriculture 59, 78–85.
Nadian, M.H., Rafiee, S., Aghbashlo, M., Hosseinpour, S. & Mohtasebi, S.S. 2014. Continuous
real-time monitoring and neural network modelling of apple slices color changes during hot
air Drying. Food and Bioproducts Processing, pp. 1–40.
Nozad, M., Khojastehpour, M. & Tabasizadeh, M. 2016. Characterization of hot-air drying and
infrared drying of spearmint (Mentha spicata L) leaves. Journal of Food Measurement and
Characterization 10, 466–473.
Omari, A., Behroozi-Khazaei, N. & Sharifian, F. 2018. Drying kinetic and artificial neural
network modeling of mushroom drying process in microwave-hot air dryer. Food Process
Engineering 41(7), 1–10.
Onwude, D.I., Hashim, N., Abdan, K., Janius, R. & Chen, G. 2018. Modelling the mid-infrared
drying of sweet potato : kinetics, mass and heat transfer parameters, and energy
consumption. Heat and Mass Transfer 54, 2917–2933.
Onwude, D.I., Hashim, N., Janius, R.B., Nawi, N. & Abdan, K. 2016a. Modelling the convective
drying process of pumpkin (Cucurbita moschata) using an artificial neural network.
International Food Research Journal 23(Suppl), S237–S243.
Onwude, D.I., Hashim, N., Janius, R.B., Nawi, N.M. & Abdan, K. 2016b. Modeling the thin-
layer drying of fruits and vegetables: A review. Comprehensive Reviews in Food Science
and Food Safety 15(3), 599–618.
Ozola, L. & Kampuse, S. 2018. The influence of drying method to the changes of bioactive
compounds in lingonberry by-products. Agronomy Reseach 16(4), 1781–1795.
Page, G. 1949. Factors influencing the maximum rates of air drying shelled corn in thin layers.
Purdue University, ProQuest Dissertations Publ., West Latayette, IN, USA.
Rodríguez, J., Clemente, G., Sanjuán, N. & Bon, J. 2014. Modelling drying kinetics of thyme
(Thymus vulgaris L.): Theoretical and empirical models, and neural networks. Food
Science and Technology International 20(1), 13–22.
Tekin, Z.H. & Baslar, M. 2018. The effect of ultrasound-assisted vacuum drying on the drying rate
and quality of red peppers. Journal of Thermal Analysis and Calorimetry 132(2), 1131–1143.
Tomsone, L., Kince, T. & Ozola, L. 2018. Effect of drying technologies on bioactive compounds
maintenance in pumpkin by-products. Agronomy Reseach 16(4), 1728–1741.
Xie, C., Li, X., Shao, Y. & He, Y. 2014. Color measurement of tea leaves at different drying
periods using hyperspectral imaging technique. PloS One (61201073), 1–15.
Yagcioglu, A. 1999. Drying characteristic of laurel leaves under different conditions. In Drying
Characteristics of Laurel Leaves under Different Conditions. Proceedings of the 7th
International Congress on Agricultural Mechanization and Energy, Adana, 26-27 May
1999, pp. 565–569.
Younis, M., Abdelkarim, D. & El-abdein, A.Z. 2018. Saudi journal of biological sciences kinetics
and mathematical modeling of infrared thin-layer drying of garlic slices. Saudi Journal of
Biological Sciences 25(2), 332–338.
Zenoozian, M.S., Devahastin, S., Razavi, M.A., Shahidi, F. & Poreza, H.R. 2014. Use of
artificial neural network and image analysis to predict physical properties of osmotically
dehydrated pumpkin. Drying Technology 26, 37–41.
1335You can also read