Outlook for Japanese Economy & Stock Market - Monthly comments & views by Sumitomo Mitsui DS Asset Management (SMDAM) - October 2020
←
→
Page content transcription
If your browser does not render page correctly, please read the page content below

Outlook for
Japanese Economy & Stock Market

Monthly comments & views by
Sumitomo Mitsui DS Asset Management (SMDAM)

-October 2020-
Executive summary
Japanese Economy
PM Suga and his cabinet made a good start with approval rating soaring to 74% in a survey made by NIKKEI, which is
comparable to the highest rating given to ex PM Abe’s cabinet in March 2013. PM Suga’s cabinet is made of experienced
and capable members. PM Suga is going to seamlessly succeed emergency policies fighting with COVID-19. He also
stresses his priority on deregulation & digitization of the government and also on enhancing transformation of Japanese
industries by such as supporting start-ups. (Page 9)
• SMDAM has developed trade momentum indicators in order for monitoring economic cycles and estimating in which phase of cycle
current position is situated. COVID-19 caused a severe negative impact, however, the trade momentum hit bottom in May and
substantial recovery is continuing afterwards. Phase analysis shows that we are now in phase 1, which is a start of a new economic
cycle. (Page 4)
• GDP for Apr-Jun quarter (QoQ % annualized) was officially revised-down from -27.8% to -28.1%, which has little impact for the
forecast for 2020. SMDAM’s quarterly GDP forecast was mildly revised-up for 4Q 2020, 1Q and 2Q 2021 reflecting mild upward
revision made for US and other developed economies. (Page 12)
Japanese Stock Market
Adjustment in over-valuation of technology stocks are progressing in US, however, negative effects on Japanese stocks is
going to be limited. Rotation to value stocks is expected to support Japanese market, which is rich in value stocks, and
also strengthening recovery in manufacturing industries is supportive to Japanese manufacturing companies. Japanese
stocks are relatively inexpensive in stock valuation and seems to be well positioned if investors further shift focus from
“with corona theme” to ongoing recovery in physical economy. (Page 20)
• After digesting Apr-Jun quarterly earnings announcements, 12M EPS consensus forecast stopped deteriorating and bounced back
lately. (Page 23)
Notes: Macro and market views are as of 24th Sep. 2020, and subject to updates thereafter without notice.
1
Outlook for
Japanese Economy

                   2
Outlook for the global economy
SMDAM revised-down global real GDP forecast for 2020 from -3.6% to -4.0% as a main scenario, due mainly to cut in
India, which is suffering from spreading COVID-19, more than offsetting slight upward revision for US and Europe. GDP
forecast for 2021 was revised-up from 5.9% to 6.2%.
Life with COVID-19 continues until effective vaccine is developed and become available worldwide, however, fatality
ratio is substantially lower than it was in the first wave of pandemic around in May, which probably shows that we know
the virus and effective treatments better than before. Global economy is expected to show continuing recovery led by
developed economies. Manufacturing industries will be the main driver of the recovery for the rest of this year and full
recovery in physical service sectors will be from the latter half of 2021.
Global GDP forecast and contribution by
(YoY %) countries & regions (Main scenario)
Notes: Data is from 2008 to 2021 and forecasts by SMDAM as of 24th Sep. 2020.
(Year)
(Source) IMF, National statistics of each country, compiled by SMDAM.
3Trade momentum analysis indicates a start of a new economic cycle
SMDAM has developed trade momentum indicators in order for monitoring economic cycles and estimating in which
phase of cycle current position is situated.
COVID-19 caused a severe negative impact, however, the trade momentum hit bottom in May and substantial recovery
is continuing afterwards.
Phase analysis shows that we are now in phase 1, which is a start of a new economic cycle.
Trade momentum as a guide for economic cycle Phase analysis
(Z-score) (2005=100)
6 month % chg of trade momentum(LHS) vertical : Trade momentum
1.2 156
Trade Momentum (LHS) 1.5
1.0 153
0.8 World Trade Index (RHS) 5 4
150 1.0
0.6 Positive but Positive and
147
0.4 Decelerating Accelerating
144 0.5
0.2
6 3
0.0 141
0.0
▲ 0.2 138
▲ 0.4 135
▲ 0.5
▲ 0.6 2
132 20/09
▲ 0.8 7
129 ▲ 1.0
▲ 1.0
126
▲ 1.2
Negative but
123 ▲ 1.5
▲ 1.4 Negative and Improving
8 1
▲ 1.6 120 Worsening
12 13 14 15 16 17 18 19 20 (Year) ▲ 2.0
▲ 1.5 ▲ 1.0 ▲ 0.5 0.0 0.5 1.0 1.5
(Notes) Trade momentum is calculated from 16 indicators and compiled by SMDAM. Data is from Jan 2012 to Sep 2020. horizontal : Trade momentum (6 month % chg)
(Source) Bloomberg, Datastream and other National Statistics.
4People’s mobility keeps recovering
Apple based GDP tracker for Japan remains too high compared to the level of economic statistics. Google’s mobility
index was taken as a main GDP tracker again this month. On the top charts, Google’s mobility index shows that recovery
continues for top 30 countries meanwhile recovery in Japan seems a little slow.
For Japan, number of daily new infection cases fell significantly. Go To campaign, which provides financial incentive for
tours in Japan, started in August excluding Tokyo as residents and a destination, and now Tokyo is going to be included
from October.
(Year / Month) (Year / Month)
Estimated GDP % change from the baseline before the pandemic, based on Google Mobility Index
Top 30 in
United United South
GDP ex. Japan Germany France India Italy Brazil Spain Australia
States Kingdom Korea
China
Date of bottom (Y/M/D) 2020/4/18 2020/4/13 2020/4/24 2020/3/29 2020/4/3 2020/4/3 2020/4/24 2020/4/6 2020/3/29 2020/3/2 2020/4/5 2020/4/5
a) Bottom (% chg.) ▲ 18.5 ▲ 16.6 ▲ 14.5 ▲ 20.6 ▲ 25.9 ▲ 29.4 ▲ 26.7 ▲ 29.2 ▲ 22.4 ▲ 10.4 ▲ 30.4 ▲ 16.7
b) 11th September (% chg.) ▲ 5.0 ▲ 6.0 ▲ 5.0 + 0.9 ▲ 7.2 ▲ 0.9 ▲ 10.9 ▲ 1.6 ▲ 2.8 ▲ 6.7 ▲ 6.0 ▲ 8.6
b)-a) + 13.6 + 10.6 + 9.5 + 21.4 + 18.7 + 28.4 + 15.8 + 27.6 + 19.6 + 3.7 + 24.4 + 8.1
Note: SMDAM analyzed correlation between Google’s and Apple’s mobility index data and released GDP data, and exponentially estimated the GDP status
corresponding to the latest mobility index data in a % change from the baseline GDP, which was the trend line prior to the COVID-19 pandemic.
Google’s data is up to 14th August, Apple’s data is up to 11th September and number of new COVID-19 infection cases is up to 14th September.
(Source) Google, Apple, National statistics of each country, estimation by SMDAM
5Global central banks will keep ultra-easy monetary policy for a long term
Central banks have done almost everything imaginable in order for avoiding financial meltdown stemming from COVID-
19 pandemic. Another focus has been on providing lifelines to households and businesses gasping for cash in the face of
job losses and evaporating sales.
FRB strengthened its forward guidance that current policy rate will continue “until labor market conditions have maximum
employment and inflation has risen to 2 percent and is on track to moderately exceed 2 percent for some time”.
For Japan, monetary policies were maintained in June, July and August. On Thursday 17th September, BOJ governor Mr.
Kuroda praised PM Abe’s maneuvering and expressed his confidence on PM Suga. He also said he is willing to stay in
his position until the end of the term, which ends in April 2023.
(USD bil.) YoY change of assets in central banks' B/S
Forecast
(year)
Note: Data is from Jan 2010 to 31st July 2020. Forecast is up to Dec 2020.
(Source) Bloomberg, each central bank, compiled by SMDAM.
6SMDAM Japanese economic outlook for FY20-21
SMDAM revised-up GDP forecast for FY2021 from +2.9% to +3.1% as a result of stronger US and other overseas
economies.
Mr. Suga was elected as the new LDP leader and the Prime Minister. He will continue driving emergency policies
made by PM Abe and also pursue stronger policies on achieving deregulation and enhancing economic growth.
( YoY %)
FY16 FY17 FY18 FY19 FY20E FY21E
Real GDP growth 0.9% 1.9% 0.3% 0.0% -6.1% 2.9%
Private Consumption Expenditure 0.0% 1.1% 0.1% -0.6% -6.6% 2.5%
Private Housing Investment 6.3% -1.4% -4.9% 0.5% -6.3% 1.6%
Private Capital Investment -0.4% 4.3% 1.8% -0.3% -8.6% 0.5%
Public Consumption Expenditure 0.7% 0.3% 0.9% 2.3% 1.1% 0.9%
Public Capital Investment 0.6% 0.5% 0.6% 3.3% 3.3% 4.3%
Net Exports (contrib. to GDP growth) 0.8% 0.5% -0.1% -0.2% -1.4% 0.6%
Exports 3.7% 6.4% 1.7% -2.6% -15.4% 8.7%
Imports -0.9% 3.9% 2.6% -1.5% -7.2% 4.1%
Nominal GDP 0.8% 2.0% 0.1% 0.8% -4.8% 3.5%
GDP Deflator -0.2% 0.1% -0.2% 0.8% 1.4% 0.6%
Industrial Production 0.8% 2.9% 0.3% -3.6% -13.8% 6.2%
CPI (excl. fresh food) -0.2% 0.7% 0.8% 0.4% -0.4% 0.3%
Note: E=SMDAM forecasts. SMDAM views are as of 24th Sep. 2020 and subject to updates thereafter without notice (%, YoY except Net Exports)
(Source) Cabinet Office, Bank of Japan, Ministry of Economy, Trade and Industry, Ministry of Internal Affairs and Communications, SMDAM forecasts
7Japanese GDP is forecast to continue recovering
GDP for Apr-Jun quarter (QoQ % annualized) was officially revised-down from -27.8% to -28.1%, which has little
impact for the forecast for 2020.
SMDAM’s quarterly GDP forecast was mildly revised-up for 4Q 2020, 1Q and 2Q 2021 reflecting mild upward revision
made for US and other developed economies.
Note: SMDAM views are as of 24th Sep. 2020 and subject to updates thereafter without notice
(Source) Cabinet Office, Bank of Japan, Ministry of Economy, Trade and Industry, Ministry of Internal Affairs and Communications, SMDAM forecasts
8PM Suga made a very good start with high approval rating
PM Suga and his cabinet made a good start with approval rating soaring to 74% in a survey made by NIKKEI, which is
comparable to the highest rating given to ex PM Abe’s cabinet in March 2013. PM Suga’s cabinet is made of
experienced and capable members.
PM Suga is going to seamlessly succeed emergency policies fighting with COVID-19. He also stresses his priority on
deregulation & digitization of the government and also on enhancing transformation of Japanese industries by such as
supporting start-ups.
PM Suga’s potential weakness could be on diplomatic side, on which PM Abe established strong trust with national
leaders helped by his personality and communication skill. However, PM Suga is a very good listener too, which would
probably help him inheriting diplomatic assets created by PM Abe.
9Fiscal stimulus in Japan
Additional budget spending was approved in June. Total project size is advertised to be 117.1 trillion yen, which is
identical to the spending size approved in April.
31.9 trillion yen is direct budget spending, among which the largest part is for maintaining employment and businesses.
Support for property rents payment was newly added as a program. 10 trillion yen was saved as a reserve preparing
for swift actions when required.
Further top up is expected especially if PM Suga chooses early general election this year or at the beginning of the
next year.
Fiscal stimulus measures in Japan
FY2020 1st supplementary budget spending FY2020 2nd supplementary budget spending
(Apporoved in April) (Approved in June)
Total size Total size
of the Fiscal of the Fiscal
project project
(Trillion yen) budget
spending
Central & Fiscal budget
spending
Central & Fiscal
local FY2020 Investment local FY2020 Investment
government supple & Loan government supple & Loan
budget mentary Program budget mentary Program
budget budget
1) Enhancing quarantine &
medical treatment, and 2.5 2.5 2.5 1.8 - N/A N/A N/A 3.0 N/A
developing drug & vaccine
2) Maintaining employment
80.8 30.8 21.1 19.5 9.7 N/A N/A N/A 14.1 N/A
and businesses
3) Spending for boosting
8.5 3.3 2.8 1.8 0.5 N/A N/A N/A 4.7 N/A
economic recovery
4) Enhancing economic &
15.7 10.2 8.0 0.9 2.3 N/A N/A N/A - N/A
social platform
5) Reserve for additional
1.5 1.5 1.5 1.5 - N/A N/A N/A 10.0 N/A
measures
Total 117.1 48.4 35.8 25.7 12.5 117.1 72.7 33.2 31.9 39.2
Note: As of Jun. 2020
(Source) Cabinet Office, compiled by SMDAM
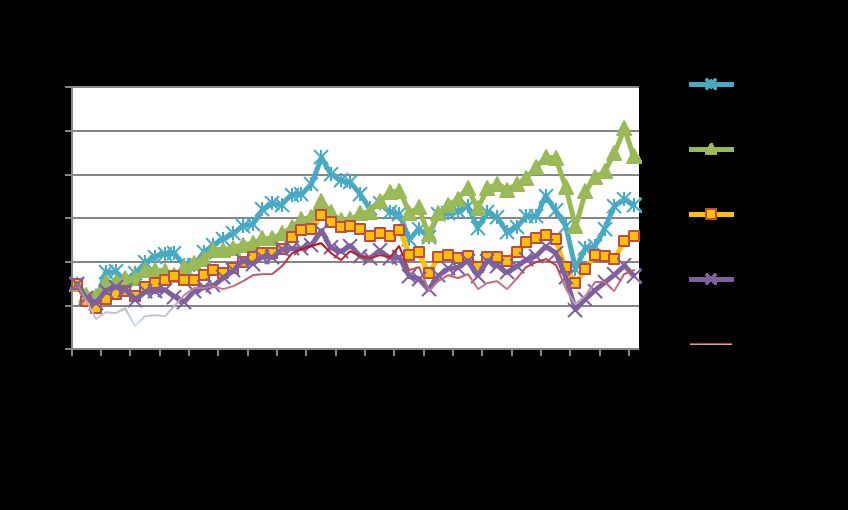
10Exports from Japan continue recovering
Exports from Japan extended recovery in August.
By destinations, Asia ex. China, which is the largest destination, showed strong recovery in August. Exports to US
showed further recovery and US showed strong recovery led by autos. Exports to China and US further strengthened.
Manufacturing side of the Japanese economy is going to lead the recovery going forward.
(billion yen) Export volume to China
1500
1400
1300
1200
1100
Total export volume 1000
900
(billion yen) (seasonally adjusted, yen billion) 800
Jan-10 Jan-11 Jan-12 Jan-13 Jan-14 Jan-15 Jan-16 Jan-17 Jan-18 Jan-19 Jan-20
(Month/Year)
7500
(billion yen) Export volume to US
1650
7000
1500
1350
1200
6500 1050
900
750
6000 600
Jan-10 Jan-11 Jan-12 Jan-13 Jan-14 Jan-15 Jan-16 Jan-17 Jan-18 Jan-19 Jan-20
(Month/Year)
5500 Export volume to Asia ex. China
(billion yen)
4200
5000 4000
Jan-10 Jan-11 Jan-12 Jan-13 Jan-14 Jan-15 Jan-16 Jan-17 Jan-18 Jan-19 Jan-20 3800
(Month/Year) 3600
3400
3200
Note: Data is from Jan. 2010 to Aug. 2020. 3000
(Source) Ministry of Finance, Bank of Japan, compiled by SMDAM. Jan-10 Jan-11 Jan-12 Jan-13 Jan-14 Jan-15 Jan-16 Jan-17 Jan-18 Jan-19 Jan-20
(Month/Year)
11Level of business sentiment moved sideways in September
After making a strong recovery in June and July, PMI for Japan moved sideways in August and September, which was
due to a resurgence of COVID-19 cases.
In September, number of new cases has declined again and Tokyo Metropolitan Government decided to lower COVID-19
warning level by one notch. Unless we see another significant resurgence of COVID-19 cases, peoples’ activity and
business sentiments are expected to show further recovery.
Japan PMI Sub-index for Non-manufacturing PMI Sub-index for Manufacturing PMI
(Month / Year) (Month / Year) (Month / Year)
Note: Data is from Oct. 2017 to Sep. 2020.
Source: IHS Markit, BOJ, compiled by SMDAM.
12Consumer sentiments showed recovery for consecutive 4 months
Economy Watcher Survey covers people working at economic sensitive jobs. Current condition DI in August rose in 4
consecutive months since May.
Future condition DI was slightly lower than current condition DI in August, for which household components were the
main cause in the face of a resurgence in COVID-19 cases, which then calmed down in September.
(Year) (Year)
Note: Data is from Jan. 2012 to Aug. 2020. DI above 50 means condition is better than preceding 2 to 3 months.
(Source) Cabinet Office
13COVID-19 negative impact continues on labor market
Real wage declined by -2.2% YoY in July, which has been in negative territory since April due mainly to decline in
overtime and bonus payment.
Job vacancy / applicants ratio further edged-down in July.
Around 37% workers are on a short-term contract basis and vulnerable to current difficult economic environment.
(%) Real wage payment (YoY %)
Number of employees/ workers
(0,000) (tens of thousands) Job vacancy/ applicants ratio
5
4
3
2
1
0
-1
-2
Inflation
-3 Number of employees
-4 Nominal wage
Real wage payment
-5
2013
2014
2015
2016
2017
2018
2019
2020
(Year) (Year) (Year)
Note; Data is from Jan. 2013 to Jul. 2020. Continuous sample basis. Note; Data is from Jan. 2013 to Jul. 2020. Note; Data is from Jan. 2013 to Jul. 2020.
(Source) Ministry of Health Labour and Welfare (Source) Ministry of Finance (Source) Ministry of Finance
14US presidential campaign gathers pace
US presidential election is just a month away.
FDA in US is going to have a meeting for monitoring the development of COVID-19 vaccines in October.
PM Suga’s cabinet started with a high approval rating, which allures LDP leaders to have an early general election this
year. Lower house needs to have a general election before the current term-end in October 2021.
Upcoming key events
Month Region/Country Events
2020 7 Debate between candidates for US Vice President
15 Debate between candidates for US President (Florida)
US
22 Debate between candidates for US President (Tennessee)
23 FDA in US holds a meeting for COVID-19 vaccines
October
G20 15-16 G20 meeting of finance ministers and head of central banks
EU 29 ECB meeting
1 BOJ TANKAN business survey (September survey)
Japan
28-29 BOJ Monetary Policy Committee Meeting
3 US presidential election
November US
4-5 FOMC meeting
US 15-16 FOMC meeting
December
Japan 17-18 BOJ Monetary Policy Committee Meeting
(Source) Various publications, assembled by SMDAM
15Japan is still competitive in innovation, but has some weaknesses
According to World Economic Forum, Japan was ranked 8th in innovation among 137 economies, which is still
competitive, however on a moderate declining trend. As a strength, R&D in Japan is largely led by companies and
producing the largest number of patents in this ranking.
On the weak side, however, this company-led R&D tends to be “progressive” rather than “innovative” and often lacks in
global collaboration. Government initiative on innovation is stronger in economies such as US, Germany, Singapore and
China.
Facing with strong global competition in developing key technologies such as AI or Autonomous Driving Technology,
Japanese companies are changing approach to more open and more collaborating with global partners.
Global Competitiveness Ranking of Innovation among 137 economies
Switzerland U.S. Israel Finland Germany Netherlands Sweden Japan Singapore Denmark China
Innovation total 1st 2nd 3rd 4th 5th 6th 7th 8th 9th 10th 28th
Capacity for
a) 1 2 3 7 5 6 4 21 23 16 44
innovation
Quality of scientific
b) 1 5 3 8 11 4 13 14 12 16 36
research institutions
Company spending
c) 1 2 3 7 4 8 6 5 17 16 21
on R&D
University-industry
d) 1 2 3 4 7 5 10 23 8 21 28
collaboration in R&D
Gov't procurement of
e) advanced technology 37 2 11 20 6 19 17 23 5 39 10
products
Availability of
f) scientists and 12 2 6 1 11 19 20 8 9 44 29
engineers
g) PCT patents 3 10 6 4 7 9 2 1 12 8 30
Note: All numbers are rankings among 137 economies. Top 10 rankings are highlighted in green. Japan's relative weakness is highlighted in orange.
(Source): World Economic Forum, The Global Competitiveness Report 2017–2018
16Japanese society is changing slowly but steadily
It may look slow or even stagnant from outside, but Japanese society is making necessary reforms.
Many problems are stemming from deep rooted Japanese culture & social practice, which became apparent in the face
of “aging population” and “innovative disruption”.
Change of the deep rooted culture & practice should take time, however, it is making progress, and will eventually put
Japan in an advantage over other advanced economies, which also have aging population lagging Japan.
Hurdles for
Aging population
achieving business reform
Lifetime employment
Forcing Japanese Seniority based compensation
reform companies Rising social insurance costs
Inefficient working practice
Insufficient entrepreneurship
Innovative Shortage of new technology
disruption professionals, etc.
17Japanese society is changing slowly but steadily
Examples of long-term social challenges and progressing solutions
Source of problems Challenges Solutions
Unconventional "macro-slide" has been implemented to curb
pension payment increase referring to "low birth rate" and so on.
a) Pension system reform
Encourage people to continue working into 70's.
Encourage people to shift saving to investments. (NISA*, DC)
1. Aging population Capital investment for enhancing labor efficiency. (FA, AI, IoT,
autonomous driving car, renovating software, etc. )
b) Labor shortage Allowing more foreign workers.
Encourage people to delay retirement.
Support female workers. (increase nursery, etc.)
Pension system reform.
2. Weak Gradual adjustment of seniority based wage system to shift
c) Clearing peoples worry for the future
consumption compensation from elderly to younger workers.
life
propensity Increase of new generation companies.
Increase of young people working with non-seniority wage system.
Elder people to retire or continue working at lower wage.
3. Rigid Gradual adjustment of seniority based wage system.
d) Encouraging business structure
employment More fluid labor market enabling companies to make restructuring.
reform
practice Young people are not expecting lifetime employments and focusing
on building own career (already progressing).
4. Inefficient
e) Enhancing labor efficiency Work style reform to progress.
working practice
5. Insufficient
Increase of successful new generation companies.
entrepreneurship
f) Enhancing “challenge spirit” Increase of young people with skills of new technologies.
6. Shortage of new
g) Education reform Young and talented people choose new generation companies
technology
rather than old & large firms (already progressing).
professionals
Note: *NISA is “Nippon Individual Savings Account”. (Source) SMDAM
18Outlook for
Japanese Stock Market
19Adjustment in tech-stocks in US will have limited impact on Japan
SMDAM short-term view
Adjustment in over-valuation of technology stocks are progressing in US, however, negative effects on
Japanese stocks is going to be limited. Rotation to value stocks is expected to support Japanese market,
which is rich in value stocks, and also strengthening recovery in manufacturing industries is supportive to
Japanese manufacturing companies. Japanese stocks are relatively inexpensive in stock valuation and
seems to be well positioned if investors further shift focus from “with corona theme” to ongoing recovery in
physical economy.
Longer-term outlook (6-months and beyond)
Until effective vaccines become available worldwide, life with COVID-19 continues. Sporadic resurgence of
infection cases could slow down the pace of economic recovery, which will bring in volatility to the stock prices.
However in the long-term, COVID-19 will be conquered and recovery in economy and stock prices will
continue into a new expansion phase after a short but deep recession, which is just ending.
Note: SMDAM’s projection is as of 24th Sep. 2020 and subject to updates without notice.
20Base scenario & Upside / Downside risks for our forecasts
Our Base Scenario is assuming the following views:
• Another global hard lockdown caused by 2nd wave of COVID-19 pandemic can be avoided.
• Severe tensions between US and China go on, however, US is going to avoid making a fatal blow to the global economy.
• US economy contracts in 2Q and recovery continues afterwards.
• Japanese yen does not get extremely stronger beyond 100 yen against US$.
• Tension in the East Asia or Middle East does not get out of control.
• Central banks continue massive monetary easing and also large fiscal spending is made and topped up when necessary.
Upside Risks include:
• Outlook for COVID-19 pandemic gets brighter by such as progress in developing vaccine or drugs.
• US and China make significant concessions in the trade negotiations.
• Stronger-than-expected global growth.
• Denuclearization in Korean peninsula makes a visible progress.
• Japanese economy gets stronger than expected boosted by large fiscal spending.
Downside Risks include:
• 2nd wave of COVID-19 pandemic emerges and lockdowns cause severe economic disruption globally.
• Global economy falls into a serious and long lasting depression.
• Trade negotiation between US and China completely breaks up igniting a decades of power struggle.
• Seriously escalating geo-political tensions in Middle East & East Asia.
• Political turmoil flares up in US running up to US presidential election in 2020.
• Populism gains in Europe further destabilizing EU.
Note: SMDAM’s projection is as of 24th Sep. 2020 and subject to updates without notice.
21Japanese stock market shows resilience in tech-stock-setback
US stock market fell led by technology stocks, which had been over-valued.
European stock markets also fell in sympathy with US stocks and also on the back of resurgence of COVID-19 in the
region.
Japan has been doing relatively better than these markets so far in September, for which relatively low stock
valuation and recovering value stocks are working behind.
2212M forward EPS consensus forecast edged up lately
After digesting Apr-Jun quarterly earnings announcements, 12M EPS consensus forecast stopped deteriorating and
bounced back lately. Given the latest EPS forecast of 93, TOPIX at 1600 corresponds to PER of 17.2, which is higher
than the historical range between 11 times and 15 times.
This is mainly caused by even more extreme valuation for US stock prices, which was created by massive liquidity
pumped in by central banks and sharp fall in bond yields. High stock valuation in US can theoretically be supported by
relative valuation vs. interest rates, however, extreme over-valuation in technology stocks in US is going to be adjusted.
23Investors’ activities were relatively calm in August and so far in September
Foreign investors turned to selling Japanese equities in September, however, activities by investors were relatively calm.
Many companies are postponing share buy-backs this fiscal year in the face of adverse business environments caused
by COVID-19.
24Advancing Corporate Governance Code and Stewardship Code
Stewardship Code (SC) was set in February 2014. Investors are taking more pro-active approach in talking to the
companies and exercising proxy voting rights. Financial Services Agency discloses the name of institutional investors,
which publicly accepted SC.
After inception of Corporate Governance Code (CGC) in June 2015, pressure has been increasing on companies to
improve its governance, efficiency and shareholder returns.
These two codes have been progressively reviewed and enhanced, and making visible impact on the corporate behavior
and investors’ attitudes as shareholders.
In the recent amendment of CGC, companies are required to explain the rationale of “cross holdings” or “strategic
holdings” of other companies’ shares, which implicitly provide protection against takeovers and hostile shareholder
actions, and is often negative for achieving shareholder value.
SC was reinforced in March 2020 requiring investors to evaluate ESG factors.
Total number of institutional investors, which publicly
declared acceptance of the stewardship code
Trust banks 6
Investment management companies 191
Insurance companies 23
Pension funds 53
Others (include proxy voting advising companies) 7
Total 280
Note: As of 13th Mar. 2020.
(Source) Financial Services Agency
25Business restructuring is progressing for Japanese companies
Japanese companies are getting more and more willing to make positive business restructuring.
Number of M&A deals between Japanese companies (IN-IN) rose from 2,174 in 2006 to 2,814 in 2018 and further to
2,987 in 2019, which is an evidence that business restructuring is progressing in Japan.
Number of the deals of Japanese companies acquiring overseas businesses (IN-OUT) also rose from 421 in 2006 to 777
in 2018 and further to 824 in 2019.
26Behavior of Japanese companies are making positive changes
Share buyback is getting popular among Japanese companies as one of the powerful tools for disposing of accumulated
liquidity in the B/S and enhancing EPS growth as well as ROE.
Dividends also renewed historical record in FY2019 and expected to increase further in FY2020. Dividend and share buy-
back are forecast to decline in FY2021 due to COVID-19 impact.
27Disclaimer Please read this disclaimer carefully. This material is for non-Japanese institutional investors only. The research and analysis included in this report, and those opinions or judgments as outcomes thereof, are intended to introduce or demonstrate capabilities and expertise of Sumitomo Mitsui DS Asset Management Company, Limited (hereinafter “SMDAM”), or to provide information on investment strategies and opportunities. Therefore this material is not intended to offer or solicit investments, provide investment advice or service, or to be considered as disclosure documents under the Financial Instruments and Exchange Law of Japan. The expected returns or risks in this report are calculated based upon historical data and/or estimated upon the economic outlook at present, and should be construed no warrant of future returns and risks. Past performance is not necessarily indicative of future results. The simulated data or returns in this report besides the fund historical returns do not include/reflect any investment management fees, transaction costs, or re-balancing costs, etc. The investment products or strategies do not guarantee future results nor guarantee the principal of investments. The investments may suffer losses and the results of investments, including such losses, belong to the client. The recipient of this report must make its own independent decisions regarding investments. The opinions, outlooks and estimates in this report do not guarantee future trends or results. They constitute SMDAM’s judgment as of the date of this material and are subject to change without notice. The awards included in this report are based on past achievements and do not guarantee future results. The intellectual property and all rights of the benchmarks/indices belong to the publisher and the authorized entities/individuals. This material has been prepared by obtaining data from sources which are believed to be reliable but SMDAM can not and does not guarantee its completeness or accuracy. All rights, titles and interests in this material and any content contained herein are the exclusive properties of SMDAM, except as otherwise stated. It is strictly prohibited from using this material for investments, reproducing/copying this material without SMDAM’s authorization, or from disclosing this material to a third party. Registration Number: The Director of Kanto Local Finance Bureau (KINSHO) No.399 Member of Japan Investment Advisers Association, The Investment Trusts Association, Japan and Type Ⅱ Financial Instruments Firms Association © Sumitomo Mitsui DS Asset Management Company, Limited
You can also read