Changes in the Portfolio Management and Construction under the Pandemic Era
←
→
Page content transcription
If your browser does not render page correctly, please read the page content below
E3S Web of Conferences 275, 01005 (2021)                                                              https://doi.org/10.1051/e3sconf/202127501005
EILCD 2021

         Changes in the Portfolio Management and Construction under
         the Pandemic Era
         Ruipeng Tan1,
         1School   of Liberal Arts, University of Massachusetts Boston, Dorchester, MA 02125, The United States;

                       Abstract. This paper focuses on comparing portfolio management and construction before and after the
                       coronavirus. First, this paper presents the importance of building up portfolios for investors to diversify their
                       risks. Theories on portfolio management are discussed in this section to show how they have been developed
                       to help on investing and reduce risk. Then, the paper moves on to show the impact of the pandemic on the
                       financial market and portfolio management. Sample data on tech stock returns are collected to perform a
                       Monte Carlo simulation on portfolio construction to find out the efficient portfolio before and after the
                       COVID-19 outbreak. The efficient portfolio is build based on the Markowitz theory to find the combination.
                       Comparisons between these portfolio constructions are made to find out the changes in portfolio management
                       and construction under the pandemic era. In conclusion, this paper presents how pandemic has changed and
                       impacted the investments and lists recommendations on future portfolio management and construction.

      1 INTRODUCTION
                                                                               2 LITERATURE REVIEW
      Portfolio construction is the common way for investors to
      reduce the risk by applying diversified portfolios across                Portfolio construction is one of the critical issues for
      different asset classes and strategies. Portfolio                        practitioners and academicians in the quantitative finance
      construction is the selection of securities for inclusion in             field. It is a disciplined, personalized process. In
      a portfolio and the determination of their appropriate                   constructing a portfolio, the individual risk and return
      weights of each security in that portfolio. The Markowitz                characteristics of the underlying investments must be
      model suggests that a reasonable goal for portfolio                      considered along with your unique needs, goals, and risk
      construction should be to form a portfolio with the highest              considerations. The evolution of portfolio construction
      return for a given level of risk. A portfolio with such                  began in 1952 when Harry Markowitz published a thesis
      characteristics is called an efficient portfolio, and it has             named Portfolio Selection. Numbers of empirical studies
      been widely accepted as a classic model for optimal                      regarding portfolio construction occurred years later.
      portfolio construction.                                                  Sharpe in 1964 afterward expanded on Markowitz's
          Global capital markets have seen significant declines                theory with the Capital Asset Pricing Model, which
      due to the impact of the pandemic outbreak. According to                 introduced alpha, the excess return of the asset relative to
      the Centers for Disease Control and Prevention, there are                the return of the benchmark index, and beta, the risk of the
      over 26 million confirmed cases in the U.S. by the end of                asset relative to the market [4].
      January 2021 [1]. Major national markets around the                           One of Markowitz's innovations was to introduce risk
      world experienced significant declines due to the                        into the capital theory model and to use mathematical and
      continued spread of the epidemic and major stock                         statistical tools to demonstrate that portfolio investment
      valuations in Europe and the U.S. plummeted with the                     can diversify risk. In his view, the goal of the investment
      crude oil once fell below normal levels. The market fears                is to maximize return at the same level of risk or minimize
      that the COVID-19 will cause companies to miss capacity,                 risk at the same level of return. Return and risk are like
      revenue, and earnings expectations in the next few years,                two sides of the same coin and cannot be separated.
      dragging down macro data in various countries. The                       Markowitz uses the mean of the historical returns to
      Federal Reserve cut interest rates to a record low of 0-0.25%            portray the investor's expected return and the variance of
      in March 2020 in succession to ease the liquidity pressure               the portfolio return to describe the risk. Risk, or the
      that continues to be transmitted between different capital               variance of portfolio returns, can be split into two
      markets [2, 3]. Under this global financial turmoil, many                components. The systematic risk can be expressed as the
      portfolios have been taking great hits from COVID-19,                    covariance between assets and the uncertainty caused by
      and it is meaningful to find out what changes the                        factors that affect all assets. The non-systematic risk is
      pandemic has brought to the portfolio construction and                   expressed as the variance of individual asset returns,
      any shifts in the investments.                                           which is the uncertainty of returns caused by factors of

         *Ruipeng.Tan001@umb.edu
© The Authors, published by EDP Sciences. This is an open access article distributed under the terms of the Creative Commons Attribution License 4.0
(http://creativecommons.org/licenses/by/4.0/).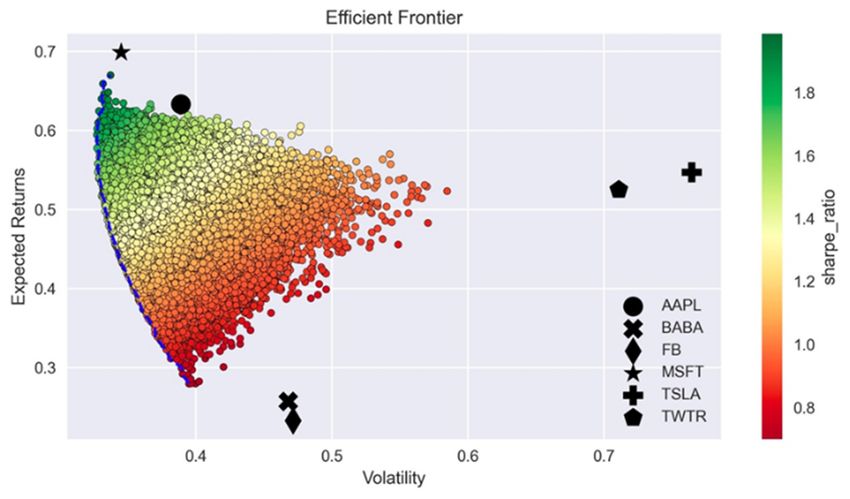
E3S Web of Conferences 275, 01005 (2021)                                                       https://doi.org/10.1051/e3sconf/202127501005
EILCD 2021

      individual assets. Markowitz used mathematical methods              simulation as it is generating samples from the probability
      to prove that when investors reduce the correlation of              distribution. The six stocks are Apple Inc (AAPL),
      stocks in a portfolio, they can reduce the risk of achieving        Alibaba Group Holding Ltd (BABA), Facebook, Inc.
      this return by investing in more stocks at a certain level of       (F.B.), Microsoft Corporation (MSFT), Tesla Inc (TSLA),
      return. Markowitz's second innovation is to guide                   and Twitter Inc (TWTR). The study period is from Jan
      investors in identifying the optimal level of diversification       2018 to Dec 2020. The time period from Jan 2018 to Dec
      in order to determine the best portfolio. Guided by                 2019 is set to be the pre-crisis period, and the time period
      investment objectives and diversification principles,               from Jan 2020 to Dec 2020 is set to be the post-crisis
      investors can identify optimal portfolios at different risk         period.
      levels, which Markowitz outlines on a two-dimensional
      plane with an efficient frontier curve. With the range of
                                                                          3.1 Data Source
      options available, investors can choose the portfolio that
      satisfies them most according to their respective risk              All the stock price data are public data obtained from
      preferences. These principles and theories have been                Yahoo Finance [5].
      widely used in the portfolio management area. This paper
      also applies the Markowitz portfolio construction to study
      the changes in the portfolio construction before and after          3.2 Data Description and Analysis
      the outbreak of the pandemic to see what kinds of
                                                                          As shown in Figure 1, we can see the close price of the six
      adjustment that has been brought to the market.                     stocks from 2018 to 2019 in the pre-crisis period. In this
                                                                          period, Microsoft shows strong growth in the past two
      3 METHOD                                                            years. Facebook and Alibaba Group had a more volatile
                                                                          growth from 2018 to 2019. Tesla and Apple have stable
      In this research paper, the portfolio analysis of six stocks        growth in this period, while Twitter had a flatter growth
      is conducted to construct an efficient portfolio under the          trend in this period.
      Markowitz theory. The Monte Carlo method is used in the

                                       Figure 1. The stock price of six tech stocks from 2018 to 2019

          Figure 2 shows the six stocks in 2020. All these six            stocks started to soar to around $600 at the end of 2020
      stocks got a hit at the beginning of 2020 when the                  from around $100 at the beginning of 2020. The Tesla
      pandemic started to spread. Since March 2020, the Tesla             stock soared over six times in 2020.

                                                                      2
E3S Web of Conferences 275, 01005 (2021)                                                        https://doi.org/10.1051/e3sconf/202127501005
EILCD 2021

                                            Figure 2. The stock price of six tech stocks in 2020

          Below is a table on the descriptive data of Apple.
      Alibaba and Facebook stocks returns. The average daily                Table1.     Descriptive data on Apple, Alibaba Group, and
                                                                                        Facebook before and after the pandemic
      stock return for Apple was 0.12% before the pandemic
      outbreak, and this raised to 0.28% in the post-crisis period.
                                                                                       AAPL              BABA              FB
      The variance of the Apple stock returns also increased
      from the pre-crisis period to the post-crisis period. Perhaps                    before   after    before   after    before   after
      the biggest concern for investors in technology companies,
                                                                           Mean        0.001    0.003    0.001    0.001    0.000    0.002
      especially technology hardware companies, is the impact
      of a coronavirus pandemic on global supply chains and
                                                                           Standard
      shipments. With Apple's supply chain spread across                   Error
                                                                                       0.001    0.002    0.001    0.002    0.001    0.002
      multiple countries, its shareholders are not immune to
      concerns about the outbreak. In fact, Apple has long                 Median      0.002    0.002    0.002    0.001    0.001    0.002
      warned that production challenges and slowing demand in
      China will cause the company to fall behind its earnings             Standard
                                                                                       0.017    0.029    0.021    0.026    0.021    0.029
      guidance for its second fiscal quarter. Fortunately, Apple           Deviation
      is much more than a technology hardware company; it's a
      service business. The business in question earns revenue             Sample
                                                                                       0.000    0.001    0.000    0.001    0.000    0.001
      from services such as e-sales and subscriptions from the             Variance
      App Store, advertising, iCloud, AppleCare, and licensing,
      and has become the second-largest segment after iPhone.              Kurtosis    3.907    3.703    0.358    3.603    15.535   3.508
      In the first quarter of fiscal 2020, Apple's services revenue
                                                                           Skewness    -0.425   -0.061   -0.075   -0.598   -1.295   -0.197
      rose 17% year-over-year, driven by double-digit growth
      recorded across all geographic segments, according to                Range       0.170    0.248    0.136    0.223    0.298    0.245
      Forbes [6]. The coronavirus outbreak has caused more
      people to stay home, spurring Apple's services revenue in
                                                                              As for Facebook, the average daily stock return was
      the period.
                                                                          0.04% before the pandemic outbreak, and this raised to
          As for Alibaba Group, the average daily stock return
                                                                          0.15% in the post-crisis period. The variance of the
      was 0.05% before the pandemic outbreak, and this raised
                                                                          Facebook stock returns increased from 0.04% in the pre-
      to 0.08% in the post-crisis period. The variance of the
                                                                          crisis period to 0.08% in the post-crisis period. Facebook
      Alibaba stock returns increased from 2.08% in the pre-
                                                                          reported an 18% increase in first-quarter revenue,
      crisis period to 2.59% in the post-crisis period. This was
                                                                          indicating strong demand for advertising before the
      due to the interruption of the IPO of the Ant Group, one of
                                                                          Covid-19 pandemic hit marketing budgets [8]. The
      the largest subsidiary companies of Alibaba. This abrupt
                                                                          company's first-quarter sales were $17.7 billion,
      stop of the IPO was announced due to the statement from
                                                                          according to data compiled by Bloomberg, and the results
      Chinese officials that the Ant Group did not meet the
                                                                          include just a few weeks after the coronavirus blockade
      Chinese regulatory and requirements regarding its
                                                                          began hitting the economy in March [9]. The company's
      operation as a Fintech company [7]. If this Ant Group IPO
                                                                          operations have seen signs of stabilization after an initial
      were not into a sudden cutoff, the year of 2020 could be a
                                                                          steep drop in advertising revenue in March. The
      huge mark for Alibaba to show a strong group in this tough
                                                                          company's services are getting more and more use as
      year. Alibaba's business was also thriving under the
                                                                          millions of people hide away, looking for ways to be
      pandemic outbreak as the demand for online shopping and
                                                                          entertained and stay connected online. The company said
      delivery went up during the lockdown period.
                                                                          the average daily user base for all Facebook apps,
                                                                          including Instagram and WhatsApp, rose to 2.36 billion in
                                                                          March from 2.26 billion in December [10]. The core social

                                                                      3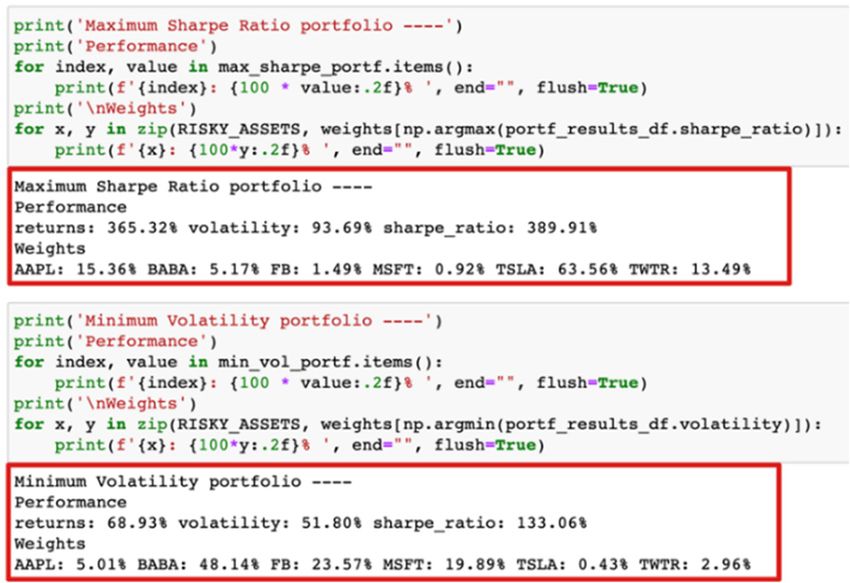
E3S Web of Conferences 275, 01005 (2021)                                                             https://doi.org/10.1051/e3sconf/202127501005
EILCD 2021

      network at Facebook now has 1.73 billion daily users,                      For Tesla, the average daily stock return was 0.10%
      compared with 1.66 billion in the last month of 2019 [9].              before the pandemic outbreak, and this raised to 1.00% in
      This spike is likely to have less of an impact on Facebook's           the post-crisis period. The variance of the Tesla stock
      business than in previous quarters. Many of the company's              returns increased from 0.11% in the pre-crisis period to
      most popular features during the pandemic (including                   0.31% in the post-crisis period. Tesla, founded by Musk,
      voice calling and direct messaging) were not sizable                   saw its share price nine-fold from $88.60 at the beginning
      revenue areas for the company. Facebook also received                  of 2020 to a peak of $705.67 at the end of the year, which
      more than half of its sales from small businesses suffering            has seen the company's market capitalization grow from
      from Covid-19 lock-in and recession. However, some are                 $76 billion to $669 billion. This performance has left no
      optimistic that the popularity of the company's messaging              shadow of the epidemic that shut down several of their
      products will pay off in the near future, which will provide           production lines early last year. The demand and trend for
      alternative business for the advertising industry.                     a new energy company and the investment have been
          As for Microsoft corporation, the average daily stock              soaring in the year 2020, and Tesla is for sure one of the
      return was 0.13% before the pandemic outbreak, and this                largest winners in this game.
      raised to 0.17% in the post-crisis period. The variance of                 For Twitter, the average daily stock return was 0.10%
      the Facebook stock returns increased from 0.02% in the                 before the pandemic outbreak, and this raised to 0.29% in
      pre-crisis period to 0.07% in the post-crisis period. As               the post-crisis period. The variance of the Twitter stock
      more and more people work remotely from home, the use                  returns increased from 0.10% in the pre-crisis period to
      of its cloud infrastructure services, including Microsoft              0.15% in the post-crisis period.
      Teams, Windows Virtual Desktop, and Power B.I., has
      increased dramatically, with demand in areas with social
                                                                             3.3 The Monte Carlo Simulation
      isolation or social distancing measures. In areas with
      social isolation or shelter-in-place initiatives, demand for           Monte Carlo simulation is a method that iteratively
      online services jumped. Microsoft is benefiting from high              generates time series by setting up a stochastic process,
      growth in cloud services revenue and a subscription-based              calculates parameter estimates and statistics, and then
      transformation of its traditional business. Microsoft Azure            studies their distribution characteristics. The Monte Carlo
      has become the cloud service second only to Amazon                     Method is also known as a computerized stochastic
      AWS, and the increased weight of cloud services has                    simulation method, which is a computational method
      given Microsoft more resilience in this epidemic [11].                 based on random numbers and is a generic term for a class
      Microsoft's relationship with competitors such as Apple                of stochastic methods [12]. The characteristic of this type
      and Google is also improving, and the Office suite has                 of method is that the approximate result can be calculated
      become one of the most popular apps for iOS/Android.                   on random sampling, and as the sampling increases, the
      Subscription-based individual products also add to the                 probability that the result is the correct result gradually
      sustainability of revenue. Businesses won't stop their                 increases. Until the true result is obtained by abandoning
      cloud service needs because of an epidemic, and                        random sampling and using a deterministic method like
      individuals won't stop using genuine Office because of an              full sampling, it is impossible to know whether the result
      epidemic. This simple fact is the source of Microsoft's                obtained so far is the actual result. For many problems, it
      strong resilience.                                                     is often the simplest method of computation and
       Table2.     Descriptive data on Microsoft, Tesla, and Twitter
                                                                             sometimes the only feasible one. Monte Carlo methods are
                      before and after the pandemic                          widely used in the fields of financial engineering,
                                                                             macroeconomics, and computational physics.
                   MFST              TSLA              TWTR

                   before   after    before   after    before   after        4 RESULT AND DISCUSSION
       Mean        0.001    0.002    0.001    0.010    0.001    0.003
                                                                             This paper performs data analysis on these six stock
       Standard                                                              returns using over 1000 Monte Carlo simulations to
                   0.001    0.002    0.002    0.004    0.001    0.002
       Error                                                                 perform the portfolio analysis and find out the optimal
                                                                             portfolio construction before and after the pandemic
       Median      0.002    0.003    -0.001   0.007    0.002    0.003        outbreak. Below is the efficient frontier before the
                                                                             pandemic outbreak using stock data from 2018 to 2019.
       Standard
       Deviation
                   0.015    0.028    0.034    0.056    0.032    0.039        The portfolio construction is listed below.
                                                                                Table3.     Portfolio Construction of six stock before the
       Sample                                                                                      pandemic outbreak
                   0.000    0.001    0.001    0.003    0.001    0.002
       Variance

                                                                               Before the             BAB                              TWT
                                                                                            AAPL              FB      MSFT     TSLA
       Kurtosis    2.719    6.398    5.014    2.267    10.236   6.297          pandemic                A                                R
                                                                               Minimum
                                                                               Volatility   32.09%   1.54%   0.07%    59.42%   0.97%   5.91%
       Skewness    -0.010   -0.070   0.492    -0.181   -0.682   -0.808         portfolio
                                                                               Maximum
       Range       0.130    0.290    0.316    0.410    0.365    0.361           Sharpe
                                                                                            27.08%   1.87%   14.09%   48.64%   7.46%   0.86%
                                                                                 Ratio
                                                                               portfolio

                                                                         4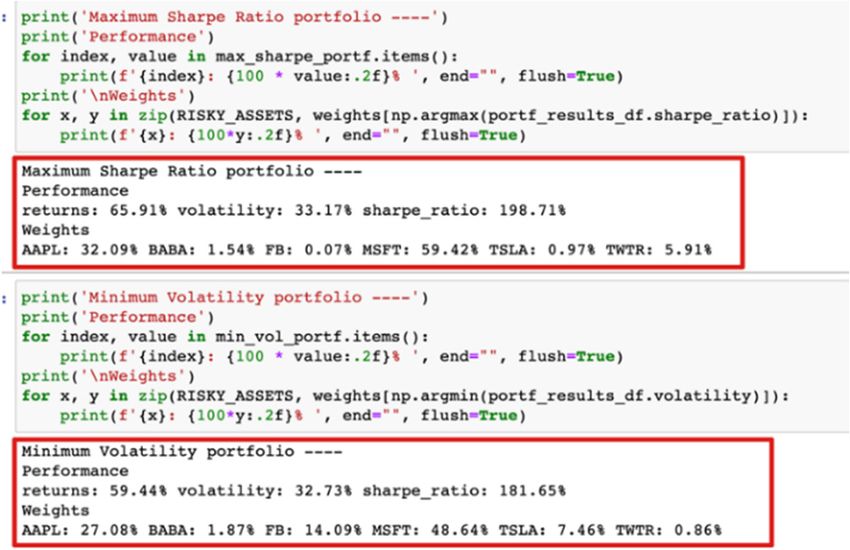
E3S Web of Conferences 275, 01005 (2021) https://doi.org/10.1051/e3sconf/202127501005
EILCD 2021
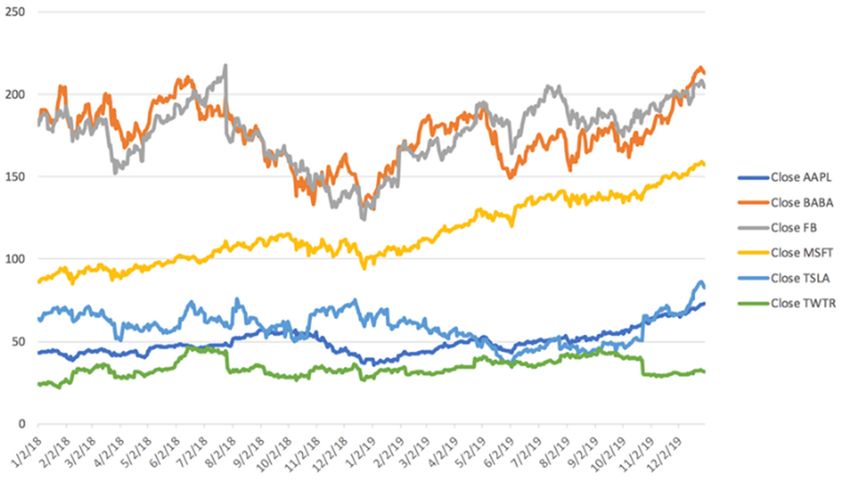
Figure 3. Efficient frontier graph on the portfolio using Matlab before the pandemic outbreak
Looking at the portfolio construction before and after
the pandemic outbreak, we can see that the weights in Table4. Portfolio Construction of six stock after the
pandemic outbreak
Tesla got greatly increased while the weight in Microsoft
stock decreased from around 50% to a much lower level. After the
AAPL BABA FB MSFT TSLA TWTR
pandemic
Minimum
Volatility 15.36% 5.17% 1.49%% 0.92% 63.56% 13.49%
portfolio
Maximu
m Sharpe
5.01% 48.14% 23.57% 19.89% 0.43% 2.96%
Ratio
portfolio
Figure 4. Efficient frontier graph on the portfolio using Matlab after the pandemic outbreak
From the comparison between these two portfolio such as Microsoft, Apple, Amazon, and Google have
constructions, we can see that COVID-19 has shifted the performed the best. There are three main reasons why
investment focus in the high-tech industry. New energy these companies have managed to rise against the trend
and the electric vehicle worth great attention and are seen and even hit new all-time highs: good financial condition,
as the next future trend. While for tech companies whose positive market expectations, and the Federal Reserve's
core business is traditional hardware like Microsoft, the quantitative easing policy. A good financial position is a
portfolio weights are expected to decrease. major reason. With Apple's cash reserves exceeding $200
billion and Microsoft's cash reserves exceeding $130
billion, there was no pressure to survive the epidemic.
5 RECOMMENDATION AND Second, while the epidemic has also had a significant
CONCLUSION negative impact on large tech stocks, they will have far
more stamina to persevere in difficult times, and can even
Since February 2020, global stock markets have plunged use difficult times to acquire others' high-quality assets
due to the epidemic and have rebounded to varying and expand their reach. This is because these companies
degrees. In this round of rebounds, the technology giants
5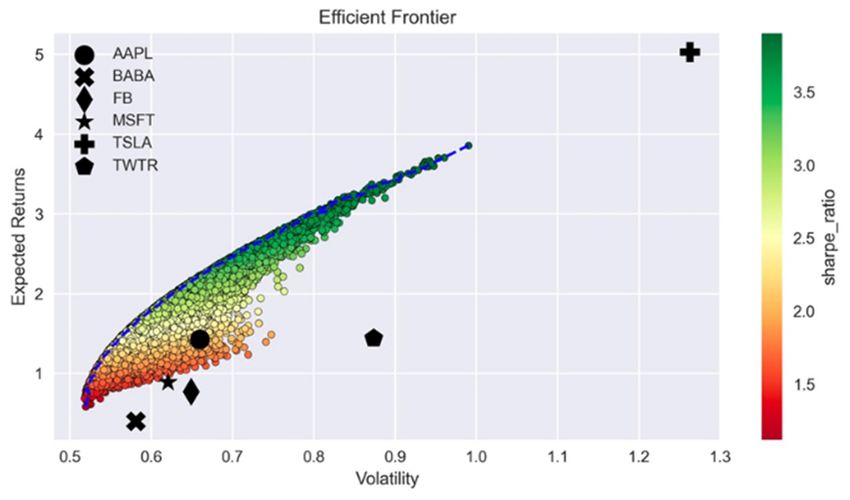
E3S Web of Conferences 275, 01005 (2021)                                                      https://doi.org/10.1051/e3sconf/202127501005
EILCD 2021

      have deep moats, strong innovation capabilities, and more           investment potential if the outbreak is contained. For
      cash reserves. In order to cope with the downward                   institutional investors, the private equity market has
      pressure of the economy, the Federal Reserve has offered            investment potential, especially as infrastructure
      zero interest rate + unlimited quantitative easing policy.          investment is expected to increase (thanks in part to
      So much liquidity will surely find a suitable place to go,          stimulus measures aimed at boosting economic activity).
      which has provided the impetus for the recent rally of U.S.         There will be an increasing number of investment
      stocks. For the tech giants, there is actually a divergence.        opportunities to support a sustainable and resilient
      If a company's business is mainly subscription-based paid,          economic recovery after the epidemic, such as
      enterprise cloud services for individual users, the trend is        investments to address climate change and other important
      stronger during the epidemic for Amazon, Microsoft. If it           issues.
      relies more on advertising placed by merchants, the
      performance is relatively weaker such as Facebook and
      Google.                                                             6 APPENDIX
           Certain regions and asset classes did quite well in the
      face of the turmoil caused by the epidemic and the                  6.1 Python Code and Result for Portfolio
      accompanying embargo, especially large-cap technology               Construction Testing
      and upper retail stocks, thanks to the "work-from-home"
      trend. One of the big positive news is that the vaccine trial       Results on data from 2018.01.01 to 2019.12.31
      is expected to be successful by the end of 2020. However,
      it is unclear how long it will take to launch the vaccine and
      how many people will be willing to receive it. Until there
      is widespread vaccination, it is feared that many regions
      will continue to suffer from subsequent outbreaks. As a
      result, the global growth outlook will remain uncertain,
      and private sector spending (both private consumption and
      investment) is likely to be depressed until effective
      vaccines and treatments are universally adopted. Equity
      markets may also suffer if cyclical economic data lose
      momentum, and the dip will be particularly severe if
      markets find asset prices disconnected from economic
      fundamentals.
           While investors may be optimistic that a potent new
      crown vaccine will be available in 2021, the path to                   Results on data from 2020.01.01~2020.12.31
      economic recovery remains uncertain. We, therefore, need
      a broader range of investment vehicles that are not limited
      to regions, sectors, and strategies that have performed well
      recently. While the severe recession is over, a return to the
      pre-epidemic growth trajectory is still several years away.
      While some countries are facing a new wave of infections
      and city closures, the global economy has recovered from
      the deep recession triggered by the epidemic. Beyond the
      sectors that thrived during the epidemic crisis, investors
      are hoping to find new sources of potential returns to
      benefit from the recovery process going forward. Much of
      this depends on the successful application of effective
      vaccines and drug therapies. New vaccines appear to offer
      hope, but going forward, investors will need to keep a
      close eye on important macroeconomic data points for
      signs of renewed growth momentum. European and Asian
                                                                          6.2 Descriptive Data on the Sample Stocks
      equities, value sectors, and corporate bonds may hold

                                                                      6
E3S Web of Conferences 275, 01005 (2021) https://doi.org/10.1051/e3sconf/202127501005
EILCD 2021
7. Gurdus, Lizzy. (2020). Ant Group's IPO won't happen
REFERENCES for at least six months after regulatory hurdles, China
ETF issuer says. The CNBC. URL:
1. Markowitz, H. M. (1991). Foundations of portfolio https://www.cnbc.com/2020/11/14/why-the-ant-
theory. The journal of finance, 46(2), 469-477. group-ipo-wont-happen-for-at-least-six-months.html
2. CDC. (2021). COVID Data Tracker. Centers for 8. Rodriguez, S. (2020). Facebook soars after reporting
Disease Control and Prevention. URL: 'stability' in ad revenue after fall in March. The
https://covid.cdc.gov/covid-data- CNBC Website. URL:
tracker/#datatracker-home https://www.cnbc.com/2020/04/29/facebook-fb-
3. Choi, D. (2020). Fed slashes main interest rate to near earnings-q1-2020.html
zero in historic move designed to cushion economic 9. Wagner. K. (2020). Facebook Surges After Revenue
blow of coronavirus pandemic. The Business Insider. Holds Up in Midst of Pandemic. The Bloomberg
URL: https://www.businessinsider.com/fed-interest- Technology. URL:
rate-cut-zero-bond-holdings-coronavirus-pandemic- https://www.bloomberg.com/news/articles/2020-04-
economy-2020- 29/facebook-says-revenue-held-up-in-midst-of-
3#:~:text=The%20Federal%20Reserve%20on%20S pandemic-shares-surge
unday%20slashed%20its%20benchmark%20interest
%20rate,bond%20holdings%20by%20%24700%20b 10. Dreller, J. (2020). Facebook signals online
illion. advertising to take a big hit. The digital commerce
360. URL:
4. Sharpe, W. F. (1964). Capital asset prices: A theory of https://www.digitalcommerce360.com/2020/04/30/fa
market equilibrium under conditions of risk. The cebook-signals-online-advertising-to-take-a-big-hit/
journal of finance, 19(3), 425-442.
11. Digna, L. (2021). Top cloud providers in 2021: AWS,
5. Yahoo Finance website. (2021). Stock return data/ Microsoft Azure, and Google Cloud, hybrid, SaaS
URL:Data source website: https://finance.yahoo.com players. URL: https://www.zdnet.com/article/the-
6. Forbes. (2020). Apple Stock Is Up 50% This Year. top-cloud-providers-of-2021-aws-microsoft-azure-
What's Going On? URL: google-cloud-hybrid-saas/
https://www.forbes.com/sites/greatspeculations/2020 12. Palisade. (2020). What is Monte Carlo Simulation?
/08/20/apple-stock-is-up-50-this-year-whats-going- URL:
on/?sh=20a273226505 https://www.palisade.com/risk/monte_carlo_simulati
on.asp
7You can also read