A Roadmap for Indonesia's Power Sector: How Renewable Energy Can Power Java-Bali and Sumatra - Agora Energiewende
←
→
Page content transcription
If your browser does not render page correctly, please read the page content below
A Roadmap for
Indonesia’s Power Sector:
How Renewable Energy Can Power Java-Bali and Sumatra

Summary for
Policy Makers

            in cooperation with:
A Roadmap for Indonesia’s Power Sector:
How Renewable Energy Can Power Java-Bali and Sumatra

IMPRINT
A Roadmap for Indonesia’s Power Sector:
How Renewable Energy Can Power Java-Bali and Sumatra

Study by:                                                     Study team:

Monash Grid Innovation Hub/Australia Indonesia Centre         Dr. Ariel Liebman - Monash Grid Innovation Hub
Monash Energy Materials and Systems Institute                 Warwick Forster - Apogee Energy
Monash University                                             Mentari Pujantoro and Philipp Godron - Agora Energiewende
Wellington Rd, Clayton VIC 3800 | Australia                   Fabby Tumiwa, Jannata Giwangkara, and
T: +61 9905 1049                                              Agus Tampubolon - Institute for Essential Services Reform
www.monash.edu | memsi@monash.edu

                                                              The summary for policy makers was written by:
Institute for Essential Services Reform
                                                              Fabby Tumiwa, Institute for Essential Services Reform
Jalan Tebet Barat Dalam VIII No. 20 B
                                                              Mentari Pujantoro and Philipp Godron, Agora Energiewende
Jakarta Selatan 12810 | Indonesia
T: +62 21 2232 3069 | F: +62 21 8317 073
www.iesr.or.id | iesr@iesr.or.id

Agora Energiewende
Anna-Louisa-Karsch-Straße 2
10178 Berlin | Germany
T: +49 30 700 14 35-000 | F: +49 30 700 14 35-129

www.agora-energiewende.org | info@agora-energiewende.de

This report should be cited:
IESR (2019), A Roadmap for Indonesia’s Power Sector: How Renewable Energy Can Power Java-Bali and Sumatra,
Institute for Essential Services Reform (IESR), Jakarta

Publication:
February 2019

  1       i e s r. o r. i d
Foreword

Dear reader,

         Indonesia is the world’s 4th most populous                 Looking ten years ahead, we have assessed

country on a continuous growth trajectory. To supply        different pathways for the Indonesia’s power system:

the increasing electricity demand, the government is        what are the impacts of a moderate electricity demand

emphasizing the role of fossil, and, in particular coal-    growth on investment and power plant utilisation?

fired generation, which is supposed to grow to 65% of       What is the impact of adding considerable shares of

total generation. At the same time, it stipulates that by   wind and solar capacity to system cost, and how will

2025, Renewable energy shall make up 23% of primary         the system ensure security of supply?

energy mix, up from 8% today. Policy focus is on hydro

and geothermal resources, while solar and wind power

play only a negligible role.

         Globally, the trend is very different: power

systems around the world are increasingly being

shaped by renewables. Solar and wind – driven by

significant technology cost reduction - have been at

the forefront of power sector investment for years and

will continue to play the decisive role in modernizing

and decarbonizing power systems globally.

         Against this background, we conducted a

model-based powers system analysis, performed with

the PLEXOS model which is widely used for power

sector analysis. The study focuses on the Java-Bali and

Sumatra systems, which is where the majority of the

population lives and about 90% of the electricity is

produced and consumed. The model assesses both the

demand and supply dimensions of the power system.

                                                                                                 Fabby Tumiwa
                                                                                           Executive Director

                                                                                              i e s r. o r. i d   2
IESR | A Roadmap for Indonesia’s Power Sector:
How Renewable Energy Can Power Java-Bali and Sumatra

 3   i e s r. o r. i d

Executive Summary                                                demand      projections      are     overestimated
                                                                 and as renewables become cheaper. Once
                                                                 renewables are built, they produce electricity
                                                                 at almost zero marginal cost. This could result
        A Roadmap for Indonesia’s power sector: how
                                                                 in additional losses for PLN, which is locked
renewable energy can power Java-Bali and Sumatra
                                                                 into long-term power purchase agreements
summary for policy makers was produced by Monash
                                                                 with Independent Power Producers.
University’s Grid Innovation Hub partnering with
                                                             •   Java-Bali and Sumatra could reliably meet
the Australia Indonesia Centre, supported by Agora
                                                                 growing electricity demand in the next 10
Energiewende and the Institute for Essential Services
                                                                 years through a doubling of the share of
Reform (IESR). The study modelled different pathways
                                                                 renewable energy. The cost of doubling the
for Indonesia’s power system to reliably meet energy
                                                                 share of renewables through investment in
and climate targets for the period 2018 to 2027. The
                                                                 wind and solar is comparable to the current
study focuses on Java-Bali and Sumatra where the
                                                                 high fossil-fuel pathway. Greenhouse gas
majority of the population lives and about 90% of the
                                                                 emissions would be reduced by 36%. The
electricity is consumed. The model assesses both the
                                                                 development of renewables would bring
demand and supply dimensions of the power system.
                                                                 important additional co-benefits, reduce
                                                                 negative health and environmental impacts
        Analysis was performed with the PLEXOS
                                                                 and provide job opportunities throughout the
power system simulation and planning software
                                                                 country.
system, which is widely used internationally for power
                                                             •   A high renewables scenario coupled with
sector analysis. The study identifies the impact of
                                                                 realistic energy savings would result in a
reduced demand on generation investment, utilisation
                                                                 cost saving of US$10 billion over ten years
and power system cost and assesses the impact of
                                                                 as compared with the current RUPTL plan
adding considerable shares of wind and solar capacity
                                                                 if the cost of capital and cost of technology
to the system.
                                                                 is brought down in line with international
                                                                 prices. This would require an ambitious long-
Key Findings
                                                                 term strategic plan, clear intermediate targets
   •    The      Ministry   of   Energy   and   Mineral
                                                                 and implementing regulations in place.
        Resources and utility PLN have continuously
                                                             •   Even with 43% renewables, the security of
        overestimated energy demand in Java-Bali
                                                                 supply of the power system is maintained.
        and Sumatra. If PLN continues with its current
        plans, there is likely to be an overbuild of
                                                          Recommendations
        12.5GW of coal, gas and diesel, resulting
                                                                 To develop a reliable, cost-effective energy
        in approximately US$12.7 billion in wasted
                                                          system which avoids wasted capital and serious
        investment. This would burden PLN’s finances
                                                          environmental impacts, MEMR and PLN should:
        and eventually have to be covered by the
                                                             •   Review     best   practice     approaches         and
        Indonesian public.
                                                                 techniques in demand forecasting around the
   •    The risk of lower than planned utilisation
                                                                 world and implement such an approach in
        of thermal power plants may increase as

                                                                                               i e s r. o r. i d   4
Indonesia;                                         •   Adopt an ambitious long-term strategic plan
      •   Integrate the potential of energy efficiency for       with clear intermediate targets for renewable
          forecasting future electricity demand;                 energy expansion, supporting policies and
      •   Review current proposals for new coal-fired            streamlined implementation at national,
          power stations in the Java-Bali and Sumatra            provincial and local levels.
          systems and apply current prevailing costs for
          renewable technology in developing future
          plans to asses alternative cost-effective and
          low carbon pathways;
      •   Develop and assess alternative scenarios
          and low carbon electricity pathways in
          the National Electricity Plan (RUKN) which
          integrate medium and higher renewable
          energy penetration in various electricity
          systems; and

photo: PLTB Sidrap / Biro Pers Istana

  5        i e s r. o r. i d
Introduction
         Indonesia has seen strong growth in GDP                     Against this background, we conducted
as well as in electricity demand in the past decade.       a model-based analysis of different pathways for
The government is expecting continuous growth,             Indonesia’s power system. We have focused on the
with electricity demand projected to double by 2030        Java-Bali and Sumatra systems, which is where the
(RUKN, 2016). To supply the increasing demand, the         majority of the population lives and about 90% of the
government is emphasizing the role of coal-fired           electricity is consumed. By mid-2020, Sumatra and
power, which is supposed to grow to 65% of total           Java will be connected via a submarine cable, thereby
generation. At the same time, it stipulates by 2025,       integrating the systems of these three large islands.
renewable energy shall make up 23% of generation,                    The model assessed both the demand and
up from 8% today (RUEN, 2017 and RUKN, 2016).              supply dimensions of the power system. It took
         Each year, Perusahaan Listrik Negara (PLN),       into account the opportunities of the impressive
the state-owned electricity utility, publishes an          renewable energy technology cost drop in the past
Electricity General Plan (Rencana Umum Penyediaan          decade, particularly on solar and wind energy,
Tenaga Listrik or RUPTL), which maps in detail the         assessing alternative pathways to current power mix
development of electricity demand and supply for the       planning and meeting Indonesia’s energy and climate
next 10 years. According to the latest RUPTL (2018 –       targets while still ensuring the reliability of the power
2027), the 23% renewables target would be reached          system.
by 2025. Due to lack of a longer-term target, however,               The study used the 2018 RUPTL as a baseline
renewable share would then decrease afterwards.            with regard to existing and future generation builds, as
PLN still puts a clear focus on conventional and fossil-   well as peak demand and energy growth. Analysis was
fueled generation in the power mix, with only very         performed with the Australian PLEXOS model, which
negligible shares of solar and wind.                       is widely used globally for power sector analysis. Input
         Globally, the trend is very different: power      data combined international sources on technology
systems around the world are increasingly being            cost with Indonesia-specific knowhow provided by a
shaped by renewables. In an effort to modernise            range of national experts in workshops and bilateral
power systems, taking advantage of the dramatic            discussions. The power system was modeled for a
drop in prices of solar PV and wind, and looking           10 year time-span, for the period 2018 to 2027, with
for a more sustainable power mix, countries and            hourly time steps. It takes into account supply and
energy companies are strongly investing in these           demand on a provincial level as well as inter-provincial
technologies. Since 2015, more investment has gone         transmission capacity restrictions.
into renewable energy around the world each year than                The two main objectives of the study relate to
in conventional fossil fuel generation. India, in 2017,    demand development and wind and solar investment
for the first time, invested more in renewables than       in Java, Bali and Sumatra. We:
fossil fuel generation (IEA, World Energy Investment       a.   identify the impact of reduced demand on
2018) – simply because electricity from wind and solar          investment, utilisation and power system cost
has become cheaper than from new gas and coal fired             and;
power plants. In addition, renewable energy has the        b.   assess the impact of adding considerable shares
co-benefits of reductions in carbon emissions and air           of wind and solar capacity to the system.
pollution.                                                           The setup and key differentiating parameters
                                                           of the scenarios assessed are presented in Figure 1.

                                                                                                 i e s r. o r. i d   6
Figure 1 Scenarios and key drivers

The study’s main findings are presented below.

Overestimating Demand Growth and                                 Even though growth rates have been reduced recently,
Underestimating The Potential of Energy                          notably in the 2018 RUPTL (as compared to RUPTL 2017),
Efficiency Increase The Risk of Stranded                         the growth path for Java-Bali and Sumatra system for
Assets                                                           the next decade still projects demand values that are 20-
         Estimating the energy demand trajectory over            50% higher than those to be expected when following
longer periods of time is very challenging, in particular        the growth trajectory of the past decade. Therefore,
in emerging economies that have become used to high              in the analysis, we have modeled an alternative
growth figures. Governmental projections are often               growth path more reflective of the pathway of the last
driven by political targets more than by sound evidence,         decade. This is particularly true for Java-Bali, where
and the potential of more efficient appliances in the            demand is already at a higher level, while for Sumatra,
industrial sector and building stock (AC, light bulbs, etc.)     a level of growth somewhere between historical trends
is often underestimated.                                         and RUPTL 2018 projections is assumed (Figure 2).
         Indonesia is no exception: in its annual Ten-Year
Plans, PLN has consistently overestimated electricity
demand growth. Typically, demand has been expected
to more than double in a 10-year horizon. According to
the RUPTL 2008, Java-Bali electricity demand today was
expected to have reached 250 TWh by 2017. In reality, it
stood at 170 TWh, i.e. about two thirds of the projection.

  7      i e s r. o r. i d
Figure 2 Historical demand and demand projection in Java Bali and Sumatra: a tendency to overestimate the future
                                                    demand growth

              Comparing demand of the RUPTL baseline                          Reduced demand results in a reduction of additional
    case with the moderate demand growth scenario                             generation capacity requirements by approximately
    reveals the magnitude of difference and impact on                         12.5 GW, mainly of coal, CCGT and OCGT (about 3 GW
    the existing and planned power generation fleet. In a                     each), and diesel (-1.6 GW). In essence, there would
    scenario where the growth in Java-Bali and Sumatra                        be 12.5 GW of capacity built that is not required to
    reflects the growth of the past decade, electricity                       meet demand. In the capacity assessment, outages
    demand in 2027 would be 16% lower than what is                            for maintenance as well as forced outages have been
    assumed in the 2018 RUPTL. This means from 197                            taken into account, according to current standards in
    TWh in 2017, demand would increase to 322 TWh in                          Indonesia.
    the moderate scenario, rather than to 382 TWh.                                       Building these extra 12.5 GW of plants would
              The moderate demand growth will imply:                          require unnecessary investment of about 12.7 billion
    a.   There will be considerably fewer power plants                        USD; total investment cost would increase from 39.7
         needed to meet the demand and;                                       billion USD to 52.4 USD. This would, by the year 2027,
    b.   b) if, nevertheless, all the power plants in                         increase annual capital cost of the power plant fleet
         the RUPTL 2018-2027 were built, power plants                         by 28%.
         would run at lower utilisation rates, putting
         their business case in question and, effectively,
         increasing overall system and levelised generation
         cost.

1
     Demand would be lower by 49 TWh in Java Bali and 11 TWh in Sumatra, translating to 64.4 TWh less generation
     needed, if power system losses of about 8% are taken into account
2    Combined Cycle Gas Turbine
3    Open Cycle Gas Turbine

                                                                                                                   i e s r. o r. i d   8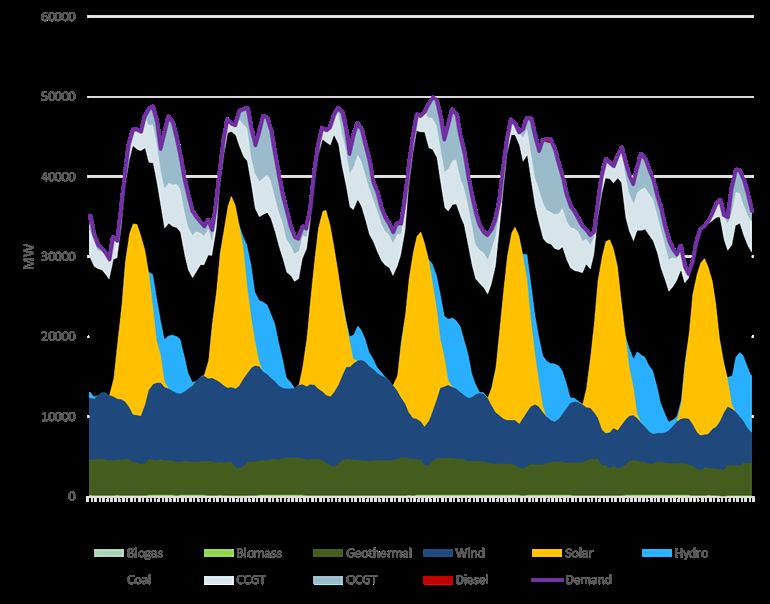
Figure 3 Installed capacity in 2027 between RUPTL and the optimised system

                             Figure 4 Difference in investment cost due to overbuilt of 12.5 GW capacity

         If all power plants are built according to RUPTL             existing and new coal power generation drops by more
2018 plan, but demand growth turns out to be more                     than 10 percentage points, and some where utilisation
moderate, utilisation of thermal power plants will drop,              will reduce by about 20 percentage points. For gas,
since a higher number of power plants will generate the               given the CCGTs and OCGTs higher short run marginal
same amount of energy. As renewables power plants                     cost, utilisation would even drop further. It is still
– e.g. geothermal, hydro, solar and wind - generate at                probable that the new built plants would be utilised to
zero marginal cost, this will mainly affect thermal power             a much lesser extent than planned, thus increasing the
plants, meaning coal utilisation will, within the next 10             risk of stranded assets. Given that thermal power plants
years, decrease by an average rate of 8%. The impact                  are increasingly being built by Independent Power
becomes even more pronounced when looking at the                      Producers with long-term power purchase agreements
change in utilisation on a more disaggregate basis.                   with PLN, this means that PLN will likely be paying for
         Figure 5 depicts the change in utilisation rates             electricity it does not need, thereby burdening the
of coal power plants for the different demand scenarios.              Indonesian taxpayer with additional debt.
Each circle represents one province: it is evident that
there are several provinces where utilisation of both

  9      i e s r. o r. i d
Figure 5 Changes in utilisation rate between high demand (RUPTL) and lower demand scenario (RUPTL Low gen). Each
point represents 1 coal power plant in 1 province. The power plants are grouped into 3 status: existing, under con-
struction, and planned
As mentioned before, forecasting demand is can be developed economically in a very modular way,
not an easy business, and the risk of over-investment adapting project size to the needs. Efficient thermal
needs to be weighed against the political goal of power plants, in contrast, have sizes between 400 MW
supplying citizens and the economy with sufficient (for gas) and more than 1 GW (for coal), and require
energy. However, recent developments of strongly much longer lead times. The risk of unnecessary
increasing reserve margins and delays in projects due investment is therefore much lower with renewables
to lack of demand demonstrate that overinvestment is power plants.
a real issue for Indonesia already today.
The risk of lower utilisation of power plants
than originally planned may increase with renewables
becoming cheaper, as these technologies, once they
have been built, produce electricity at almost zero
marginal cost. At the same time, wind and solar plants
can be developed in a much more flexible way. In well-
developed renewables markets, time from planning, to
start of operation, ranges between two years (for wind
parks) and six months (for solar PV) and these projects
i e s r. o r. i d 10Indonesia Has a Vast Potential of Diverse estimated at ~6 GW for Sumatra and 24 GW for Java-
Renewable Energy Sources, Bali.
Which Easily Allows for Doubling Based on the potential above, we have
The Currently Planned Share of calculated three different power mix scenarios, which
Renewables within The Next Decade mainly differ in their share of wind and solar power.
As a baseline scenario, we use the RUPTL_Low cap. It
Indonesia has abundant renewable energy reflects the technological preferences expressed in the
potential from a variety of resources - well beyond RUPTL, i.e. some investment in geothermal and hydro,
what is available in most other countries around the but major focus on coal (+ 11 GW in 10 years), as well
globe. Being located on the so-called “ring of fire” on as gas (+ 7 GW), assuming, however, moderate demand
the Pacific tectonic plate, Indonesia is one of the most growth. We compare this baseline with two scenarios
attractive countries for geothermal development. Since that are based on the same demand assumptions, but
2018, Indonesia has the second highest geothermal different generation mix:
capacity (almost 2 GW) in the world, only trailing • RE_Medium assumes a mix of investment in
the United States; resource potential is estimated to fossils and renewables, while;
be at 11 GW, reserves at another 17 GW. Technical • RE_High looks at an investment pathway
hydropower potential, according to the International mainly focusing on renewables, with no new
Hydropower Association, is about 75 GW, with 8 GW investment in coal and CCGT beyond that
economically feasible already today – on top of the already under construction.
existing 4 GW. While many large dam projects raise Figure 6 depicts the installed capacity and
environmental and social questions, there is also generation mix of each scenario. While in the baseline
remarkable potential for (individually) much smaller scenario, renewables – mainly hydro and geothermal
projects. – make up nearly 19% of annual generation, in the
In terms of solar and wind power, Indonesia alternative scenarios, renewables shares increase to
is only at the very beginning of tapping its huge 31% (RE_Medium) and 43% (RE_High). By 2027, the
potential. Solar irradiation is at attractive levels all installed capacities of solar and wind in the RE Medium
across Indonesia, due to the high number of daylight scenario are 19 GW and 8 GW respectively. In the high
hours and rather low cloud cover throughout the year. renewables scenario, there will be in total 35 GW of
Limitations, in particular in densely populated Java, solar and 19 GW of wind installed across Java Bali and
are rather driven by land availability. Nevertheless, out Sumatra. This would mean less than 30% of currently
of estimated ~200GW of potential across the country, estimated solar and wind potential is exploited.
~30 GW are estimated for Java Bali, and more than 90 In the high renewables scenario, annual
GW for Sumatra. Due to relatively low wind speeds capacity additions would be 3.5 GW of solar and 1.9
in many regions, as well as land restrictions, wind GW of onshore wind. As comparison, in India, the
potential has for a long time been underestimated. country has installed 55 GW of solar and wind in the
Recent meso-scale modelling as well as technological last 10 years.
progress which allows wind turbines to harvest lower
wind speeds reveals there is actually more potential
and suitable locations than previously thought.
According to these assessments, wind potential is
11 i e s r. o r. i dFigure 6 Installed capacity and generation per technology in each scenario. Renewables percentage in bracket.
To reach India’s renewable energy target of 160 GW While Indonesia’s NDC still allows for an
of wind and solar in 2022, annual capacity additions overall significant increase in the power sector’s
are 20-30 GW per year for solar PV and 6 – 10 GW per emission to 2030, the RE High scenario would result
year for wind. In Germany, annual capacity additions in a decrease in the power sector’s emission, thereby
are 2.9 GW per year for onshore wind and 2.5 GW contributing to greater greenhouse gas reductions.
per year for solar PV, but this is after the country Mitigation from the power sector is a low hanging fruit
has developed 105 GW of solar and wind in the past that should be explored in reducing CO2 emission.
decade. Therefore, the high renewables scenario is
feasible to achieve, provided the right policies are in
place.
Due to higher non-thermal output in the
renewables scenario as compared to the RUPTL
planning, emissions go down from 0.76 to 0.64 ton/
MWh in RE Medium and to 0.49 ton/MWh in RE High
scenario, dropping by 16% and 36% respectively.
Figure 7 Emission intensity of power sector in each scenario
i e s r. o r. i d 12A High Renewables Scenario We see that using a consistent set of
Coupled with Realistic Energy Savings Could assumptions the simulations show that the RUPTL_Low
Result in a Cost Saving of US$10 cap baseline scenario comes at lowest overall cost of
Billion Over Ten Years 135.4 billion USD over the ten-year period. The system
Fulfilling the growing electricity demand means with 31% renewables (RE Medium) has 4% higher
deploying significant amount of investment. Therefore, system cost compared to the RUPTL_Low cap; while
it is paramount for the country to consider the future the High Renewables scenario, with ~43% renewable,
trend on the cost, thus reaching the political target (be increases the system cost by 7%. However, the overall
it electrification ratio, RE shares, CO2 emission, or even system cost of the High Renewables scenario is $7.7
welfare) in the most economical way. The financial billion less than the current RUPTL plan, taking into
impacts of the transition to a larger penetration of account efficiency savings and lower demand.
renewables in the Java-Bali-Sumatra system are Wind and solar technology cost drops have
investigated by reporting the total operating and repeatedly been faster than anticipated. The impact of
annualised investment costs for the period 2018- lower technology cost and a lower risk perception of
2027. Figure 8 shows the total system cost for the investors is shown in the Energy Transition scenario.
five scenarios – RUPTL, RUPTL_Low cap as baseline, Assuming that cost of capital could be reduced from
Medium and High Renewables and Energy 10% to 8%, in line with global trends, and a steeper
Transition scenarios. learning curve for solar and wind, the total CAPEX for
the Energy Transition scenario would be reduced by
20% and the system cost could be down by 10 billion
USD, at the same level of the RUPTL baseline scenario.
And keep in mind: none of the scenarios takes into
account externalities such as cost for environmental
impact, CO2 emissions, health, or social effects.
Figure 8 Total operating and investment cost for Java-Bali-Sumatra 2018-2027
13 i e s r. o r. i dConducive Investment Environment is Key In a sensitivity analysis, we singled out the
to Enabling Higher Renewable impact of different levels of cost of capital for funding
Penetration and Reducing Overall Costs solar and wind projects in Java-Bali and Sumatra
Systems with higher shares of renewables system. The result shows that at a weighted average
have very different cost structures from those with cost of capital (WACC) of 7.5% for wind and solar, the
high shares of fossil generation. Producing power High Renewables system is at the same cost, even
from renewables requires high upfront investment, slightly lower, compared to the baseline scenario.
but subsequently allows power production for 25
years and more at operating cost of close to zero.
While technology cost tends to standardise across
competitive global markets, interest paid on both debt
and equity is very different from country to country,
and has a strong impact on total cost, as mentioned
above.
Figure 9 Sensitivity Analysis on Different WACC for Wind and Solar PV (Column in green:
assumption used in the model)
i e s r. o r. i d 14While this may seem very ambitious in the coal capacity. By 2027, even in the High RE scenarios,
Indonesian context today, countries where wind there are 22 GW of coal fired power plants in the
and solar markets are well developed, such as Chile, Java Bali and Sumatra system, producing 40% of
Mexico, Dubai, India, or Germany show that WACC all generation. Based only on coal price increase,
can be as low as 5% or even less. The regulatory the coal price would need to reach record levels for
environment in Indonesia will thus be key to enabling the High Renewable scenario to be on par with the
higher renewables penetration, as the cost of capital baseline scenario. While this may be realistic under
is largely driven by the risk perceived by the investors. the current development in world market coal price,
In addition to assessing impact of improved the Domestic Market Obligation policy caps the coal
investment condition for renewables in Indonesia, the price at 70 USD/ton. However, should the country, in
model also calculated the impact of coal prices, as the line with the announced “clean coal” policy, increase
power system is quite dominated by coal-fired power environmental standards, by using coal with higher
plants. calorific value for its power plants or by imposing
Figure 10 depicts the change in total system other pollution-reduction measures, generation cost
cost under different coal price assumptions. The result by coal plants, which today is very low in international
of our analysis indicates that all scenarios are sensitive comparison, would increase, shifting the balance to
to changing coal prices but not as strongly as one may renewables-based systems.
expect. This is due to the fact the in all scenarios, due
to the large existing coal fleet, there is considerable
Figure 10 Fuel Cost Sensitivity of each Scenario.
4
In this model, the assumption for coal calorific value is 4200 kcal/kg.
15 i e s r. o r. i dEven with High Shares of Wind and Solar, tern aligns with the Solar PV feed-in. In some hours,
Security of Supply of especially around midday, solar and wind generation
The Indonesian Power System can make up 60% of total demand; in this case around
Can be Guaranteed 30 GW. In the days with low wind and solar generation,
Increasing the share of wind and solar PV the hydro power generation increases and provides
leads to a fundamental transformation of the power the bulk of balancing, but also coal, CCGT and in par-
system. Increasing variable RES output is often associ- ticular very flexible OCGT plants contribute to power
ated with the need for enhanced power system flexi- system flexibility.
bility and affects the role played and the contribution Residual power plants, e.g. hydro, gas, and
made by the remainder of power generation portfolio. coal power plants have to respond rapidly to an in-
In the High RE scenario, almost one quarter crease or decrease of solar and wind generation, in es-
of the average annual generation comes from wind sence: operate more flexibly. The flexibility challenge
and solar. Still, at such shares of variable renewables, is manageable from a technical perspective, yet it is
the system can provide sufficient energy at every hour important to note that flexible operation will impact
of the year. To illustrate this, hourly generation pro- power plant economics and may change cost efficien-
files during two sample weeks with changing wind and cies between gas and coal technologies.
solar contributions are shown in Figure 11. One can
observe that during the day time, the peak load pat-
5
We use a conservative assumption that coal can ramp up and down 2 MW/min, CCGT 10 MW/min, and OCGT 20 MW/min
i e s r. o r. i d 16Figure 11 Hourly generation in a week with high solar and wind (October 2027) and low solar and wind
(January 2027)
photo: PLTS Kupang / jabartoday.com
17 i e s r. o r. i dConclusion and Outlook
By the end of 2017, there was roughly 6 GW There are, however, a number of certainties
of renewable energy capacity installed in Java Bali and that should be taken into account by Indonesian
Sumatra, (mainly hydro and geothermal), providing 8% policymakers when framing their future energy
of overall generation in Java-Bali and Sumatra (RUPTL, system: reducing reliance on fossil will not only reduce
2018). According to the National Energy Plan (2017), the risk of being impacted by global fuel prices on
the share of renewable generation should increase to coal and gas, but also come with great environmental,
23% by 2025 and the renewable capacity should be social and health benefits and allow Indonesia to meet
33% of the total installed capacity in 2025. its climate change mitigation commitments under the
Following this course, it means in Paris Agreement. Incentivizing investment in wind
6 years the country needs to install over and solar across the archipelago, on top of that, has
30 GW of renewables out of 106 GW of total installed the potential for directing money flows and economic
capacity. However, the 2018-2027 RUPTL, being the benefits to regions that are currently less developed.
major reference in power sector development, only Policy and regulation will be key for enabling
plans 14.3 GW of renewables plants, mainly hydro and higher renewables penetration in Indonesia. In order to
geothermal. Reaching the target and following the attract investors, ensure competition and bring down
growth trajectory will require stronger efforts, more cost of capital, it is paramount to have an ambitious
than what is currently planned in RUPTL 2018-2027. long-term strategic plan with clear intermediate
Solar and wind, so far almost ignored, provide an targets, e.g. an annual renewable investment pathway,
attractive potential to reach the target. supporting policies and streamlined implementation
The simulations demonstrated that a at national, provincial and local level.
renewable pathway, taking into account a higher share
of solar and wind power, is economically feasible
and does not put security of supply at stake. While
adding 19 GW of wind and 35 GW of solar capacity
in one decade will require a considerable amount of
investment, a 40% renewable system can be developed
at similar cost levels as a system planned under the
RUPTL, today focusing very much on coal. In the end it
is hard to predict whether a renewables pathway or a
fossil pathway will come with slightly higher costs, as
many uncertainties prevail in a 10 year horizon – be
they world market prices for coal, further cost drops
for wind and solar, or the cost of borrowing money in
dynamic global financial markets.
i e s r. o r. i d 18Institute for Essential Services Reform
Jalan Tebet Barat Dalam VIII No. 20 B
Jakarta Selatan 12810 | Indonesia
T: +62 21 2232 3069 | F: +62 21 8317 073
www.iesr.or.id | iesr@iesr.or.id
@IESR @iesr.idYou can also read