Influence of meteorological conditions on noise dispersion in the Port of Thessaloniki - De Gruyter
←
→
Page content transcription
If your browser does not render page correctly, please read the page content below
Noise Mapp. 2020; 7:135–145

Research Article

Stjepan Piličić, Igor Kegalj, Eirini Tserga, Teodora Milošević, Roberto Žigulić, Ante Skoblar, and
Luka Traven*

Influence of meteorological conditions on noise
dispersion in the Port of Thessaloniki
https://doi.org/10.1515/noise-2020-0012
Received Mar 17, 2020; accepted Jul 03, 2020
                                                                     1 Introduction
Abstract: Although noise dispersion models are widely Noise dispersion models (noise maps) are an extremely
used for the assessment of noise levels across different do- useful tool for assessing environmental noise levels in vari-
mains, the influence of meteorological conditions on en- ous areas, regardless of their purpose and size. Noise map-
vironmental noise is usually neglected even though mod- ping is defined, according to [1], as a “presentation of data
elling requirements often list meteorological data as a key on an existing or predicted noise situation in terms of a
part for conducting successful modelling exercises. In or- noise indicator. . . ” The key part of the definition is that it
der to evaluate the magnitude of influence of meteorolog- can be used both for the assessment of the current levels
ical conditions on noise dispersion, different meteorolog- and the prediction of noise levels in different situations,
ical scenarios have been tested. The meteorological pa- such as “the worst-case scenarios” or any other change
rameters that have been addressed include wind speed from the current situation.
and direction, air temperature and atmospheric pressure.              Use of the noise maps created with a noise modelling
The simulations have been performed using data obtained software, like the ones used in this article, can be dated
from the Port of Thessaloniki, which include standard back to the late 1990s and early 2000s, with the works such
noise data (locations of noise sources and barriers, noise as [2] and [3]. However, noise mapping can be traced back
power levels of individual sources), as well as yearly av- several decades earlier. Among others, noise maps based
erages and extremes for the meteorological parameters. on the noise measurements were created for several towns
Wind speed and direction have been shown to have a ma- in Czechoslovakia and German Democratic Republic, as
jor influence on environmental noise levels. The modelled shown in [4]. While that method can be useful for the as-
difference in levels due to changes in wind speed and di- sessment of current noise levels, like in [5] and [6], it is not
rection reached 7 dB in several receivers indicating an ef- suitable for the prediction of noise levels for different sce-
fect that should not be neglected. Air temperature and at- narios, as well as the estimation of the influence that indi-
mospheric pressure had very little influence on noise lev- vidual noise pollutants have on total noise levels.
els. In conclusion, when addressing and modelling envi-               There were several studies conducted with the main
ronmental noise levels, wind speed and direction must be goal of creation of noise dispersion maps in order to es-
properly accounted for and should not be neglected.               timate the influence that the ports have on their environ-
                                                                  ment (i.e. only sources in the ports were taken into ac-
Keywords: meteorological conditions, noise modelling,
                                                                  count). Those studies were done using a noise mapping
noise mapping, maritime sector
                                                                  software, instead of using on-site measurements to make
                                                                  the noise map.
                                                                      Among the most important projects for the establish-
                                                                  ment of noise mapping conventions was the NoMEPorts
                                                                  project, where an example for future use was set [7]. One
*Corresponding Author: Luka Traven: Department of Environ-
mental Medicine, University of Rijeka, Faculty of Medicine, Braće
                                                                  of the ports participating in the project was the Port of
Branchetta 20/1, 51000 Rijeka, Croatia;                           Livorno, where the main subject was the influence of the
Email: luka.traven@medri.uniri.hr; Tel.: +38551358740
Stjepan Piličić, Igor Kegalj, Teodora Milošević: Department of
Environmental Medicine, University of Rijeka, Faculty of Medicine,
Braće Branchetta 20/1, 51000 Rijeka, Croatia                         Roberto Žigulić, Ante Skoblar: Department of Engineering Me-
Eirini Tserga: Societe Anonyme "Thessaloniki Port Authority", Pier   chanics, University of Rijeka, Faculty of Engineering, Vukovarska 58,
1, 54625 Thessaloniki, Greece                                        51000 Rijeka, Croatia

  Open Access. © 2020 S. Piličić et al., published by De Gruyter.          This work is licensed under the Creative Commons Attribution 4.0
License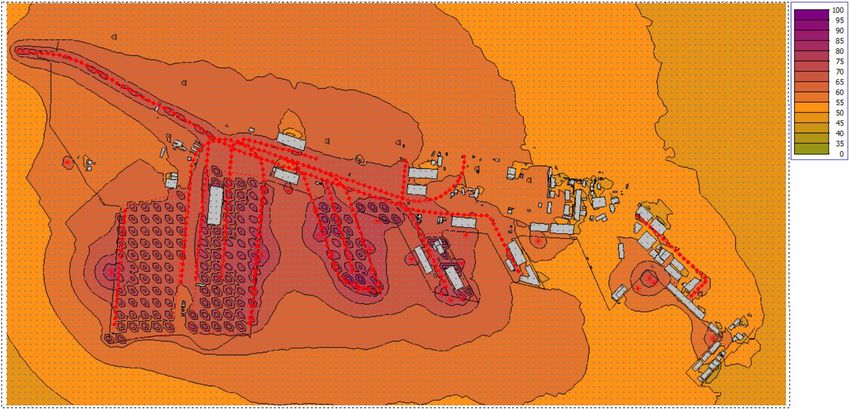
136 | S. Piličić et al.

port noise emissions on the total noise levels in the city [8].     On the following pages, the methodology for the cre-
A very similar paper was written as a part of the MESP ation of the noise maps is presented, as well as the results
project, with the participating ports being the Port of Pa- obtained using the procedure. The results were also dis-
tras (Greece) and the Port of Tripoli (Lebanon) [9].            cussed at the very end of the article and the relevant con-
     An example of the creation of the noise map for a clusions were made.
larger area is the one presented in [10]. The emphasis was
on the city area as a whole (Piraeus, Greece), instead of the
city port area only. However, the port was seen as a major
noise pollutant (in addition to roads, railways and the in-
                                                                2 Methodology
dustrial zone) and a separate map was created for it. The
maps were used only for the assessment of the current sit- 2.1 Data requirements
uation and for an estimation of the situation after the im-
plementation of certain noise reduction measures. Meteo- The first step in noise modelling is to obtain all the rele-
rological conditions were not considered.                       vant data. The data required is very similar to the data pre-
     Noise maps can also be used for an estimation of the sented in [7], where the general guidelines were given and
noise propagation of a single source. An example of such noise maps were created for several European ports par-
maps was presented in [11], where the main topic was the ticipating in the NoMEPorts project, and consists of geo-
noise propagation of a single ship in the Port of Genoa. graphical data and data about noise sources. Geographi-
Such maps are especially useful when assessing the influ- cal data consists of information about buildings and other
ence that complex noise sources, such as ships, have on noise barriers (locations and height information), terrain
their environment. Although the subject of the papers was heights and the surface characteristics of the ground. Lo-
not the creation of noise maps, the discussion and guide- cation of noise sources can be sorted in both geographical
lines for the modelling of ship noise are presented in works data and data on noise sources.
such as [12], dealing with the noise prediction of moored           The noise sources data should contain, besides the
ships, and [13], in which the main subject was the assess-      location  of the sources, noise emissions (for industrial
ment of ship influence on noise dispersion, including both      sources),  number of vehicles and their speed (road and
moored and moving vessels.                                      railway traffic), as well as “working hours” of each source,
     Although the listed examples do not represent the en- regardless of its type. All the relevant data was either
tire field of noise assessment studies, they are neverthe- provided directly by the port or taken from its yearly re-
less representative of the current state of the subject. Study port [15]. Emissions of traffic noise sources are calculated
of meteorological influences is completely neglected in from the available traffic data, while other sources (ships,
each one of them. Despite meteorological conditions being cranes, area sources representing port operations) are de-
listed among the requirements in [7], they are still a subject fined with sound power levels in single octave bands.
for further research.                                               Locations of buildings, receivers and noise sources
     In this paper, the main aim is to assess the influence of can be seen in Figure 1. The sources are represented with
different meteorological parameters, such as wind speed red lines and symbols similar to “*”, while the buildings
and direction, air temperature and atmospheric pressure. and other structures, such as tanks, are represented with
Depending on those meteorological factors, noise level grey areas. The black line represents the border between
assessment will be made for several different scenarios. the port and the sea and does not have any influence on
Based on the methodology and simulations described for the calculation. The receivers are marked with black sym-
the port of Thessaloniki, which is a part of the PIXEL (Port bols and are also numbered, as their numbering is used
IoT for Environmental Leverage) project, the results shown in the latter part of the paper. As there are different noise
below are obtained. The project focuses on the ecologi- sources, a distinction should be made between them. Point
cal aspects of port operations, including the use of re- sources located on the black lines represent the immobile
sources and sustainable development, and noise pollution cranes and those located slightly outside them represent
is among the aspects it is directly concerned with. Aside ships. Ships were represented as point sources in the port’s
from the PIXEL project, other projects have also accentu- yearly report, but also in papers such as [13]. The single
ated the importance of noise reduction in port areas, such “line source” represents a moving crane. Area sources rep-
as REPORT-Rumore E PORTi, with its multidisciplinary ap- resent the areas where port operations, such as cargo han-
proach to the problem [14].                                     dling, are performed.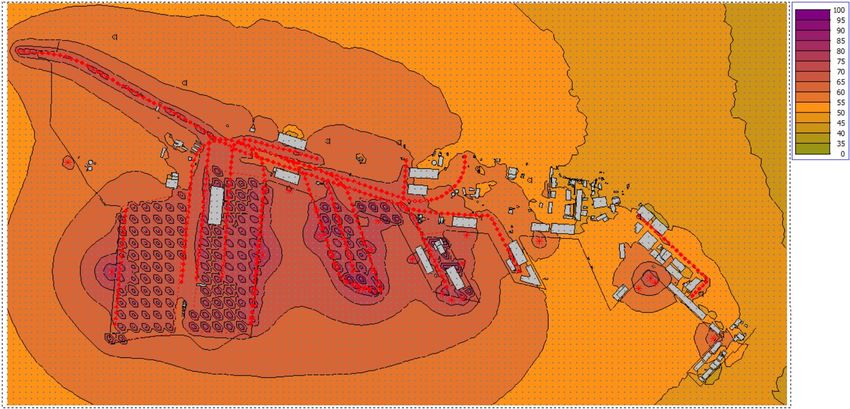
Influence of meteorological conditions on noise dispersion in the Port of Thessaloniki | 137

Figure 1: Locations of noise barriers (buildings and tanks) and noise sources in the Port of Thessaloniki [16]

     In addition to the two data types described, there is a             and all of them. The most convenient way would be to use
third set of data requirements that could be added – me-                 one of the methods that support the modelling of all the
teorological data. Despite sometimes being listed as a re-               noise sources at once. However, two of such methods (Har-
quired data, as in [7], it is clear from the works mentioned             monoise and CNOSSOS-EU standards) have their limita-
in the introduction that it is almost always excluded. As                tions. The former is still in an experimental phase and not
the main goal of this article is to assess noise levels for              yet ready for scientific use, while the latter doesn’t support
several scenarios, based on different meteorological con-                the calculation with different wind speeds and directions.
ditions, it is clear that meteorological data is, in this case,               The different approach had to be used and road and
as essential as the geographical data and the data about                 railway traffic noise sources were calculated using sep-
noise sources.                                                           arate methods and their emission levels were imported
                                                                         into a method used for the general (industrial) noise cal-
                                                                         culation. Six methods were tested for railway noise mod-
2.2 Calculation methods                                                  elling (the two previously mentioned plus NMPB-2008
                                                                         (rail), XPS-Rail, RMR-1996 and RMR-2012 methods). The re-
One of the main issues during the creation of a noise map                sults were compared to the ones achieved by the simula-
is the choice of a calculation method. It mostly depends                 tion presented in the port’s yearly report [15] and the clos-
on two factors – software used for the simulation and the                est results were obtained using the CNOSSOS-EU method.
modelling requirements. The noise dispersion modelling                   The method uses the following calculation formula for rail-
was done using Predictor-LimA Software Suite, developed                  way noise [17]:
by Brüel & Kjær, specifically the version Predictor (v12.00,
64-bit). The software allows the calculation using 20 dif-                         L W ′ ,eq,line,i (ψ, φ) = L W ,0,dir,i (ψ, φ)
                                                                                                                        (︂          )︂
ferent calculation methods, differing in their purpose and                                                                    Q
                                                                                                           + 10 · log                  ,
calculating options.                                                                                                       1000 · v
     In order to make possible the assessment of the influ-
                                                                         where:
ence of different meteorological conditions on the noise
                                                                         Q – the average number of vehicles per hour on the j-th
level distribution, a calculation method that has those op-
                                                                         track section per vehicle type, average train speed and run-
tions had to be used. In the Predictor-LimA software, meth-
                                                                         ning condition (vehicles/hour)
ods are divided by their modelling purpose in four cate-
                                                                         v – the speed of those vehicles (km/h)
gories – road traffic noise, rail traffic noise, industrial noise
                                                                         Lw,0,dir,i – directional sound power level of the specific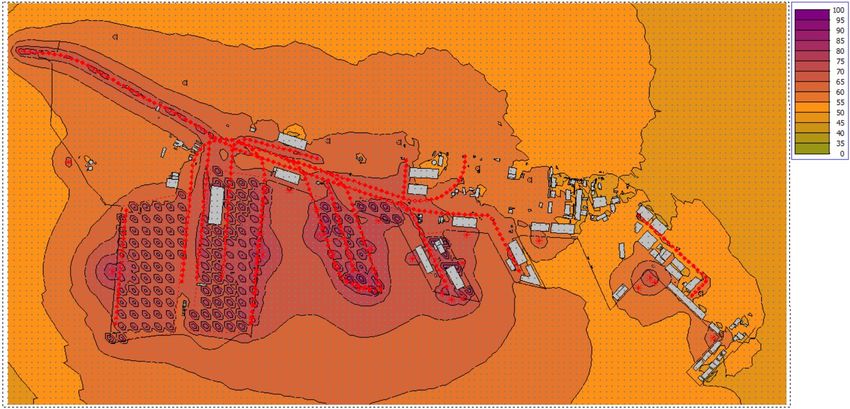
138 | S. Piličić et al.
noise (rolling, impact, squeal, braking, traction, aerody- has an elevation in the range of 1 m, according to the data
namic, other effects) of a single vehicle in the directions provided by the port). Having in mind the small difference
ψ and φ (dB(A)/m) between the results and the significant slowdown of the
Indicator LDEN is calculated with the following expres- simulation caused by it, it was decided to omit them.
sion [18]:
[︂ L day L evening +5
12 4
L DEN = 10 · log · 10 10 + · 10 10 2.4 Meteorological conditions
24 24
L night +10
]︂
8 The last issue to address is the choice of meteorological
+ · 10 10 ,
24 conditions for which the simulation would be done. It was
where: decided to choose the situation with no wind at all, the
Lday – A-weighted noise level during the day (dB (A)) most probable situation and the worst possible situations
Levening – A-weighted noise level during the evening (dB for the eight main directions. Also, the influence of at-
(A)) mospheric pressure, air temperature and humidity were
Lnight – A-weighted noise level during the night (dB (A)) tested for the situation without wind and one of the worst-
Similarly, different methods were tested for road traf- case scenarios (to see if the influence is different when
fic noise (Harmonoise, CNOSSOS-EU, ISO 9613.1/2 Road, there is wind and when there is no wind).
CRTN, CRTN (NZ), CRTN (TRL), HJ2.4-2009, NMPB-2008 The average wind speed throughout the year is 4 m/s,
(road), TNM and XPS – road) and the closest results to with the most common direction (in degrees) being 292∘
the port’s report were obtained using ISO 9613.1/2 Road [20]. According to [21], the highest wind speed for the pe-
method. Likewise, ISO 9613.1/2 method was chosen for the riod from November 2018 until October 2019 was 19.2 m/s.
creation of the final model. The main reasons were its foun- That wind speed was used for all eight main directions and
dation on the ISO-9613-1/2 and the ISO 17534-3 quality re- represents the worst-case scenario since it would lead to
quirements, as well as the support of calculation with dif- extreme values in the receivers.
ferent wind directions and speeds. The ISO method calcu-
lated the results using the following formula [19]:
L lt,per = L dw − C m.per − C t,per 3 Results
where: As stated in the previous section, there are four meteoro-
Ldw – Equivalent continuous downwind octave SPL (dB) logical parameters considered for the noise modelling sim-
Cm,per – Meteorological correction during the evaluation ulations. As most of the paper deals with wind modelling,
period (dB) and as the parameter that was proven to have the most sig-
Ct,per – Correction for the active time of the source during nificant influence on final results, it will be described first.
the evaluation period (dB) Rest of the conditions for the following simulations are de-
scribed below (all values are year averages for the period
1985-2015, according to [22]):
2.3 Assumptions and simplifications
– Air temperature: 16∘ C
– Humidity: 67%
Once all the data is obtained and the calculation method
– Atmospheric pressure: 101.7 kPa
is chosen, the simulation can be started. However, signif-
icant slowdown (about four times) of the simulation was Stability class was chosen as D (neutral class), based
noticed when using the height points (“H.P.”). In order to on the wind speeds [23]. In all cases, wind speeds and sta-
speed up the simulations, the results were compared for bility classes were the same for different periods of the day.
the simulation with and without height points. They can The results can be seen in Table 2 (LDEN ) and Table 3
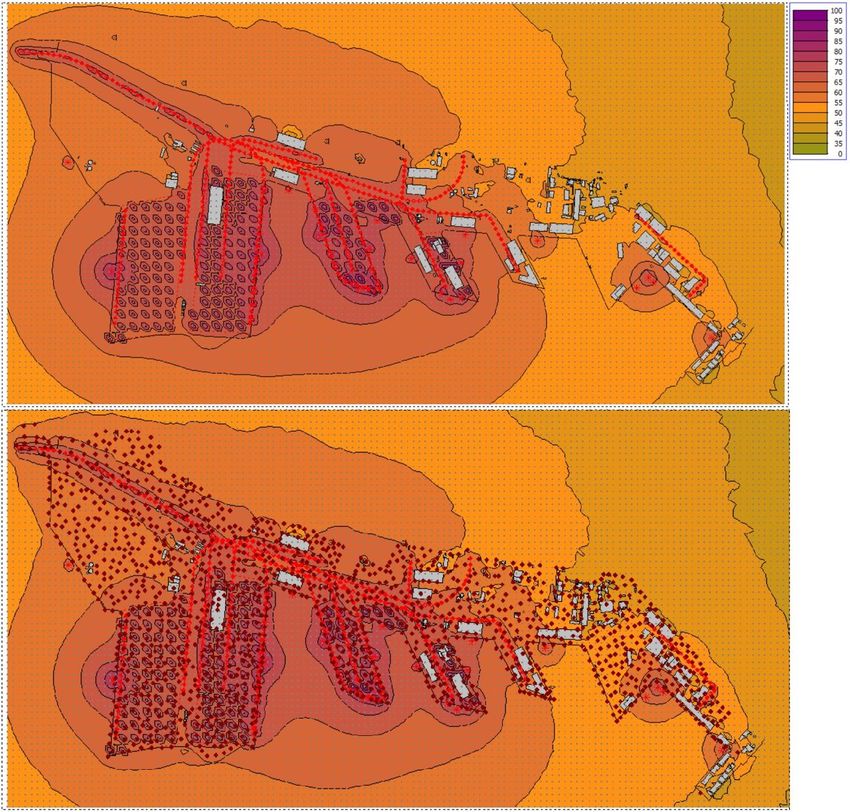
be seen in Table 1 and Figure 2 (the height points are rep- (Lnight ). From Figure 1, it is clear that the first three re-
resented by red dots). ceivers are located in a place relatively well-surrounded by
It can be seen from Table 1 that the use of height points buildings, hence the lower influence of the wind, as shown
does not affect the final results by much. Similar observa- in Table 2. The differences are higher for Lnight values, due
tions were made in [16], also done as part of the PIXEL to the smaller number of active noise sources during the
project. The reason for it is the small difference in eleva- period. The only nearby noise sources active near them
tion between different parts of the port (most of the port during the period are ships moored to the south, hence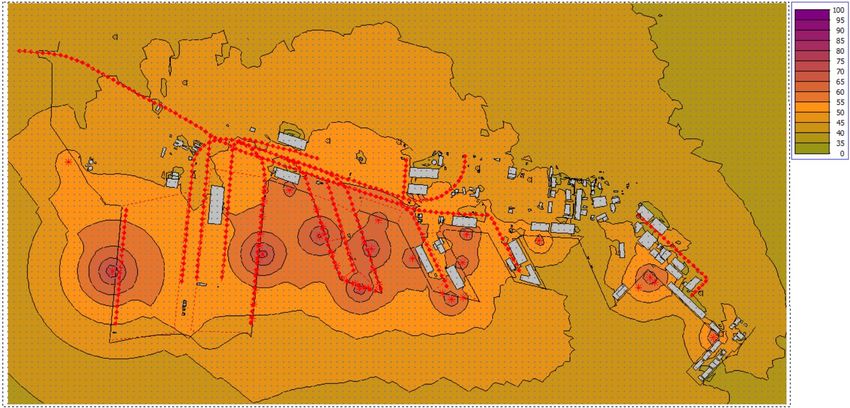
Influence of meteorological conditions on noise dispersion in the Port of Thessaloniki | 139

Figure 2: Comparison of results without (above) and with (below) height points

Table 1: Comparison of the simulated noise levels with and without height points

 Receiver                             Lnight (dB(A))                                            LDEN (dB(A))
                   With HP             Without HP            Difference            With HP       Without HP           Difference
     1              53.1                  53.1                    0                 59.5            59.5                   0
     2              42.3                  42.3                    0                 55.6            55.7                  0.1
     3              42.3                  41.9                  −0.4                56.8            56.7                 −0.1
     4              40.6                  39.8                  −0.8                49.9            50.1                  0.2
     5              43.9                  43.9                    0                 53.9            54.2                  0.3
     6              45.2                  45.1                  −0.1                55.6            55.8                  0.2
     7              47.5                  47.5                    0                 59.7            59.8                  0.1
     8              49.3                  49.3                    0                 61.7            61.9                  0.2
     9              44.1                  44.1                    0                 59.2            59.4                  0.2
    10              41.5                  41.6                   0.1                55.9            57.4                  1.5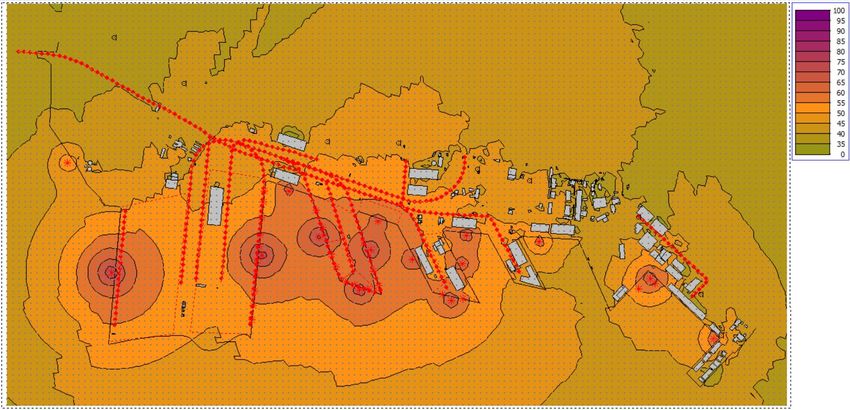
140 | S. Piličić et al.

Table 2: Noise levels (LDEN) for different scenarios based on wind speed and direction

 Receiver         No wind          Most common                                       Worst-case situations
                                                            N         NE          E       SE        S       SW          W        NW
    1              59.5                 59.6              59.6       59.5        59.5    59.5     59.5     59.6       59.6      59.6
    2              55.7                 56.0              55.9       55.1        55.5    55.5     55.6     56.2       55.9      55.9
    3              56.7                 57.5              56.1       55.9        56.2    56.2     57.5     57.7       57.5      57.4
    4              50.1                 52.7              46.2       45.7        46.5    47.1     52.8     52.9       52.7      52.5
    5              54.2                 56.6              50.3       50.1        50.7    52.8     56.7     56.8       56.6      55.9
    6              55.8                 57.9              52.0       51.9        52.2    54.9     58.3     58.3       58.2      57.3
    7              59.8                 60.7              55.9       55.8        56.8    61.2     62.1     62.2       61.9      58.7
    8              61.9                 60.8              58.4       58.7        62.5    63.8     64.0     64.0       61.8      59.1
    9              59.4                 58.5              56.9       56.9        60.1    60.8     61.2     61.2       58.9      57.8
   10              57.4                 56.5              54.0       55.1       58.0     58.9     59.4     59.0       56.9      55.7
 Average           57.05                57.68             54.53      54.47      55.80 57.07 58.71 58.79               58.00     56.99

Table 3: Noise levels (Lnight) for different scenarios based on wind speed and direction

 Receiver         No wind          Most common                                       Worst-case situations
                                                            N         NE          E       SE        S       SW          W        NW
    1              53.1                 53.1              53.1       53.1        53.1    53.1     53.1     53.1       53.1      53.1
    2              42.3                 42.9              42.4       38.9        41.7    41.7     41.8     44.0       42.5      42.5
    3              41.9                 43.2              38.3       37.8        41.2    41.3     44.3     44.4       43.0      43.0
    4              39.8                 42.1              35.4       35.4        37.1    37.9     42.5     42.5       42.1      41.8
    5              43.9                 46.0              39.7       40.1        41.4    43.0     46.4     46.3       45.9      45.3
    6              45.1                 46.7              40.9       41.3        41.8    45.0     47.6     47.6       47.4      46.0
    7              47.5                 48.2              43.2       43.3        44.4    49.3     50.1     50.1       49.8      46.2
    8              49.3                 49.0              45.1       45.3        49.0    51.7     51.8     51.8       50.3      45.8
    9              44.1                 42.1              39.7       41.2        45.3    46.9     47.0     46.6       43.9      39.9
   10              41.6                 37.7              37.2       39.7       43.2     44.5     44.5     43.7       40.1      37.2
 Average           44.86                45.10             41.50      41.61      43.82 45.44 46.91 47.01               45.81     44.08

the lower values in the scenarios when the wind blows                        For comparison, the noise maps showing the noise dis-
from the north. For all the other receivers, it is clear that           persion during the night (Lnight ), are shown on Figure 6 (no
the values are much higher when the wind blows from the                 wind), Figure 7 (the most common situation) and Figure 8
south during all periods, with the difference in values ex-             (the worst-case scenario).
ceeding 5 dB for receivers 4 to 9. The highest value (64 dB)                 In addition to the influence of the wind speed and
was reached in the receiver 8, for situations when the wind             direction, the influences of other meteorological parame-
blows from south and southwest, although the average val-               ters (humidity, atmospheric pressure and air temperature)
ues are slightly higher for the case when the wind blows                were also tested. However, none of those three parameters
from the southwest, both for LDEN and Lnight .                          had any significant influence on the final results, mostly
     On the following three figures, three noise maps are               having either no influence at all or influence in the range
represented, one for the situation without wind (Figure 3),             of less than 0.3 dB, so they are left out of any further dis-
one for the most common meteorological condition (Fig-                  cussions.
ure 4) and the last one for one of the worst-case scenarios                  In the end, it should be noted that the regulated noise
described before (Figure 5). The case when the wind blows               levels in the port (70 dB (A) for LDEN and 60 dB (A) for Lnight
from south-west was chosen, as the noise levels measured                [15]) were not exceeded in any of the scenarios.
in the receivers are, on average, the highest for that situa-
tion.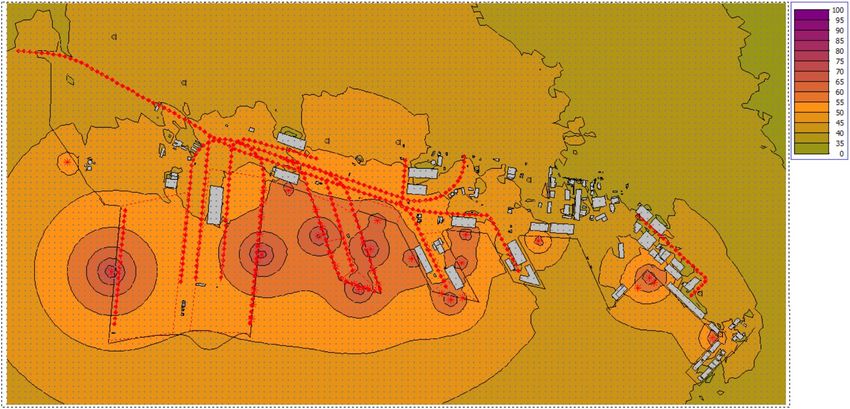
Influence of meteorological conditions on noise dispersion in the Port of Thessaloniki |   141

Figure 3: Noise map of the Port of Thessaloniki for the scenario without wind influence (LDEN)

Figure 4: Noise map of the Port of Thessaloniki for the most common wind conditions (LDEN)

                                                                             As it can be seen from Table 2 and Table 3, the differ-
4 Discussion                                                            ence in noise levels can be up to 7 dB between the two ex-
                                                                        treme scenarios. The noise level change of 7 dB represents
The methodology used here was based on the one pro-
                                                                        a significant difference in loudness (around 60%), accord-
posed in [7] and is also very similar to the ones used in
                                                                        ing to the following formula [24]:
previously mentioned works, such as [8] and [9], but ex-
                                                                                                          ∆L      ∆L
panded in order to include various meteorological condi-                                         x = 10 33.22 = 2 10 ,
tions. Of all meteorological parameters tested, only the
wind was shown to have a significant influence on the fi-
nal results.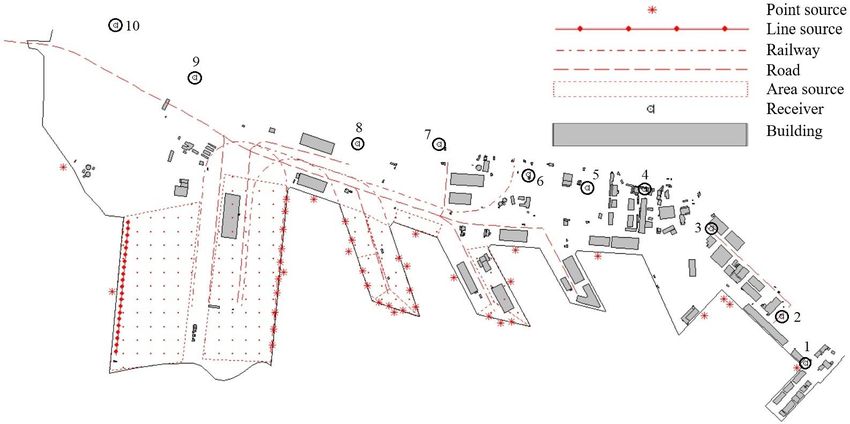
142 | S. Piličić et al.

Figure 5: Noise map of the Port of Thessaloniki for the worst-case wind conditions (LDEN)

Figure 6: Noise map of the Port of Thessaloniki for the scenario without wind influence (Lnight)

Where:                                                                  wind direction is at its most undesirable value. For exam-
x – loudness ratio                                                      ple, a noise level of 60 dB is exceeded only in the very close
∆L – noise level change (dB)                                            proximity to the receivers on Figures 3 and 4, but in the
     In addition to the noise levels in the receivers, signifi-         worst-case scenario on Figure 5, the “60 dB zone” stretches
cant differences can be observed by comparing Figures 3,                a lot more to the upper edge of the figure, where the first
4 and 5 for LDEN values and Figures 6, 7 and 8 for Lnight val-          buildings are located.
ues. It is clear that the noise levels in the upper part of the              With the difference being so significant, it is clear that
figures, where the city is located, are significantly higher in         influence of the wind needs to be taken into account from
the scenario where the wind speed is at its highest and the             several different perspectives, such as those linked with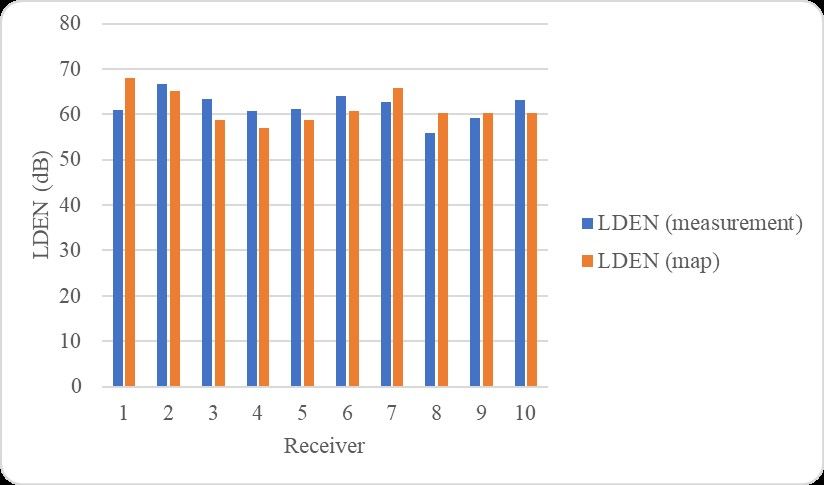
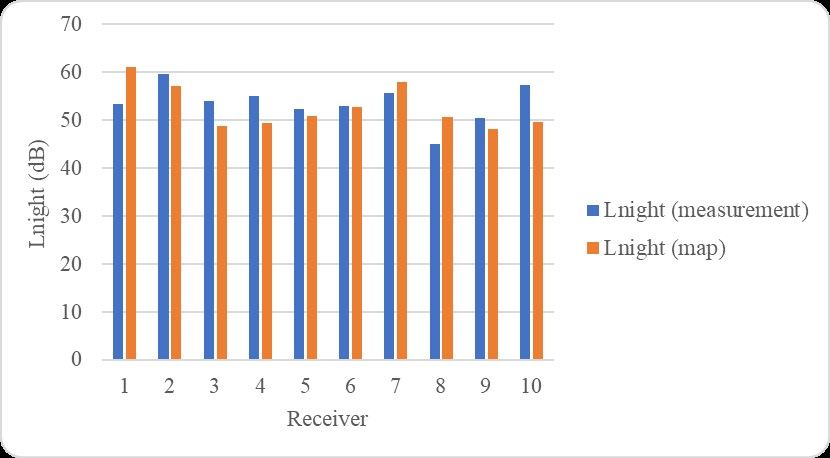
Influence of meteorological conditions on noise dispersion in the Port of Thessaloniki |   143

Figure 7: Noise map of the Port of Thessaloniki for the most common wind conditions (Lnight)

Figure 8: Noise map of the Port of Thessaloniki for the worst-case wind conditions (Lnight)

noise measurements, noise mapping and noise reduction                   ulation used for comparison uses several sources outside
procedures. The first of these issues are noise measure-                of the port, hence the higher values).
ments. It is not an uncommon practice to make measure-                       The measurements were taken during several days,
ments on different days and in very different meteorologi-              probably due to lack of available sensors, and those con-
cal conditions. One of the examples of such practice is the             ditions were mentioned in each of their measurement re-
modelling of noise in the Port of Thessaloniki [15]. In it, the         ports, but the wind conditions changed so significantly
measurements were used for the validation of the simula-                (for example, the wind direction changed from north to
tion results, resulting in several deviations between them,             south during two days) that those results were basically
as seen on Figure 9 (LDEN ) and Figure 10 (Lnight ) (the sim-           useless for direct comparison between them and the sim-
144 | S. Piličić et al.

                                                                    tions, as well as studying the most frequent meteorologi-
                                                                    cal conditions in an area (in this case – the Port of Thessa-
                                                                    loniki), it is possible to take adequate steps to reduce the
                                                                    negative influence of the wind. For example, noise barriers
                                                                    can be built on the side from which the wind blows most
                                                                    frequently to prevent higher noise levels in workplaces.
                                                                    Also, it is possible to address the issue of ports’ noise pollu-
                                                                    tion outside of the port borders and take adequate steps to
                                                                    reduce it. Such a study would need to be made on a larger
                                                                    level (for a larger area), such as the one presented in [10].

Figure 9: Differences between measured and calculated values for
LDEN in the Port of Thessaloniki yearly report [15]
                                                                    5 Conclusion
                                                                    Different wind speeds and directions were shown to have
                                                                    a significant influence on both the values of noise levels
                                                                    and the distribution of those levels. The higher the wind
                                                                    speed is, the higher the difference compared to the sce-
                                                                    nario with no wind. Although the wind did not cause over-
                                                                    shoot of the noise level limits regulated by law in this
                                                                    case, the differences are large enough that they should be
                                                                    taken into account in any similar noise level assessment. It
                                                                    also shows that meteorological conditions should be con-
                                                                    sidered whenever making on-site measurements and that,
Figure 10: Differences between measured and calculated values for   even if the limits are not exceeded during the measure-
Lnight in the Port of Thessaloniki yearly report [15]               ment, they might be exceeded in less favourable meteoro-
                                                                    logical conditions.
ulated values. Two direct solutions can be proposed for                  The simulations for the chosen port were made for all
this problem. The first one is that measurements should             the significant cases. However, there are still several sub-
be taken on the same day, which can be hard if there are            jects for future analyses. Most importantly, the emphasis
not enough sensors available. The other solution is to mea-         was on the creation of the noise dispersion model for the
sure noise levels during different days, but when the condi-        port area, without the estimation of the influence on the
tions are similar. There is also an issue with this solution,       local population. As only the noise from the port was as-
as the measurements are usually done by outside contrac-            sessed, without taking into account the noise that results
tors and it would be complicated (and financially incon-            from nearby roads and places for social activities, future
venient) for the ports to do it. There is also the third so-        work would be to expand the existing model to include
lution that can be used and that is the adjustment of the           nearby noise sources and to obtain information about the
measured values for the comparison with simulation. The             nearby residential areas and other areas that could be af-
adjustments can be made based on the simulations like the           fected by high noise levels (schools, hospitals etc.).
one done in this article.
     As for the use in simulations, it is pretty much a sim-        Acknowledgement: This work was supported by the Euro-
ilar situation, only inverted. In that case, measurements           pean Union’s Horizon 2020 research and innovation pro-
were already taken, and simulation needs to be validated            gramme under grant agreement No 769355 (“Port IoT for
based on those results. The simplest solution is to make            Environmental Leverage — PIXEL”).
several simulations, one for each different set of meteoro-
logical parameters.
     Use of noise dispersion models in noise reduction pro-         References
cedures is one of their most significant uses, as it is pos-
sible to check different scenarios without losing too much          [1]   Directive 2002/49/EC of the European Parliament and of the
time or money. By testing different wind speeds and direc-                Council of 25 June 2002 relating to the assessment and manage-
Influence of meteorological conditions on noise dispersion in the Port of Thessaloniki | 145
ment of environmental noise - Declaration by the Commission [13] Fotini C., Vassilis D., Dimitra D., George S., Determination of
in the Conciliation Committee on the Directive relating to the ships as noise sources & noise mapping at passenger & cruise
assessment and management of environmental noise, E. Parlia- port of Piraeus, 23rd International Congress on Sound and Vi-
ment, 2002. bration: From Ancient to Modern Acoustics (ICSV 2016), 2016, 1,
[2] Ignaccolo M., Environmental capacity: noise pollution at Catania- 689-696.
Fontanarossa international airport, J. Air Transp. Manag., 2000, [14] Borelli D., Schenone C., A multidisciplinary approach forharbour
6, 4, 191-199. https://doi.org/10.1016/S0969-6997(00)00013-2 noise pollution reduction: The REPORT project, 25thInternational
[3] de Kluijver H., Stoter J., Noise mapping and GIS: optimising Congress on Sound and Vibration 2018: Hiroshima Calling (ICSV
quality and eflciency of noise effect studies, Comput. Environ. 2018), 2018, 8, 5043-5049.
Urban., 2003, 27, 1, 85-102. https://doi.org/10.1016/S0198- [15] Thessaloniki Port Authority, Πρóγραµµα παρακoλoύθησης
109715(01)00038-2 ακoυστικoύ πϵριβ άλλoντoς OΛΘ AE, Athens, Greece, 2018.
[4] Havránek J., Schuschke G., Experience with urban traflc [16] Piličić S., Traven L., Milošević T., Kegalj I., Skoblar A., Žigulić R.,
noisemaps in Czechoslovakia and German Democratic Republic, Noise Pollution – Introduction to the State of the Research and
J. Hyg. Epid. Microb. Im., 1981, 25, 4, 407-413. the Implementation in the Horizon 2020 Project Pixel, Pomor. Zb.
[5] Olayinka O., Noise map: Tool for abating noise pollution in urban - J. Marit. Transp. Sci., 2020, Special edition no. 3, 133-145.
areas, World J. Envir. Pollut., 2012, 2, 1, 10-21. [17] Commission Directive (EU) 2015/996 of 19 may 2015 establish-
[6] Cho D.S., Kim J.H., Manvell D., Noise mapping using measured ing common noise assessment methods according to directive
noise and GPS data, Appl. Acoust., 2007, 68, 9, 1054-1061. 2002/49/ec of the European Parliament and of the Council, 2015.
https://doi.org/10.1016/j.apacoust.2006.04.015 [18] Kephalopoulos S., Paviotti M., Anfosso-Lédée F., Common noise
[7] Van Breemen T., Good practice guide on port area noise mapping assessment methods in Europe (CNOSSOS-EU), Institute for
and management, Proceedings of the 8th European Conference Health and Consumer Protection (Joint Research Centre), 2012.
on Noise Control (EURONOISE), 2009, 1560-1568. http://doi.org/10.2788/51224
[8] Morretta M., Iacoponi A., Dolinich F., The port of Livorno noise [19] EMS Bruel & Kjaer, Predictor-LimA - internal help, EMS Bruel &
mapping experience, Proceedings of the 7th European Confer- Kjaer, 2019.
ence on Noise Control (EURONOISE), 2008, 1355-1360. [20] Windfinder, Yearly wind and weather averages for Thessaloniki
[9] Schenone C., Pittaluga I., Borelli D., Kamali W., El Moghrabi Airport, [Online] available: https://www.windfinder.com/windst
Y., The impact of environmental noise generated from ports: atistics/Thessaloniki (accessed November 11, 2019).
Outcome of MESP project, Noise Mapp., 2016, 3, 1, 26-36. [21] Weather Underground, Neon Ryssion, Central Macedonia, Greece
https://doi.org/10.1515/noise-2016-0002 Weather History, [Online] available: https://www.wunderground.
[10] Paschalidou A.K., Kassomenos P., Chonianaki F., Strategic Noise com/history/monthly/gr/neon-ryssion/LGTS/date (accessed 2
Maps and Action Plans for the reduction of population exposure February 2020).
in a Mediterranean port city, Sci. Total Environ., 2019, 654, 144- [22] Timeanddate.com, Annual Weather Averages Near Thessaloniki,
153. https://doi.org/10.1016/j.scitotenv.2018.11.048 [Online] available: https://www.timeanddate.com/weather/gree
[11] Badino A., Borelli D., Gaggero T., Rizzuto E., Schenone C., Air- ce/thessaloniki/climate (accessed 9 February 2020).
borne noise emissions from ships: Experimental characterization [23] Penton S., Chadder D., Stiebert S., Sifton V., The effect of me-
of the source and propagation over land, Appl. Acoust., 2016, teorology and terrain on noise propagation-Comparison of five
104, 158-171. https://doi.org/10.1016/j.apacoust.2015.11.005 modelling methodologies, Canadian Acoust., 2002, 30, 4, 30-33.
[12] Di Bella A., Remigi F., Prediction of noise of moored [24] Sengpiel Elektrotechnik GmbH, Calculator - Level Change,
ships,Proceedings of Meetings on Acoustics, 2013, 19, [Online] available: http://www.sengpielaudio.com/calculator-
art. no. 010053. https://doi.org/10.1121/1.4799451 levelchange.htm (accessed 9 February, 2020).You can also read