TOURISM & HOSPITALITY - For updated information, please visit www.ibef.org

Page created by Eddie Palmer
 
CONTINUE READING
TOURISM & HOSPITALITY - For updated information, please visit www.ibef.org
TOURISM &
 HOSPITALITY

For updated information, please visit www.ibef.org   May 2020
TOURISM & HOSPITALITY - For updated information, please visit www.ibef.org
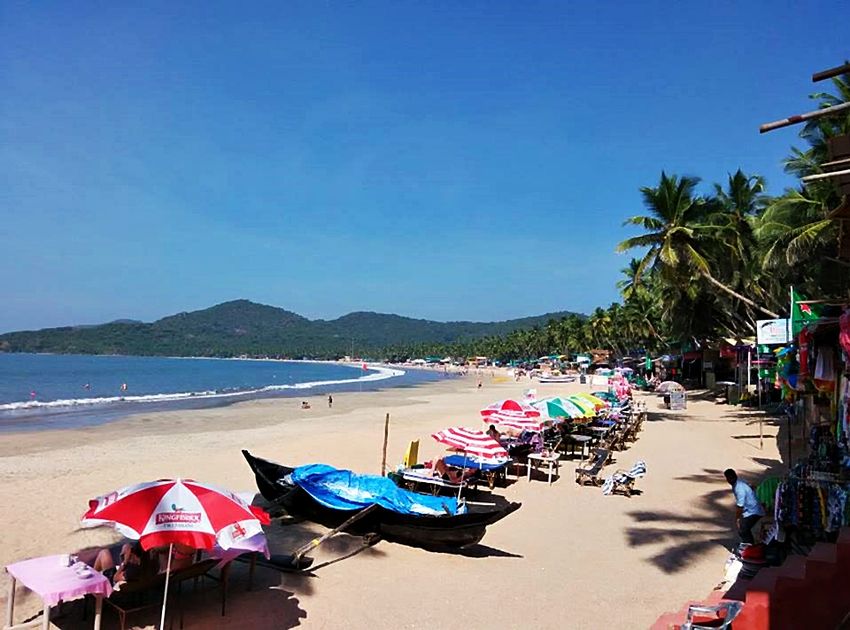
Table of Contents

   Executive Summary……………….….…….3

   Advantage India…………………..…..……..4

   Market Overview ………………….….……..6

   Recent Trends and Strategies…………....16

   Growth Drivers……………………..............19

   Opportunities…….……….......……….……28

   Industry Associations……………....……...32

   Useful Information……….......…………….34
TOURISM & HOSPITALITY - For updated information, please visit www.ibef.org
EXECUTIVE SUMMARY

                                              According to WTTC, India ranked third among 185 countries in terms of travel & tourism’s total contribution to
     Contribution to GDP                       GDP in 2018. During 2019, FEEs from tourism increased 4.8 per cent* y-o-y to Rs 1,94,881 crore (US$ 29.96
     above world average                       billion).

                                              In India, the sector’s direct contribution to GDP is expected to grow by 7.1 per cent per annum during 2018-28.

     Creating higher                         As of 2019, 4.2 crore jobs were created in the tourism sector in India, which was 8.1 per cent of the total
     employment                               employment in the country.

                                              Travel & tourism’s contribution to capital investment in India is projected to grow 6.7 per cent per annum during
                                               2018–28.
     Higher investment
                                              Under the Swadesh Darshan scheme, 77 projects have been sanctioned worth Rs 6,035.70 crore (US$ 863.60
                                               million).

                                               Contribution of visitor export to total export is estimated to increase 5.5 per cent per annum during 2018–2028.
     Increasing visitor export
                                               International tourists arrival is expected to reach 30.5 billion by 2028.

                                               Electronic tourist authorisations, known as e-Tourist Visa, launched by the Government of India, has resulted
                                                in increase in number of tourist visa issued in the country. The facility was extended to citizens of 169
     New visa reforms                           countries as of December 2019.

                                               During 2019, a total of 29,28,303 tourists arrived on e-Tourist Visa, registering a growth of 23.6 per cent.

    Note: CY - Calendar Year, FEE – Foreign Exchange Earning, * - Increased in US$ terms
    Source: World Travel & Tourism Council’s (WTTC’s) Economic Impact 2019, Ministry of Tourism

3        Tourism & Hospitality                                                                                For updated information, please visit www.ibef.org
TOURISM & HOSPITALITY - For updated information, please visit www.ibef.org
Tourism & Hospitality

ADVANTAGE INDIA
ADVANTAGE INDIA

       By 2020, medical tourism industry of India is                                                                      India has a diverse portfolio of niche tourism
        expected to touch US$ 9 billion.                                                                                    products – cruises, adventure, medical, wellness,
                                                                                                                            sports, MICE, eco-tourism, film, rural & religious
       During 2019, 10.89 million foreign tourists
                                                                                                                            tourism.
        arrived in the country.

       International tourist arrivals are expected to
        reach 30.5 million by 2028.

       Prime Minister Narendra Modi urged people to
        visit 15 domestic tourist destinations in
        India by 2022.

                                                                                  ADVANTAGE
                                                                                     INDIA
      India offers geographical diversity,                                                                                     A 5-year tax holiday has been offered for 2-
       attractive beaches, 30 World Heritage                                                                                     ,3- and 4-star category hotels located
       Sites and 25 bio-geographic zones.                                                                                        around UNESCO World Heritage sites
                                                                                                                                 (except Delhi & Mumbai).
      The country’s big coastline is dotted
       with several attractive beaches.                                                                                         Under the Swadesh Darshan scheme, 15
                                                                                                                                 thematic circuits in the country have been
      Ministry of Tourism is promoting
                                                                                                                                 selected for development of tourism
       Buddhist Circuit to increase India’s
                                                                                                                                 infrastructure.
       share in global tourism market.
                                                                                                                                e-Tourist Visa facility offered to 169
                                                                                                                                 countries as of December 2019.

    Note: UNESCO – United Nations Educational, Scientific and Cultural Organisation, MICE – Meetings, Incentives, Conferences, and Exhibitions, CY – Calendar Year
    Source: World Travel & Tourism Council’s (WTTC’s) Economic Impact 2019, Ministry of Finance

5         Tourism & Hospitality                                                                                         For updated information, please visit www.ibef.org
Tourism & Hospitality

MARKET OVERVIEW
EVOLUTION OF THE INDIAN TOURISM AND
                     HOSPITALITY SECTOR

        The National Tourism Policy was                                        A national policy on tourism was announced in
         announced in 1982                                                       2002, focusing on developing a robust
        The Government formulated a                                             infrastructure
         comprehensive plan in 1988 to promote                                  Online travel portals & low-cost carrier airlines
         tourism                                                                 gave a boost to domestic tourism

                                                                                                                                                     2015 onwards
                  Pre-1990                           1990–2000                                       2000–05

                                                                                                                       The Government has undertaken various marketing
                                             Various states in India declared tourism                                  initiatives to attract tourists
                                              as an industry
                                                                                                                       E– tourist Visa launched – 4 million tourists arrived in
                                             The Government stressed on private-                                       India in 2018 through this facility
                                              public partnership in the sector
                                                                                                                       Travel and tourism sector accounted for 8.1 per cent
                                             Government policies give a fillip to the                                  of total employment opportunities in India in 2019
                                              hotel industry
                                                                                                                       In November 2018, India attained third position in the
                                                                                                                        world tourism sector after China and US

    Source: WTTC, Ministry of Tourism

7        Tourism & Hospitality                                                                                  For updated information, please visit www.ibef.org
SEGMENTS OF TOURISM AND HOSPITALITY

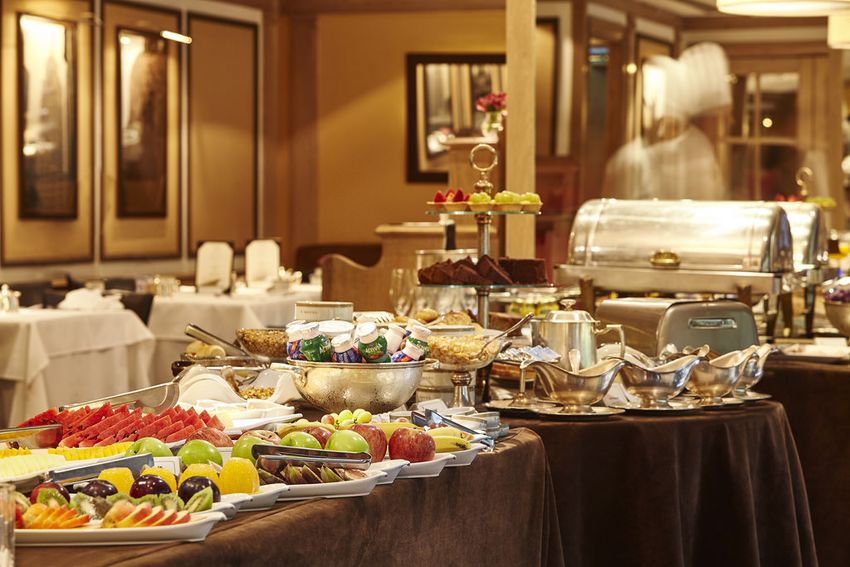
                                                                Accommodation could be hotels & motels, apartments, camps, guest houses,
                                             Accommodation      lodge, bed & breakfast establishments, house boats, resorts, cabins & hostels. In
                                              and catering      addition, tourists also require catering facilities, which includes include hotels,
                                                                local restaurants, roadside joints, cafeterias & retail outlets serving food &
                                                                beverages

                                                                Comprises airline companies, cruise services, railways, car rentals & more. A
                                              Transportation
                                                                tourist’s choice of transport would depend on the travel budget, destination, time,
                                                                purpose of the tour & convenience to the point of destination

                                                                Another major component of the travel & tourism industry is ‘attractions’ such
     Tourism and                                                as theme parks & natural attractions including scenic locations, cultural &
                                                 Attractions
      hospitality                                               educational attractions, monuments, events & medical, social or professional
                                                                causes

                                                                A fragmented sector with several independent travel agents & many online
                                                                businesses. They also sell associated products such as insurance, car hire &
                                               Travel agents    currency exchange
                                                                Business travel agencies specialise in making travel & accommodation
                                                                arrangements for business travellers & promoting conference trades

                                              Tour operators    Offer customised tours, including travel, accommodation & sightseeing

    Source: Dun and Bradstreet’s Report on Tourism in India

8        Tourism & Hospitality                                                                For updated information, please visit www.ibef.org
EMERGING TOURISM AND HOSPITALITY SEGMENTS

                                       The aim is to develop interest in heritage and culture; & promote visits
                                        to village settings to experience & live a relaxed & healthy lifestyle

                                                                                                                      A wide range of adventure sports are
      One of the biggest contributor                                                                                    covered under this category with
        to tourism industry. India                                            Rural                                          specialised packages
        being a religious hub for                                            tourism                                          The activities include
        different cultures, attract                                                                                    mountaineering, trekking, bungee
        many tourists every year                                                                                         jumping, mountain biking, river
                                                              Pilgrimage                        Adventure
                                                                                                                             rafting & rock climbing
                                                               tourism                           tourism

                                                                                                                       Tourists seek specialised medical
                                                                                                                     treatments, mainly ayurvedic, spa &
      Vast variety of flora & fauna                                                                 Medical                      other therapies
                                                 Eco-tourism                                                          The primary purpose is achieving,
      in various states is a major                                                                  tourism
      factor behind their growing                                                                                       promoting or maintaining good
          popularity as tourist                                                                                         health & a sense of well-being
              destinations.
       Thenmala in Kerala is the
        1st planned ecotourism                                      Luxury               Heritage
          destination in India.                                    tourism               tourism              Tourists visit India for its cultural heritage
                                                                                                                              in various cities
                                                                                                                  The country’s rich heritage is amply
                                                                                                               reflected in the various temples, majestic
                 The luxury travel market in India is expected to grow                                              forts, pleasure gardens, religious
                 at rate of 12.8 per cent during 2015-25, the highest in                                      monuments, museums, art galleries, urban
                        comparison with any other BRIC country.                                                                 & rural sites

    Source: Dun and Bradstreet’s Report on Tourism in India

9        Tourism & Hospitality                                                                           For updated information, please visit www.ibef.org
RISING CONTRIBUTION TO INDIA’S GDP

     Direct Contribution of Travel and Tourism to GDP at Real 2017                   Total Contribution of Travel and Tourism to GDP at Real 2019
              Visakhapatnam port traffic (million tonnes)                                     Visakhapatnam port traffic (million tonnes)
                           Prices (US$ billion)                                                           Prices (US$ billion)

       250.00                         CAGR 7.23%                                      600.00                                  CAGR 7.02%

                                                                                      500.00
       200.00

                                                                                                                                                         512.00
                                                                           194.69
                                                                                      400.00
       150.00
                                                                                      300.00
       100.00

                                                                                                                                               268.29
                                                                                                                                     247.37
                                                          98.17                       200.00

                                                                                                                     232.01
                                                                                                    219.72
                                        91.27
                       87.17

         50.00
                                                                                      100.00

          0.00                                                                           0.00
                     2016             2017              2018              2028F                   2016              2017            2018      2019F     2029F

      India ranked eighth in the world in 2018, contributing almost US$ 247 billion to the country’s GDP. It is the third largest foreign exchange earner
       for the country.

      India was ranked 34 in the Travel & Tourism Competitiveness Report 2019 published by the World Economic Forum.

      The tourism & hospitality sector’s direct contribution to GDP is expected to reach Rs 12.68 trillion (US$ 194.69 billion) in 2028.

      According to 2018 report of the World Travel and Tourism Council (WTTC), India was ranked third in the tourism sector.

      Total earning from the sector in India stood at US$ 28.6 billion in 2018, and it is targeted to reach US$ 50 billion by 2022.

 Note: CAGR – Compound Annual Growth Rate, E - Estimated, F -Forecast,
 Source: World Travel & Tourism Council’s (WTTC’s) Economic Impact 2019

10      Tourism & Hospitality                                                                                For updated information, please visit www.ibef.org
FOREIGN ARRIVALS ARE RISING

       During 2019, foreign tourist arrivals (FTAs) in India stood at 10.89                                     Visakhapatnam
                                                                                                                  Foreign touristsport
                                                                                                                                   arriving
                                                                                                                                       trafficin(million
                                                                                                                                                 India (million)
                                                                                                                                                         tonnes)
        million, achieving a growth rate of 3.20 per cent y-o-y.

      Growth in tourist arrivals has been due to flexible Government                                                                   CAGR 7.96%
                                                                                                      12.0
       policies, developed rail & road infrastructure, ease in availability of e-
       Tourist Visa to foreign tourists. In 2019, arrivals through e-Tourist

                                                                                                                                                       10.90
       Visa increased by 23.6 per cent y-o-y to 2.9 million.

                                                                                                                                             10.55
                                                                                                      10.0

                                                                                                                                10.18
      The Government is working to achieve 1 per cent share in world's
       international tourist arrivals by 2020 and 2 per cent share by 2025.

                                                                                                                   8.80
                                                                                                       8.0
      In 2020*, FTAs in India stood at 2.46 million.

                                                                                                       6.0

                                                                                                       4.0

                                                                                                       2.0

                                                                                                                                                                    2.46
                                                                                                       0.0
                                                                                                                  2016         2017         2018     2019          2020*

     Note: CY – Calendar Year, E- Estimated, T-Target., FTAs – Foreign Tourist Arrivals, CAGR upto 2019, *- till March 2020
     Source: Ministry of Tourism

11       Tourism & Hospitality                                                                                            For updated information, please visit www.ibef.org
RISE IN FOREIGN EXCHANGE

      Tourism is an important source of foreign exchange in India similar          Foreign Exchange Earnings from tourism in India
                                                                                       Visakhapatnam port traffic (million tonnes)
       to many other countries.                                                                      (US$ billion)

      During 2019, India earned foreign exchange of US$ 29.96 billion
                                                                             35.0
       from tourism, recording a y-o-y growth of 4.80 per cent. Foreign
       exchange earnings (FEEs) from tourism in India witnessed growth at
       a CAGR of 8.96 per cent during 2007-2019.                             30.0

                                                                                                                             29.96
      In 2020*, India earned US$ 6.15 billion in foreign exchange of from

                                                                                                                 28.59
                                                                                                      27.69
       tourism.                                                              25.0

                                                                                        23.15
                                                                             20.0

                                                                             15.0

                                                                             10.0

                                                                              5.0

                                                                                                                                        6.15
                                                                              0.0

                                                                                                                                        2020*
                                                                                        2016

                                                                                                      2017

                                                                                                                 2018

                                                                                                                             2019
     Note: FEE – Foreign Exchange Earnings, *- till March 2020
     Source: Ministry of Tourism, Economic Times

12        Tourism & Hospitality                                                                 For updated information, please visit www.ibef.org
DOMESTIC CONSUMERS TO LEAD GROWTH

                   Visakhapatnam
                     Share of tourists
                                   portby
                                        traffic
                                          expenditure
                                                (million tonnes)
                                                         (2019)                           Expected share of tourists by expenditure (2028F)

                                                                                                  11.15%                            Domestic spending
                      12.80%                          Domestic spending

                                                                                                                                    Foreign visitor
                                                                                                                                    spending

                               87.20%                 Foreign visitor spending                             88.85%

       Domestic travel revenue is estimated at Rs US$ 215.38 billion in 2019 and is anticipated to further increase to US$ 405.8 billion by 2028F.

     Note: F- Forecasted
 Source: World Travel & Tourism Council’s Economic Impact 2019

13        Tourism & Hospitality                                                                       For updated information, please visit www.ibef.org
RISING REVENUES FROM LEISURE AND BUSINESS
                  SEGMENTS

                Visakhapatnam
                   Segment–wise
                              port
                                revenue
                                   traffic (million
                                            share (2019)
                                                    tonnes)                                 Expected segment-wise revenue share (2028F)

                                                                                                                          Leisure spending
                       5.2%                                                                        5.45%
                                                        Leisure Spending

                                                                                                                          Business spending

                                                        Business Spending
                          94.8%                                                                      94.55%

      Share of revenue from leisure travel to total tourism stood around 94.8 per cent in 2019.

      Leisure travel spending reached US$ 234.16 billion in 2019 and is expected to reach US$ 432.3 billion by 2028F.

      Business travel revenue was US$ 12.84 billion in 2019 and is projected to increase to US$ 24.4 billion by 2028F.

 Note: F-Forecasted
 Source: World Travel & Tourism Council’s (WTTC’s) Economic Impact 2019

14      Tourism & Hospitality                                                                       For updated information, please visit www.ibef.org
MAJOR COMPANIES ACROSS SEGMENTS

                                                                    Revenue
                       Company               Segment                                                 Other major players
                                                                  (US$ millions)

                                                                       675
                                                            448                    486               Yatra.com, cleartrip.com,
                                           Online booking
                                                                                          travelocity.com, travelchacha.com, ixigo.com
                                                            FY17      FY18         FY19

                                                                                   658
                                                            382        410
                                               Hotel                                                 ITC, Oberoi, Marriott
                                                            FY17      FY18         FY19

                                                            1,121
                                                                      1,009        828
                                           Tour operators                                             SOTC, Raj Travels
                                                            FY17      FY18         FY19

     Source: Respective company websites

15    Tourism & Hospitality                                                         For updated information, please visit www.ibef.org
Tourism & Hospitality

RECENT TRENDS
AND STRATEGIES
NOTABLE TRENDS IN THE TOURISM INDUSTRY IN
                  INDIA

                                             Over 70 per cent of air tickets are now being booked online in the country.
     Online travel operators
                                             Several online travel & tour operators have emerged in India and are customized options to consumers.

                                            The widespread practice of Ayurveda, yoga, siddha and naturopathy complemented with nation’s spiritual
     Wellness tourism
                                             philosophy makes India a famous wellness destination.

                                            Government of India has estimated that India would emerge with a market size of 1.2 million cruise visitors by
                                             2030-31. The Government is planning to set up five cruise terminals in the country and increase cruise ships
                                             to 1,000.
     Cruises                                Zen cruises launched its premiere cruise line, Jalesh Cruises, and started its cruise service in India in April
                                             2019.

                                            In November 2019, Chipsan Aviation introduced helicopter services from Willingdon Island, Cochin Port.

                                            Adventure tourism is one of the most popular segments of tourism industry. Owing to India’s enormous geo-
                                             physical diversity, it has progressed well over the years. Moreover, the Government has recognised Adventure
     Adventure                               tourism as a niche tourism product to attract tourists with specific interest.

                                            Part of India’s tourism policy, almost every state has definite programme to identify & promote Adventure
                                             tourism.

                                            Promotion of camping sites have been encouraged with adequate acknowledgement of its adverse effects on
                                             the environment.
     Camping sites
                                            Besides providing unique rewarding experiences, responsible conduct of camping can be a major source of
                                             economic opportunity in remote areas as well as an instrument of conservation.

 Source: Incredible India, Economic Times, News sources

17      Tourism & Hospitality                                                                           For updated information, please visit www.ibef.org
STRATEGIES ADOPTED

                                             Players are trying to ensure convenience for their customers by providing all services available on a single
                                              portal. For example, makemytrip.com and a host of other websites provide a comprehensive basket of offerings
     One stop solution
                                              which include outbound & inbound travel for leisure and business trips, hotel and car booking, holiday packages
                                              within India and abroad, etc.

                                           Players are opting for many channels to maximise sales and ensure convenience for their customers. For
                                            example, Thomas Cook & Kuoni India launched their online portal to compete with others. On the other hand,
     Multiple channels
                                            makemytrip.com is planning to go for the offline channel to complement its existing portal and has already
                                            launched a mobile app for maximising sales.

                                          The launch of several branding and marketing initiatives by the Government of India like Incredible India and
     Branding                              Athiti Devo Bhava provides a focused impetus to growth.

                                           The Government has launched Incredible India 2.0 campaign to market specific promotional plans.

                                          Indian Government has also released a fresh category of visa, the medical visa or M-visa, to encourage
     M-visa
                                           medical tourism in India.

                                             Companies have started using data analytics to create a 360-degree profile of their customers.
     Data analytics and
                                             Makemytrip have started using AI powered chatbots. 25 per cent of its post-sales requests are now serviced
     Artificial Intelligence
                                              by chatbots.

                                              India has long been known as the seat of spiritualism and India’s cosmopolitan nature is best reflected across
     Spiritual tourism                         its pilgrim centres.
                                              India has been recognised as a destination for spiritual tourism for domestic and international tourists.

 Source: Make in India, Company websites, Ministry of Tourism, KPMG – Expedition 3.0, VC Circle

18      Tourism & Hospitality                                                                             For updated information, please visit www.ibef.org
Tourism & Hospitality

GROWTH DRIVERS
GROWTH DRIVERS FOR THE TOURISM MARKET

      More than half of Ministry of Tourism’s budget is                                 Domestic expenditure on tourism is expected to
       channelised for funding the development of                                         rise due to the growing income of households.
       destinations, circuits, mega projects as well as rural
       tourism infrastructure projects.                                                  Several niche offerings such as medical
                                                                                          tourism & eco tourism are expected to create
      Tourism Ministry is currently developing several                                   more demand.
       theme-based tourist circuits under Swadesh
       Darshan Scheme to promote tourism.                                                By 2029, India’s tourism sector is expected to
                                                                                          reach Rs 35 trillion (US$ 488 billion) with a
                                                                                          growth of 6.7 per cent and accounting for 9.2
                                                                                          per cent of the total economy.

                                                                    Growth drivers
      Hotel & Tourism sector has received                                               A web based Public Service Delivery System
       cumulative FDI inflow of US$ 13.21 billion                                         (PSDS) had been launched by the Ministry of
       between April 2000 and December 2019.                                              Tourism to enable all the applicants seeking
      International hotel brands are targeting India.                                    approval for hotel projects and track their
       Carlson group is aiming to increase the                                            applications online on a real time basis.
       number of its hotels in India to 170 by 2020.                                     The Government will develop 17 iconic tourist
      Hospitality majors are entering into tie-ups to penetrate                          sites in India into world-class destinations as
       deeper into the market. Taj & Shangri-La entered into a                            conveyed in the Union Budget 2019-20.
       strategic alliance to improve their reach and market share
       by launching loyalty programmes aimed at integrating
       rewarded customers of both hotels.

 Source: Make in India, DPIIT

20       Tourism & Hospitality                                                       For updated information, please visit www.ibef.org
RISE IN INCOME AND CHANGING DEMOGRAPHICS
                   BOOSTING DEMAND

      Rising income mean a steady growth in the ability to access                          Visakhapatnam
                                                                                              GDP Per Capita
                                                                                                           port
                                                                                                             at Current
                                                                                                                traffic (million
                                                                                                                         Prices tonnes)
                                                                                                                                 (US$)
       healthcare & related services

      India’s GDP per capita at current prices is estimated to have                3,500                                    CAGR 6.84%
       reached US$ 2,175 in 2019-20. It is expected to reach US$

                                                                                                                                                                                     3,277.28
       3,277.28 by 2024.
                                                                                    3,000

                                                                                                                                                                          3,023.39
                                                                                                                                                               2,791.31
                                                                                    2,500

                                                                                                                                                    2,578.11
                                                                                                                                         2,378.67
                                                                                                                              2,175.02
                                                                                    2,000

                                                                                                                  2,036.20
                                                                                                       2,014.01
                                                                                            1,761.63
                                                                                    1,500

                                                                                    1,000

                                                                                     500

                                                                                       0

                                                                                            2016

                                                                                                       2017

                                                                                                                  2018

                                                                                                                              2019

                                                                                                                                         2020

                                                                                                                                                    2021

                                                                                                                                                               2022

                                                                                                                                                                          2023

                                                                                                                                                                                     2024
 Source: International Monetary Fund, World Economic Outlook Database, April 2019

21      Tourism & Hospitality                                                                           For updated information, please visit www.ibef.org
INCREASING SPENDING ON TOURISM

      Domestic expenditure on tourism has grown significantly.
                                                                               Domestic Expenditure
                                                                                 Visakhapatnam port on Tourism*
                                                                                                    traffic        (US$
                                                                                                            (million    billion)
                                                                                                                     tonnes)
      It is expected to reach US$ 405.84 billion by 2028 from being at
       US$ 179.33 in FY16.
                                                                                                     CAGR 7.29%
                                                                          450.00

                                                                          400.00

                                                                                                                                   405.84
                                                                          350.00

                                                                          300.00

                                                                          250.00

                                                                          200.00

                                                                                                                    199.63
                                                                                                      186.03
                                                                                      179.33
                                                                          150.00

                                                                          100.00

                                                                           50.00

                                                                            0.00
                                                                                     2016            2017          2018         2028F

 Note: F – Forecast, *at real 2017 prices converted at USD = INR 65.12
 Source: WTTC - Travel & Tourism Economic Impact 2019

22     Tourism & Hospitality                                                              For updated information, please visit www.ibef.org
GOVERNMENT INITIATIVES

                                               Based on specific themes, Government has identified 15 circuits which include Krishna Circuit, Buddhist
                                                Circuit, Himalayan Circuit, Northeast Circuit, Coastal Circuit, wildlife circuit and tribal circuit.

                                               So far, 77 projects for an amount Rs 6,035.70 crore (US$ 836.60 million) have been sanctioned under the
     Swadesh Darshan
                                                Swadesh Darshan Scheme since FY15.

                                               Under Budget 2020-21, the Government has allotted Rs 1,200 crore (US$ 171.70 million) for the development
                                                of tourist circuits under Swadesh Darshan for entire Northeast.

                                               National Mission on Pilgrimage Rejuvenation & Spiritual Augmentation was implemented by the Ministry for
     Pilgrimage Rejuvenation                    enhancing the facilities and infrastructure provided at pilgrimage centres across the country.

     and Spiritual, Heritage                   Under Budget 2020-21, the Government has allocated Rs 207.55 crore (US$ 29.70 million) for the
     Augmentation Drive                         development of tourist circuits under PRASHAD.

     (PRASHAD)                                 As of now, a total of 28 projects have been sanctioned for an amount of Rs 840.02 crore (US$ 120.19 million)
                                                under this scheme.

                                               Formulation of National Tourism Policy 2015 was initiated to encourage Indian citizens to explore their own
     National Tourism Policy                    country as well as position the country as a ‘Must See’ destination for global travellers.
     2015                                      Under Union Budget 2020-21, Rs 590 crore (US$ 84.42 million) has been allocated for promotion and
                                                publicity of various programmes and schemes of the Tourism Ministry.

                                               Statue of Sardar Vallabhbhai Patel, also known as ‘State of Unity’, was inaugurated in October 2018. It is the
                                                highest standing statue in the world at a height of 182 metres.
                                               It is expected to boost the tourism sector in the country and put India on the world tourism map. In February
     Statue of Unity                            2019, the visiting hours were increased by additional two hours and the place was equipped with E-bike tours.
                                               Over 29 lakh tourists visited the Statue of Unity since it was inaugurated, resulting in a revenue of Rs 82.51
                                                crore (US$ 11.81 million).
 Note: National Mission on Pilgrimage Rejuvenation and Spiritual, Heritage Augmentation Drive
 Source: Union Budget

23      Tourism & Hospitality                                                                             For updated information, please visit www.ibef.org
TOURISM POLICY AND INITIATIVES GIVE A BOOST TO
                  THE INDUSTRY… (1/2)

                                            The Ministry has set up Hospitality Development & Promotion Board to monitor and facilitate hotel project
     Special Boards
                                             clearances/approvals.

                                            In March 2018, Ministry of Tourism initiated State Governments/Union Territory (UT) administrations of India
     Tourist Police                          to deploy tourist police.

                                            In November 2019, Nagaland deployed a separate tourist police.

                                            An investment-linked deduction under Section 35 AD of the Income Tax Act is in place for establishing new
                                             hotels under 2-star category and above across India, thus permitting a 100 per cent deduction in respect of
                                             the whole or any expenditure of capital nature.
     Tax Incentives
                                            In 2019, the Government reduced GST on hotel rooms with tariffs of Rs 1,001 (US$ 14.32) to Rs 7,500 (US$
                                             107.31) per night to 12 per cent and those above Rs 7,501 (US$ 107.32) to 18 per cent to increase India’s
                                             competitiveness as a tourism destination.

                                             Ministry of Tourism launched a 24x7 toll free multilingual tourist information helpline in 12 languages to
                                              provide information related to travel in India.

                                             Ministry of Tourism issued guidelines on Safety and Security for States/UTs along with tips for travelers.
     Safety and Security
                                             Launched social media awareness campaign in the spirit of ‘Atithidevo Bhava’ to develop importance of good
     Initiatives
                                              conduct and behavior towards tourists.

                                             Initiative to conduct constant dialogue with States/UTs for drawing ideas for development and promote
                                              tourism.

 Source: World Travel & Tourism Council, Union Budget 2020 – 21

24     Tourism & Hospitality                                                                             For updated information, please visit www.ibef.org
TOURISM POLICY AND INITIATIVES GIVE A BOOST TO
                  THE INDUSTRY… (2/2)

                                           Assistance in large revenue-generating projects.

     Incentives from Ministry              Support to public private partnerships (PPP) in infrastructure development such as viability gap funding.
            of Tourism                     Under budget 2019-20, Government introduced a Tax Refund for Tourists (TRT) scheme similar to countries
                                            like Singapore to encourage tourists to spend more in India and boost tourism.

                                           Under ‘Project Mausam’, the Government proposed to establish cross cultural linkages and revive historic
     Project Mausam                         maritime cultural and economic ties with 39 Indian Ocean countries. In 2015, the Government linked China
                                            Silk Road project with Project Mausam.

                                           The number of tourists arriving on e-Tourist Visa grew 23.6 per cent y-o-y to 2.36 million in 2019.
     E–tourist Visa                        Foreigners travelling to India on e-Tourist Visa will receive a pre-activated BSNL SIM card loaded with talk-
                                            time and data.

                                           In September 2019, the second session of India Tourism Mart (ITM 2019) was organised. It was a three-day
     India Tourism Mart                     event organised by FAITH (Federation of Associations in Indian Tourism and Hospitality) and the Ministry of
                                            Tourism, Government of India.
     2019
                                           160 exhibitors from across the country came together to interact and transact business.

 Source: World Travel & Tourism Council

25      Tourism & Hospitality                                                                          For updated information, please visit www.ibef.org
CONTINUED GROWTH IN INVESTMENTS IN THE
                   TOURISM SECTOR
      In November 2019, memorandum of understanding (MoU) was signed                  Capital
                                                                                           Visakhapatnam
                                                                                               investments in
                                                                                                            port
                                                                                                              thetraffic
                                                                                                                   tourism
                                                                                                                         (million
                                                                                                                            sectortonnes)
                                                                                                                                    (US$ billion)
       between India and Finland to strengthen co-operation in the field of tourism.
      In November 2019, TAJ opened a new hotel in Tirupati under religious             120.0
                                                                                                                            CAGR 5.33%
       tourism segment.
                                                                                        100.0
      In September 2019, Japan joined the band of Asian countries, which

                                                                                                                                                                                               95.3
       included Taiwan and Korea among others, to enter the Indian tourism               80.0
       market.
                                                                                         60.0
      In August 2019, MakeMyTrip launched an initiative “#MyIndiaMyTrips” to
                                                                                         40.0

                                                                                                                                                                                      47.8
       assist Indian travellers to plan their travel and explore the best of India.

                                                                                                                                                                        36.6
                                                                                                                                                         35.0

                                                                                                                                                                 34.6
                                                                                                 33.7

                                                                                                                            33.0

                                                                                                                                           32.2
                                                                                                                                   31.3
      Hilton plans to add 18 hotels pan India by 2021 along with 15 operational         20.0

                                                                                                                  28.9
                                                                                                        23.8
       hotels under its brands – Hampton, Hilton Garden Inn, Conrad, Hilton Hotels        0.0
       & Resorts and DoubleTree by Hilton.
      As of April 2019, Radisson Hotel Group, a global hospitality firm, had plans
       to double its portfolio of hotel in India to 200 by 2022.
      Oyo Rooms is planning to invest about Rs 1,400 crore (US$ 200 million)            Collective Government spending on tourism (US$
                                                                                           Visakhapatnam port traffic (million tonnes)
       towards capital expenditure, technology and leadership in its Indian and                             billion)
       South Asia business.
                                                                                        6.00
      Indian Hotels Company (IHCL) expanded its portfolio by adding 24 hotels                                              CAGR 7.91%
       with an inventory of over 2,800 keys in FY20.

                                                                                                                                                                                             5.65
                                                                                        5.00
      Amatra Hotels and Resorts, a wholly-owned subsidiary of Amatra Group
       Holdings, and SDN BHD Malaysia plans to increase the number of keys in           4.00
       its Indian properties to 250 by the end of March 2020.
                                                                                        3.00

                                                                                                                                                                               2.89
                                                                                                                                                                 2.61
                                                                                        2.00

                                                                                                                                                  2.31
                                                                                                                                    1.97
                                                                                                                          1.88
                                                                                                           1.76
                                                                                        1.00     1.67

                                                                                        0.00
  Note: E – Estimated, F- Forecast                                                              2012    2013             2014      2015      2016               2017 2018E 2028F
 Source: World Travel & Tourism Council’s Economic Impact 2018, 2017

26       Tourism & Hospitality                                                                     For updated information, please visit www.ibef.org
GROWTH IN ARRIVALS THROUGH E-TOURIST VISA

      In November 2014, the Government introduced e-Tourist Visa to                        Visakhapatnam
                                                                                             Growth in arrivals
                                                                                                            portthrough
                                                                                                                 traffic (million
                                                                                                                          e-Tourist
                                                                                                                                  tonnes)
                                                                                                                                    visa
       facilitate arrival of nationals from 43 countries. As of December 2019,
       the facility was extended to 169 countries.
                                                                                                               CAGR 137.14%
                                                                                 3,500,000
      The e-Tourist Visa is part of e-Visa facility which includes e-Business
       Visa, e-Conference Visa, e-Medical Visa and e-Medical Attendant
       Visa.                                                                     3,000,000

      Tourist arrivals through e-Tourist Visa increased at a CAGR of
       137.14 per cent during 2014-19 to reach 2.93 million tourists in 2019.    2,500,000

      Tourist arrivals through e-Visa stood at 0.83 million in 2020*.
                                                                                 2,000,000

                                                                                 1,500,000

                                                                                 1,000,000

                                                                                                   1,080,000

                                                                                                                1,697,000

                                                                                                                             2,369,941

                                                                                                                                          2,928,303

                                                                                                                                                       837,721
                                                                                  500,000

                                                                                        -
                                                                                                 2016          2017         2018         2019         2020*

 Note: P- Provisional, *-Till March 2020
 Source: Ministry of Tourism

27      Tourism & Hospitality                                                                     For updated information, please visit www.ibef.org
Tourism & Hospitality

OPPORTUNITIES
NICHE SEGMENTS OFFER GOOD OPPORTUNITIES

            Medical tourism                      Cruise tourism                         Rural tourism                            Ecotourism

         The presence of world-class        Cruise is one of the most            The potential for development          India is often termed as the
          hospitals & skilled medical         dynamic & fastest growing             of rural tourism in India is high       hotspot for bio-diversity and its
          professionals makes India a         segments in the global leisure        as most of its population reside        rich   natural     heritage    is
          preferred     destination for       industry.                             in rural areas.                         unparalleled in many ways.
          medical tourism.
                                             Government of India has              This can benefit the local             Such valuable resource base
         India’s earning from medical        estimated that India would            community economically and              gives impetus for the practice
          tourism could exceed US$ 9          emerge with a market size of          socially     and      facilitate        of variety of alternate tourism
          billion by 2020.                    1.2 million cruise visitors by        interaction between tourists            forms & many of which are
                                              2030-31.                              and locals for a mutually               already in existence.
         Tour operators are teaming up
                                                                                    enriching experience.
          with hospitals to tap this         Moreover, India is looking to                                                For example: National parks,
          market.                             take advantage of its 7,500 km                                                wildlife   sanctuaries  and
                                              coastline    to   tap    growth                                               biosphere reserves.
                                              potential of the cruise tourism
                                              segment.

                                             The cruise terminal in Mumbai
                                              has been allocated Rs 1,000
                                              crore (US$ 155.55 million).

                                             India signed a deal of worth
                                              US$ 950 million with Russia for
                                              two upgraded cruises. These
                                              ships are expected to be
                                              delivered by 2022.

 Source: Ministry of Tourism, BMI

29       Tourism & Hospitality                                                                      For updated information, please visit www.ibef.org
LEADING STATES/UTs IN TERMS OF TOURISTS

                                                     Uttar Pradesh – Attracted 288.7 million tourists (14.14 per
                                                     cent) in 2018

                                                     Domestic Tourists: 285.07 million
                                                     Foreign Tourists: 3.78 million
Maharashtra – Attracted 124.27
                                                     Major attractions – Taj Mahal, Agra Fort, Fatehpur Sikri and
million tourists (7.40 per cent) in 2018
                                                     Sarnath
Domestic Tourists: 119.19 million
Foreign Tourists: 5.08 million

Major attractions – Ajanta and Ellora
Caves, Shirdi, Ashtavinayak and
Matheran                                                                  Andhra Pradesh – Attracted 195 million
                                                                          tourists (9.87 per cent) in 2018

                                                                          Domestic Tourists: 194.76 million
                                                                          Foreign Tourists: 0.27 million
Karnataka – Attracted 214.50 million
tourists (10.75 per cent) in 2018

Domestic Tourists: 214.30million
Foreign Tourists: 0.50 million
                                              Tamil Nadu – Attracted 391.97 million tourists (20.84 per cent) in
Major attractions - Mysore Palace,            2018
Hampi, Coorg, and Jog falls
                                              Domestic Tourists: 385.90 million
                                              Foreign Tourists: 6.07 million

                                              Major attractions – Meenakshi Temple, Brihadeeswarar Temple,
                                              Yelagiri Hills, Hogenakkal Falls and Vivekananda Memorial
  Source: Ministry of Tourism

30      Tourism & Hospitality                                   For updated information, please visit www.ibef.org
AIRLINES INDUSTRY SET TO FLY HIGHER

                                           Growth in low-cost airlines is expected to lower tourism cost and increase domestic spending on tourism. Low-
                                            cost flights under Ude Desh ka Aam Naagrik (UDAN) scheme are expected to connect underserved regions in
     Low-cost airlines                      the country and promote domestic tourism.

                                           Under RCS-UDAN scheme, approximately 34,74,000 passengers were flown and 335 routes were awarded
                                            during 2019, covering 33 airports (20 unserved, 3 underserved, 10 water aerodromes).

                                           The market is likely to become more competitive due to the entry of an increasing number of international
     Increase in international              flight operators expected to offer improved services to tourists. JVs such as Air Asia and Tata SIA is already
     flight operators                       serving the Indian skies.

                                           Players like Etihad and Vistara have entered the country in the last few years.

     Increasing number of                   The Airport Authority of India aims to start operating 250 airports across the country by 2020. As of 2019,
     airports                                there were 132 operational airports in India.

                                            In the Union Budget 2018-19, the Government proposed to develop 10 prominent sites into iconic tourist
     Higher investments
                                             destinations.

                                              In FY19, domestic air traffic and International air traffic in India increased 14.1 per cent and 3.4 per cent y-o-y,
     Higher passenger traffic                 respectively. By 2020, passenger traffic at Indian airports is expected to increase to 450 million people.

 Source: World Travel & Tourism Council

31      Tourism & Hospitality                                                                              For updated information, please visit www.ibef.org
Tourism & Hospitality

INDUSTRY
ASSOCIATIONS
INDUSTRY ORGANISATIONS

     Federation of Hotel & Restaurant Associations of India
              Visakhapatnam port traffic (million tonnes)     Hotel Association of India (HAI)
     (FHRAI)
      Address: B-82, 8th Floor, Himalaya House,                Address: B 212–214
      23, Kasturba Gandhi Marg,                                Som Dutt Chamber-I,
      New Delhi – 110001                                       Bhikaji Cama Place,
      Phone: 91-11- 40780780                                   New Delhi – 110 066
      Fax: 91-11- 40780777                                     Phone: 91-11-2617 1110/14
                                                               Fax: 91-11-2617 1115

33     Tourism & Hospitality                                                 For updated information, please visit www.ibef.org
Tourism & Hospitality

USEFUL
INFORMATION
GLOSSARY

      Direct contribution: Spending on accommodation, transportation, attractions and entertainment

      Indirect contribution: Travel and tourism investment spending, and Government collective travel and tourism spending

      Induced contribution: Spending of direct and indirect employees

      GOI: Government of India

      CAGR: Compound Annual Growth Rate

      INR: Indian Rupee

      US$: US Dollar

      Wherever applicable, numbers have been rounded off to the nearest whole number

35      Tourism & Hospitality                                                                      For updated information, please visit www.ibef.org
EXCHANGE RATES

     Exchange Rates (Fiscal Year)                                              Exchange Rates (Calendar Year)

                 Year INR                          INR Equivalent of one US$               Year                  INR Equivalent of one US$

                  2004–05                                    44.95                         2005                             44.11
                  2005–06                                    44.28                         2006                             45.33
                  2006–07                                    45.29                         2007                             41.29
                  2007–08                                    40.24                         2008                             43.42
                  2008–09                                    45.91
                                                                                           2009                             48.35
                  2009–10                                    47.42
                                                                                           2010                             45.74
                  2010–11                                    45.58
                                                                                           2011                             46.67
                  2011–12                                    47.95
                                                                                           2012                             53.49
                  2012–13                                    54.45
                                                                                           2013                             58.63
                  2013–14                                    60.50
                                                                                           2014                             61.03
                  2014-15                                    61.15
                                                                                           2015                             64.15
                  2015-16                                    65.46
                  2016-17                                    67.09                         2016                             67.21

                  2017-18                                    64.45                         2017                             65.12

                  2018-19                                    69.89                         2018                             68.36

                  2019-20                                    70.49                         2019                             69.89

 Source: Reserve Bank of India, Average for the year

36     Tourism & Hospitality                                                                  For updated information, please visit www.ibef.org
DISCLAIMER

     India Brand Equity Foundation (IBEF) engaged TechSci Research to prepare this presentation and the same has been prepared by TechSci
     Research in consultation with IBEF.

     All rights reserved. All copyright in this presentation and related works is solely and exclusively owned by IBEF. The same may not be reproduced,
     wholly or in part in any material form (including photocopying or storing it in any medium by electronic means and whether or not transiently or
     incidentally to some other use of this presentation), modified or in any manner communicated to any third party except with the written approval
     of IBEF.

     This presentation is for information purposes only. While due care has been taken during the compilation of this presentation to ensure that the
     information is accurate to the best of TechSci Research and IBEF’s knowledge and belief, the content is not to be construed in any manner
     whatsoever as a substitute for professional advice.

     TechSci Research and IBEF neither recommend nor endorse any specific products or services that may have been mentioned in this presentation
     and nor do they assume any liability or responsibility for the outcome of decisions taken as a result of any reliance placed on this presentation.

     Neither TechSci Research nor IBEF shall be liable for any direct or indirect damages that may arise due to any act or omission on the part of the user
     due to any reliance placed or guidance taken from any portion of this presentation.

37      Tourism & Hospitality                                                                           For updated information, please visit www.ibef.org
You can also read