Phenotype characteristics of gastric epithelial mucus in patients with different gastric diseases: from superficial gastritis to gastric cancer ...
←
→
Page content transcription
If your browser does not render page correctly, please read the page content below
Phenotype characteristics of gastric
                                     epithelial mucus in patients with
                                     different gastric diseases: from superficial
                                     gastritis to gastric cancer
                                     Nannan Dong1 ,2 ,3 , Rui Guo1 ,2 ,3 , Yuehua Gong1 ,2 ,3 and Yuan Yuan1 ,2 ,3
                                 1
                                   The First Hospital of China Medical University, Key Laboratory of GI Cancer Etiology and Prevention in
                                   Liaoning Province, Shenyang, LiaoNing, China
                                 2
                                   The First Hospital of China Medical University, Tumor Etiology and Screening Department of Cancer
                                   Institute and General Surgery, Shenyang, LiaoNing, China
                                 3
                                   The First Hospital of China Medical University, Key Laboratory of Cancer Etiology and Prevention in
                                   Liaoning Education Department, Shenyang, LiaoNing, China

                                         ABSTRACT
                                         Background. Gastric gland mucin is important for maintaining the basic function of
                                         the gastric mucosa, protecting it from foreign substances and reducing the occurrence
                                         of gastric diseases. Exploring the phenotype of gastric gland mucus changes during the
                                         progression of gastric disease is of great clinical significance.
                                         Methods. A total of 483 patients with different gastric diseases were collected in
                                         this study, including 82 superficial gastritis (SG), 81 atrophic gastritis (AG), 168
                                         dysplasia (GD), and 152 gastric cancer (GC). Mucin staining was performed using HID-
                                         ABpH2.5-PAS method and was further grouped according to the mucin coloration.
                                         Results. The phenotypic characteristics of mucin during disease progression were
                                         divided into neutral, acidic, and mucus-free types. Furthermore, acidic mucus can be
                                         divided into type I, type II, and type III. The SG group was dominated by neutral mucus
                                         (100%), and the AG was dominated by acid mucus (81.48%), which gradually increased
                                         with the severity of atrophy (P < 0.05). The GD and GC groups were dominated by
                                         mucus-free (43.45%, 78.29%), and as the degree of GD worsened, neutral and acidic
Submitted 17 August 2020
                                         mucus gradually decreased and mucus-free increased (P < 0.001). From the SG, AG,
Accepted 2 January 2021
Published 25 February 2021               GD, and GC progression, neutral and acidic mucus gradually decreased, and mucus-
                                         free gradually increased. Acidic mucin revealed that type III (red-brown black) mucin
Corresponding authors
Yuehua Gong, yhgong@cmu.edu.cn           was predominant in AG, GD, and GC, and increased with the degree of AG, GD, as
Yuan Yuan, yuanyuan@cmu.edu.cn           well as the biological behavior of GC. In the lesion adjacent to high-grade GD or GC,
Academic editor                          type III acid mucin is predominant.
Maria Cristina Albertini                 Conclusion. There were three mucin phenotypes in the process of gastric diseases.
Additional Information and               With the disease progression, the trend of phenotypic change was that neutral and
Declarations can be found on             acidic mucus gradually decreased and mucus-free increased. The appearance of type
page 12                                  III mucin suggested a relatively serious phase of gastric diseases and may be a more
DOI 10.7717/peerj.10822                  suitable candidate for follow-up monitoring of patients with GC risk.
    Copyright
2021 Dong et al.
                                     Subjects Gastroenterology and Hepatology, Pathology, Histology
Distributed under                    Keywords Gastric mucus, Gastric disease, HID-ABpH2.5-PAS
Creative Commons CC-BY 4.0

OPEN ACCESS

                                     How to cite this article Dong N, Guo R, Gong Y, Yuan Y. 2021. Phenotype characteristics of gastric epithelial mucus in patients with dif-
                                     ferent gastric diseases: from superficial gastritis to gastric cancer. PeerJ 9:e10822 http://doi.org/10.7717/peerj.10822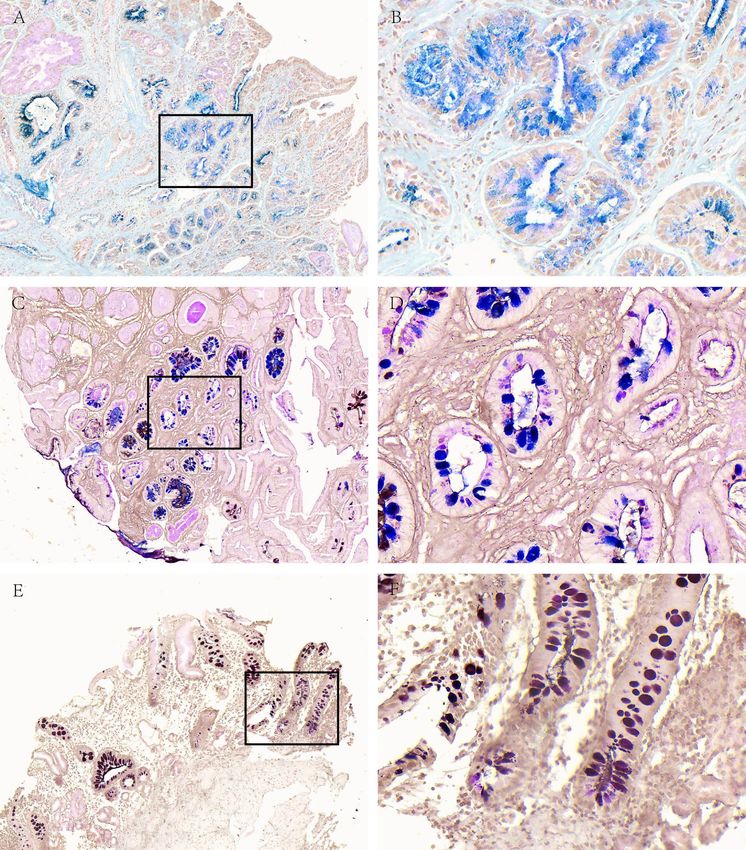
INTRODUCTION
                                   Mucins, a family of large and heavily glycosylated proteins, represent the main component
                                   of this hydrophilic gel-like mixture, and act as key molecules in the maintenance of
                                   gastrointestinal homeostasis (Duarte et al., 2016; Jin et al., 2017) and protect the gastric
                                   mucosa from the damage from external environment (Ota & Katsuyama, 1992; Amieva
                                   & El-Omar, 2008). These mucins are divided into two subtypes: surface mucin and gland
                                   mucin (De Bolos, Garrido & Real, 1995; Teixeira et al., 2002). The former is secreted from
                                   the surface cells of the gastric mucosa, while the latter is located in the lower layer of the
                                   gastric mucosa from the gland mucous cells. The stomach wall covered with surface mucus
                                   will not be directly exposed to the gastric juice environment with strong acid and proteases.
                                   Under normal circumstances, surface mucin can reduce gastric mucosal irritation caused
                                   by food friction, resist pepsin damage to gastric mucosa and reduce H+ penetration to
                                   maintain the mucus-bicarbonate barrier function (Jin et al., 2017). Surface mucus is also
                                   important in drugs absorption process, namely for those that are gastric pH-sensitive (Virili
                                   et al., 2019). Gastric gland mucins are derived from pyloric glands, mucus neck cells, and
                                   fundus gland cells (Robbe et al., 2004). These mucus are important for maintaining the
                                   basic function of the gastric mucosa, protecting against foreign substances, and reducing
                                   the occurrence of gastric diseases (Nakayama, 2014).
                                      The occurrence of GC is due to the chronic inflammation of the gastric mucosa under
                                   the long-term effect of pathogenic factors, which can further cause AG, IM (intestinal
                                   metaplasia), GD and GC (Oue et al., 2019) following the Correa’s Model. Exploring the
                                   changes of mucus phenotype during the above pathological process is of great significance
                                   to reveal the occurrence and development of gastric diseases. It has been reported that
                                   expression and glycosylation of mucins are associated with gastric carcinogenesis including
                                   invasion, proliferation and regulation of tumor cells (Hollingsworth & Swanson, 2004;
                                   Andrianifahanana, Moniaux & Batra, 2006; Betge et al., 2016; Pinho & Reis, 2015). Several
                                   studies have suggested that the type of mucin expressed in early and advanced gastric
                                   carcinomas is of clinical significance, alluding to biologic differences in precursor lesions
                                   and/or pathways of malignant transformation (Ha Kim et al., 2006; Kim et al., 2013; Koseki
                                   et al., 2000; Yamazaki et al., 2006). Accumulating evidence has indicated that different
                                   mucin phenotypes of GC have distinct clinical characteristics and exhibit specific genetic
                                   and epigenetic changes (Oue et al., 2015). Thus, mucin phenotype classification is useful to
                                   understand GC pathogenesis. However, it is not exactly clear how the phenotype of gastric
                                   gland mucus changes during the progression of gastric disease.
                                      In this study, we used AB-PAS mucus staining method to explore the changes of mucus
                                   phenotype during the occurrence and development of gastric diseases, which would provide
                                   clues and help to reveal the occurrence and development of gastric diseases (Oue et al.,
                                   2019).

Dong et al. (2021), PeerJ, DOI 10.7717/peerj.10822                                                                          2/16
MATERIALS AND METHODS
                                   The subjects
                                   A total of 483 patients with different gastric diseases were included in this study, among
                                   them 283 patients underwent gastroscopic biopsy and 118 patients underwent endoscopic
                                   submucosal dissection (ESD) surgery at the Endoscopy Center of the First Affiliated
                                   Hospital of China Medical University from July 2014 to March 2018. In addition, 82 cases
                                   from the on-site GC screening project in Zhuanghe county, Liaoning province from January
                                   2014 to December 2014. They were diagnosed as 82 SG, 81 AG, 168 GD, 152 GC, including
                                   299 males and 184 females, with an average age of 60.25 years old. The H. pylori infection
                                   was detected using ASSURE Hp rapid test (MP DiagnosticsTM ). The histopathological
                                   diagnostic criteria of the subjects referred to the updated Sydney classification system.
                                   This study was approved by the Ethics Committee of the First Affiliated Hospital of China
                                   Medical University, and the subjects signed informed consents ([2013]135 and 2016[161]).

                                   HID-ABpH2.5-PAS mucin histochemical staining
                                   The specific steps of HID-ABpH2.5 PAS mucin histochemical staining followed the
                                   instructions of the kit (kit was purchased from Beijing Regen Biotechnology Co., Ltd.). In
                                   short, after dewaxing to water, the slides were placed in the solution (A1:A2 = 50:3), away
                                   from light for 18–24 h at 24 ◦ C–28 ◦ C. After that, stained with Alcian blue for 20 min, and
                                   next incubated with periodic acid for 30 s, and then schiff reagent was added for 2 min,
                                   and at last the slides were acidified, dehydrated and mounted. Neutral mucus material is
                                   red, acidic mucus material is blue, mixed mucus material is blue-purple or purple-blue,
                                   and the nucleus is brown.

                                   The phenotypes of different acid mucus
                                   In acid mucus, sialic acid mucus is blue, and sulfuric acid mucus is brownish black. Further,
                                   according to the different coloration of acid mucin, the gastric mucosa is divided into type
                                   I (blue or brown-black), type II (red-blue) and type III (red-brown black). If there is more
                                   than one mucus phenotype in the lesion, the most important mucus phenotype is classified.

                                   Statistical analysis
                                   SPSS 16.0 software was used for statistical analysis. P < 0.05 was statistically significant.
                                   The descriptive statistics of continuous variables are mean, standard deviation, minimum
                                   and maximum, while categorical variables are count and percentage. Chi-square test or
                                   Fisher’s exact test were used to determine the statistical association between categorical
                                   variables, and t test was used to determine the statistical association between continuous
                                   variables.

                                   RESULTS
                                   The baseline characteristics of the subjects
                                   A total of 82 SG, 81 AG, 168 GD, and 152 GC were included in this study, the average age
                                   and gender composition of each group were shown in Table 1, of which the SG group was
                                   younger compared with other groups, with statistical significance (P = 0.000). In terms

Dong et al. (2021), PeerJ, DOI 10.7717/peerj.10822                                                                          3/16
Table 1 Baseline characteristics of 483 subjects.
Characteristcs SG AG GD GC P value
Total cases 82 81 168 152
Age (years) 52.09 61.46 61.73 62.39 0.000
Sex (%)
Male 42 (51.22) 46 (56.79) 112 (66.67) 99 (65.13) 0.067
Female 40 (48.78) 35 (43.21) 56 (33.33) 53 (34.87)
of male and female composition, the difference between the groups was not statistically
significant (P = 0.067).
Mucous phenotype characteristics of different gastric diseases
We compared the mucin staining of mucosal tissues in different gastric diseases, as shown in
Table 2 and Fig. 1. Of the total 483 patients, 135 (27.89%), 154 (31.82%), and 195 (40.29%)
were neutral, acidic mucus, and mucus-free respectively. Among them, 100% of the SG
group was neutral mucus. The patients with AG were mainly acid mucus, accounting for
81.48%, followed by neutral mucus accounting for 14.81%, and the difference between the
groups was statistically significant (P = 0.000). The patients with GD were mainly without
mucus (43.45%), followed by acidic mucus (35.12%) and neutral mucus (21.43%), the
difference between the groups was statistically significant (P = 0.000); patients with GC
were similar to patients with GD, and mainly stained without mucus (78.29%), the rest
were neutral mucus (2.63%) and acid mucus (19.08%). The difference between the groups
was statistically significant (P = 0.000).
In the comparison between different disease groups, the expression of neutral mucus
gradually decreased from SG, AG to GD and GC, with a positivity of 100%, 14.81%,
21.43% and 2.63%, respectively, and the difference between the groups was statistically
significant (P = 0.000). The expression of acidic mucus gradually decreased (81.48%,
35.12% and 19.08%) respectively, the difference between the groups was statistically
significant (P = 0.000). Those mucus-free expression gradually increased (3.71%, 43.45%
and 78.29%) respectively, the difference between the groups was statistically significant
(P = 0.000). It can be seen that SG was mainly composed of neutral mucus, AG was
mainly expressed by acidic mucus, and GD and GC tissues were mainly expressed by
mucus-free. With the progress of gastric disease, neutral and acidic mucus expression
gradually decreased, and those without mucus expression gradually increased.
Subgroup analysis of mucous phenotype characteristics of different
gastric diseases
Further, we analyzed mucin staining in different subgroups of AG, GD, and GC. The
results were shown in Table 3. In AG, there was no statistically significant difference
in the percentage of neutral mucus and acid mucus in the antrum, corpus and angle
of stomach (P = 0.874). In mild atrophy, neutral and acid mucus accounted for 33.33
and 53.33%, respectively. The acid mucus of moderate and severe AG were 85.11% and
94.74%, respectively, higher than that of mild AG, and the difference between the groups
Dong et al. (2021), PeerJ, DOI 10.7717/peerj.10822 4/16Table 2 Mucous phenotype characteristics of different gastric diseases.
Diseases Cases Neutral Acidic Non-mucus P value
mucus (%) mucus (%) (%)
Total 483 135 (27.89) 154 (31.82) 195 (40.29)
SG 82 82 (100) 0 0 0.000
AG 81 12 (14.81) 66 (81.48) 3 (3.71) 0.000
GD 168 36 (21.43) 59 (35.12) 73 (43.45) 0.000
GC 152 4 (2.63) 29 (19.08) 119 (78.29) 0.000
P value 0.000 0.000 0.000
Figure 1 Mucous phenotype characteristics of different gastric diseases. (A, B) Representative picture
of neutral mucus (red) in the SG group. (C, D) Representative picture of acid mucus (blue) in the AG
group. (E, F) Representative picture of mucus-free in GC group. A, C and E were made at ×100 magnifi-
cation; B, D and F were magnified images (×400) of the boxed sections depicted at left.
Full-size DOI: 10.7717/peerj.10822/fig-1
Dong et al. (2021), PeerJ, DOI 10.7717/peerj.10822 5/16Table 3 Subgroup analysis of mucous phenotype characteristics of different gastric diseases.
Diseases Cases Neutral Acidic Non-mucus P value
mucus (%) mucus (%) (%)
AG 81 12 (14.81) 66 (81.48) 3 (3.71)
Position
Corpus 15 2 (13.33) 13 (86.67) 0 (0)
Angle 13 2 (15.38) 10 (76.92) 1 (7.69) 0.874
Antrum 53 8 (15.09) 43 (81.13) 2 (3.78)
Degree
Mild 15 5 (33.33) 8 (53.33) 2 (13.34)
Moderate 47 6 (12.77) 40 (85.11) 1 (2.12) 0.020
Severe 19 1 (5.26) 18 (94.74)
GD 168 36 (21.43) 59 (35.12) 73 (43.45)
Low-grade 96 33 (34.38) 48 (50.00) 15 (15.62)
0.000
High-grade 72 3 (4.17) 11 (15.28) 58 (80.56)
GC 152 4 (2.63) 29 (19.08) 119 (78.29)
Intestinal type 78 4 (5.13) 12 (15.38) 62 (79.49)
Diffuse type 46 0 (0) 11 (23.91) 35 (76.09)
0.500
Mixed type 3 0 (0) 1 (33.33) 2 (66.67)
Unclassifiable 25 0 (0) 5 (20.00) 20 (80.00)
was statistically significant (P = 0.02). In the low-grade of GD, neutral, acidic mucus,
mucus-free were 34.38%, 50.00%, 15.62%, and in the high-grade were 4.17%, 15.28%,
80.56%, the difference between the groups was statistically significant (P = 0.000). In GC,
mucus-free was the highest in intestinal-type, followed by diffuse-type, unclassifiable type
and mixed-type, but the difference was not statistically significant (P = 0.5). It can be seen
that in AG, acid mucus gradually increases with the severity of gastric disease, in GD, as the
degree increasing, neutral and acid mucus gradually decreased, and no mucus increased.
Among various histological types of GC, those with no mucus were the highest.
The analysis of mucous phenotype characteristics of different
H. pylori status
Among the AG, GD, and GC samples included in this study, there were 151 patients with
H. pylori infection information. We compared the relationship of H. pylori infection status
and different mucus phenotypes in the overall disease group and among the three disease
groups, respectively. As shown in Table 4, the results indicated that in the overall disease
group, there was no difference in mucus phenotype between the H. pylori positive and
negative groups (P = 0.724). However in AG subgroup, the H. pylori positive group was
mainly acidic mucus type (72.97%), and the H. pylori negative group was mainly neutral
mucus (100%). There was no difference in mucus phenotype between H. pylori positive
and negative groups in GD, GC subgroups (P = 0.879,0.819).
The distribution of acidic mucus phenotype in different diseases
We further conducted a comparative analysis of acidic mucus phenotypes among different
gastric diseases, including AG, GD and GC, as shown in Table 5 and Fig. 2. The results
Dong et al. (2021), PeerJ, DOI 10.7717/peerj.10822 6/16Table 4 Subgroup analysis of mucous phenotype characteristics of different H. pylori status.
Diseases Hp Cases Neutral mucus Acidic mucus Mucus-free P value
(%) (%) (%)
Positive 97 15 (15.46) 41 (42.27) 41 (42.27)
Total 0.724
Negative 53 7 (13.21) 20 (37.73) 26 (49.06)
Positive 37 8 (21.62) 27 (72.97) 2 (5.41)
AG 0.000
Negative 8 8 (100) 0 (0) 0 (0)
Positive 33 6 (18.18) 10 (30.30) 17 (51.52)
GD 0.879
Negative 26 6 (23.08) 8 (30.77) 12 (46.15)
Positive 27 1 (3.71) 4 (14.81) 22 (81.48)
GC 0.819
Negative 19 1 (5.26) 4 (21.05) 14 (73.69)
Table 5 The distribution of acidic mucus phenotype in different diseases.
Diseases Cases Type I Type II Type III P value
(%) (%) (%)
CAG 66 11 (16.67) 10 (15.15) 45 (68.18) 0.000
Position
Corpus 13 0 (0) 2 (15.38) 11 (84.62)
Angle 10 1 (10) 2 (20) 7 (70) 0.348
Antrum 43 10 (23.26) 6 (13.95) 27 (62.79)
Degree
Mild 8 3 (37.5) 1 (12.5) 4 (50)
Moderate 40 5 (12.5) 7 (17.5) 28 (70) 0.505
Severe 18 3 (16.67) 2 (11.11) 13 (72.22)
GD 59 3 (5.08) 12 (20.34) 44 (74.58) 0.000
Low-grade 48 3 (6.25) 12 (25) 33 (68.75)
0.014
High-grade 11 0 (0) 0 (0) 11(100)
GC 29 2 (6.90) 6 (20.69) 21 (72.41) 0.000
Intestinal type 12 0 (0) 3 (25) 9 (75)
Diffuse type 11 0 (0) 2 (18.18) 9 (81.82)
0.091
Mixed type 1 0 (100) 0 (0) 1 (100)
Unclassifiable 5 2 (40) 1 (20) 2 (40)
showed that the acidic mucus phenotype can be further subdivided into three subtypes:
type I, sialic acid or mucin sulfate; type II, neutral and acidic sialic acid mucin, occasionally,
mucin sulfate, or both; type III, neutral and sulfuric acid mucus mainly, occasionally, sialic
acid mucin, or both.
Among 66 cases of AG, there was 11 cases of type I (16.67%), 10 cases of type II (15.15%)
and 45 cases of type III (68.18%); in 59 cases of GD, there was 3 cases of type I (5.08), 12
cases of type II (20.34%) and 44 cases of type III (74.58%); in terms of 29 cases of GC, there
were 2 cases of type I (6.9%), 6 cases of type II (20.69%) and 21 cases of type III (72.41%).
Further stratified according to location and degree in AG, there was no statistically
significant difference in mucin subtype (P = 0.348, P = 0.505). In the 59 cases of GD,
including 48 cases of low-grade and 11 cases of high-grade, type III were the mainly
Dong et al. (2021), PeerJ, DOI 10.7717/peerj.10822 7/16Figure 2 Acidic mucus phenotype in AG. (A, B) Representative picture of type I (blue). (C, D) Repre-
sentative picture of type II (red-blue). (E, F) Representative picture of type III (red-brown black). A, C and
E were made at ×100 magnification; B, D and F were magnified images (×400) of the boxed sections de-
picted in A, C and E.
Full-size DOI: 10.7717/peerj.10822/fig-2
subtype, especially with 100% in the high-grade (P = 0.000). There were 12 cases of
intestinal-type GC and 11 cases of diffuse-type GC with mucin subtype, all of which were
mainly type III, and the difference between the groups was not statistically significant
(P = 0.091).
The comparation of acid mucus phenotypes in the lesion adjacent to
high-grade GD or GC
There were 112 cases of IM nearby the above-mentioned high-grade GD and GC. In order
to further analyze the correlation between different mucus phenotypes and high-grade GD
or GC. As shown in Table 6 and Fig. 3, in high-grade GD, intestinal and diffuse GC, type
Dong et al. (2021), PeerJ, DOI 10.7717/peerj.10822 8/16Table 6 The comparation of acid mucus phenotypes in the lesion adjacent to high-grade GD or GC.
GD/GC Cases Type I (%) Type II (%) Type III (%) P value
High-grade 42 4 (9.53) 3 (7.14) 35 (83.33) 0.000
Intestinal type 49 4 (8.16) 1 (2.04) 44 (89.8)
Diffuse type 13 1 (7.69) 0 (0) 12 (92.31)
0.980
Mixed type 2 0 (0) 0 2 (100)
Unclassifiable 6 1 (16.67) 0 5 (83.33)
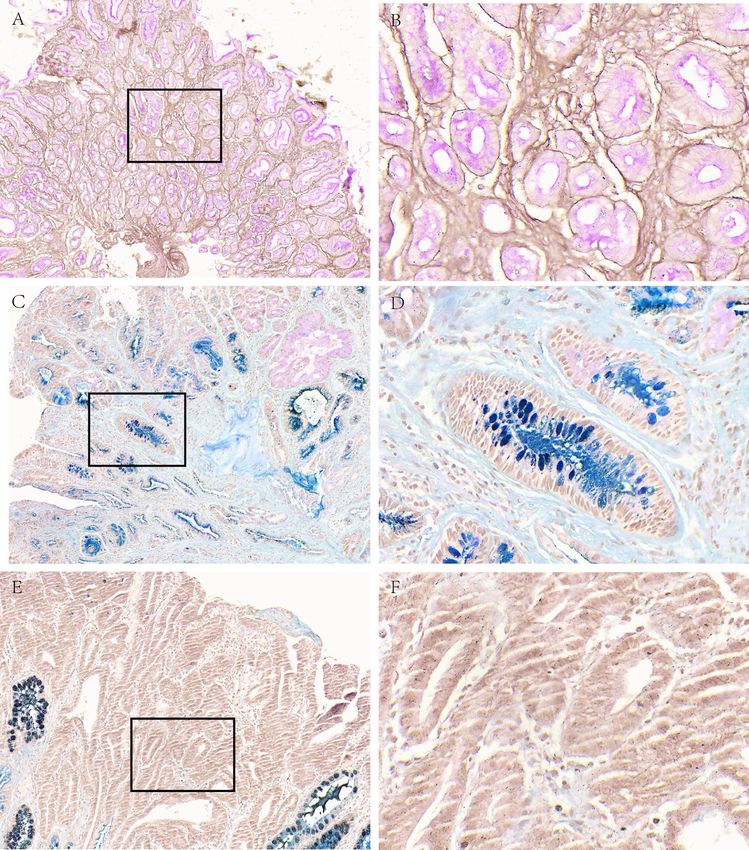
Figure 3 Acid mucus phenotypes in the lesion adjacent to GC. (A, B) Acid mucus of type II can be seen
in the lesion adjacent to GC. (C, D) Acid mucus of type III can be seen in the lesion adjacent to GC. A and
C were made at ×100 magnification; B and D were magnified images (×400) of the boxed sections de-
picted in A and C.
Full-size DOI: 10.7717/peerj.10822/fig-3
III acid mucin is predominant, without statistically significant difference between groups
(P = 0.714).
DISCUSSION
Current research findings suggest that mucin subtypes and clinical relevance are reported
differently in the literature, but most of the data always support that different mucin
subtypes are associated with the risk of intestinal gastric adenocarcinoma (Ha Kim et
al., 2006; Kim et al., 2013; Koseki et al., 2000; Yamazaki et al., 2006). That is to say, the
progression of gastric precancerous lesions to GC is a slow and gradual development
process, at least targeted monitoring can be performed by mucin typing, and there is an
opportunity to detect and remove tumorous lesions early. Although there are currently no
Dong et al. (2021), PeerJ, DOI 10.7717/peerj.10822 9/16clinically deterministic predictive biomarkers in clinical use, the use of mucin staining for
subtype analysis can further stratify people who are already at risk (Hondo et al., 2017). In
this study, we explored the changes of different mucus phenotypes during the progression
of gastric disease.
Usually, the gastric epithelium, pyloric gland, and duodenal gland mainly secrete
neutral mucus (Linden et al., 2008). The goblet cells and intestinal glands of the small
and large intestine mucosa mainly secrete acidic mucus (Reis et al., 1999). Under normal
physiological conditions, the staining of gastric mucin showed red neutral mucin, but in
some pathological conditions, such as IM, carcinogenesis, etc., the characteristics of gastric
mucin staining can change with the specific state. Kazuhiro Yamanoi et al. reported that
the reduction of gastric mucus is related to the high mitotic activity of tumor cells, which
represents an increase in malignant potential (Yamanoi & Nakayama, 2018). The results
of our study showed that in the SG, neutral mucus was dominant, but in AG with IM,
acid mucus was mainly expressed, which produced by intestinal metaplasia glands. In the
GD and GC, it was mainly expressed as mucus-free phenotype. During the progression
of gastric diseases from SG, AG, GD, and GC, the expression of neutral and acidic mucus
gradually decreased, mucus-free expression gradually increased. From this we can speculate
that the disappearance of epithelial mucus phenotype may be one of the high-risk factors
for the progression of gastric disease.
H. pylori persistent infection of the normal gastric mucosa triggers a chronic
inflammatory process designated by chronic gastritis. The presence of virulent H. pylori
strains together with host immune vulnerability can lead to severe mucosal atrophy with
focal loss of gland architecture and disease progression (Correa & Houghton, 2007). In
fact, the development of IM originates multiple foci where superficial foveolar cells with
neutral mucin expression are gradually replaced by acidic producing cells with an intestinal
phenotype (Correa, 1992). In our study, we found in AG subgroup, the H. pylori positive
group was mainly acidic mucus type and the H. pylori negative group was mainly neutral
mucus. There was no difference in mucus phenotype between H. pylori positive and
negative groups in GD, GC subgroups. It was the truth that with the progress of IM,
the colonization of H. pylori gradually decreased, especially in the stage of GC, there was
basically no colonization (Chen et al., 2019), so AG was dominant with acid mucus in H.
pylori positive.
The main feature of intestinal epithelium is acid mucin staining while once IM occurs
in the gastric mucosa, acidic mucin can be shown in gastric epithelium. Acid mucin can be
divided into sialic acid or sulfated mucin, which can be used to evaluate two types using
combined HID-AB staining, and the latter is brown stained with ferric diamine (HID).
Filipe et al. (1994) used this method to distinguish mucin phenotypes: type I expressed
only salivary mucin, type II expressed a hybrid form of a mixture of gastric mucosa and
intestinal mucin, and type III expressed neutral and sulfated mucin. It is still not clear
whether there is a chronological relationship between the expression of these three types
of mucins (Reis et al., 1999; Silva et al., 2002; Gutierrez-Gonzalez & Wright, 2008). During
the initial development of gastric diseases with IM, the neutral mucin in normal mucosa
gradually decreased, while salivary mucin appeared and became the main type of mucin.
Dong et al. (2021), PeerJ, DOI 10.7717/peerj.10822 10/16In the serious stages of IM, sulfate mucin appeared and may become the main ingredient.
In this study, we detected acid mucin in AG, GD, and GC, and found that type III mucin
was the main type in the three types of lesions, and increased with the change of the IM
degree, the GD grade and the biological behavior of GC. In lesion next to high-grade GD,
intestinal-type and diffuse GC, the type III acidic mucin is predominant. The emergence
of type III mucin is a progressive stage of IM, which can become the best candidate for
follow-up monitoring of patients with GC risk. In addition, based on a meta-analysis
of 7 studies, including patients with GIM in 2014 and no accompanying dysplasia (929
patients with type II or III mucin, and 1112 patients with type I mucin), these patients
ranged from 3-12.8 years of GC developed during the follow-up period. Compared with
individuals of type I, the risk of GC was 3.33 times higher (95% confidence interval,
1.96–5.64) (Altayar et al., 2020; Gawron et al., 2020). Consistent with the AGA (American
Gastroenterological Association) guideline (Banks et al., 2019), the recent ESGE (European
Society of Gastrointestinal Endoscopy) guideline also mentioned that mucin staining
has prognostic value, which is contrary to the 2012 ESGE guideline that opposes GIM
subtype guidance for prognosis (Dinis-Ribeiro et al., 2012; Pimentel-Nunes et al., 2019).
Considering the potential prognostic value and the opportunity to generate stronger
clinical and epidemiological evidence, as well as the pathologist’s minimum cost and effort,
recommendations for routine typing of mucin are advisable.
From a histochemical point of view, the pH value of normal gastric mucin is neutral, and
they are dyed red with periodate-Schiff (PAS). Chronic AG is histologically characterized
by chronic inflammation of the gastric mucosa, with decreasing number of gastric gland
cells and increasing intestinal metaplastic glands, therefore acid mucin replaces the original
gastric mucin and gets blue stained with pH 2.5 Alcian blue. Therefore, AB-PAS combined
staining can distinguish normal epithelium with IM. Recently, the expression profile of
different mucins has been analyzed with antibodies. MUC5AC, MUC6, MUC2, and CD10
have been found to be specifically expressed in the gastric foveolar epithelium, pyloric gland
cells, goblet cells, and brush border, respectively (Kim et al., 2013). However, this antibody
staining method cannot further distinguish GI mixed type mucin into salivary mucin
and sulfated mucin, that is, it cannot distinguish between type II and type III. Moreover,
compared with antibody staining, the HID-AB-PAS method is more time-saving, efficient,
and cheaper and cost-effective.
However, the current study was limited that although we have seen the dynamic
changes of gastric mucus phenotype during the progression of gastric disease, whether
the disappearance of mucus phenotype is ‘‘cause’’ or ‘‘effect’’, the conclusions are not
consistent, and further study is needed in the future such as functional assays with relevant
study models (cell lines, mice. . . ). Although we found that H. pylori positive and negative
groups have different dominant mucus phenotype, however, in AG, GD, GC subgroups,
the difference was not obvious. And due to the limitation of the number of cases, we did
not further analyze the acidic mucus subtypes between H. pylori status, which has yet to be
further studied.
In summary, this study explored the phenotype of gastric gland mucus changes during
the progression of gastric disease and found that the disappearance of mucus phenotype
Dong et al. (2021), PeerJ, DOI 10.7717/peerj.10822 11/16is one of the high-risk factors for the progression of gastric diseases. The appearance of
type III mucin is a relatively serious phase of gastric diseases and may be a more suitable
candidate for follow-up monitoring of patients with GC risk. In China, there is currently
still no effective method for clinical management and prognosis follow-up of patients
with IM and dysplasia. With the continuous improvement of our understanding of mucin
typing, the expansion of research samples and the increasing awareness of clinicians, we
will get more evidence to support, continue to improve our clinical management of GIM
and dysplasia patients, and ultimately improve the early detection rate of GC and reduce
its mortality.
ADDITIONAL INFORMATION AND DECLARATIONS
Funding
This work was supported by the National Natural Science Foundation of Liaoning Province
(2019-MS-388). The funders had no role in study design, data collection and analysis,
decision to publish, or preparation of the manuscript.
Grant Disclosures
The following grant information was disclosed by the authors:
National Natural Science Foundation of Liaoning Province: 2019-MS-388.
Competing Interests
The authors declare there are no competing interests.
Author Contributions
• Nannan Dong performed the experiments, prepared figures and/or tables, authored or
reviewed drafts of the paper, and approved the final draft.
• Rui Guo analyzed the data, prepared figures and/or tables, and approved the final draft.
• Yuehua Gong conceived and designed the experiments, analyzed the data, prepared
figures and/or tables, authored or reviewed drafts of the paper, and approved the final
draft.
• Yuan Yuan conceived and designed the experiments, analyzed the data, authored or
reviewed drafts of the paper, and approved the final draft.
Human Ethics
The following information was supplied relating to ethical approvals (i.e., approving body
and any reference numbers):
Our study was approved by the Ethics Committee of the First Affiliated Hospital of
China Medical University (approval number: [2013]135) and (ethics numbers 2016[161]).
Data Availability
The following information was supplied regarding data availability:
Raw data, including mucous phenotype characteristics of different gastric diseases and
acidic mucus phenotype in CAG and in the lesion next to GC, are available as Supplemental
File.
Dong et al. (2021), PeerJ, DOI 10.7717/peerj.10822 12/16Supplemental Information
Supplemental information for this article can be found online at http://dx.doi.org/10.7717/
peerj.10822#supplemental-information.
REFERENCES
Altayar O, Davitkov P, Shah SC, Gawron AJ, Morgan DR, Turner K, Mustafa RA. 2020.
AGA technical review on gastric intestinal metaplasia-epidemiology and risk factors.
Gastroenterology 158(3):732–744 e716 DOI 10.1053/j.gastro.2019.12.002.
Amieva MR, El-Omar EM. 2008. Host-bacterial interactions in Helicobacter pylori
infection. Gastroenterology 134(1):306–323
DOI 10.1053/j.gastro.2007.11.009.
Andrianifahanana M, Moniaux N, Batra SK. 2006. Regulation of mucin expression:
mechanistic aspects and implications for cancer and inflammatory diseases. Biochim-
ica et Biophysica Acta/General Subjects 1765(2):189–222.
Banks M, Graham D, Jansen M, Gotoda T, Coda S, Di Pietro M, Uedo N, Bhandari P,
Pritchard DM, Kuipers EJ, Rodriguez-Justo M, Novelli MR, Ragunath K, Shepherd
N, Dinis-Ribeiro M. 2019. British Society of Gastroenterology guidelines on the
diagnosis and management of patients at risk of gastric adenocarcinoma. Gut
68(9):1545–1575 DOI 10.1136/gutjnl-2018-318126.
Betge J, Schneider NI, Harbaum L, Pollheimer MJ, Lindtner RA, Kornprat P, Ebert
MP, Langner C. 2016. MUC1, MUC2, MUC5AC, and MUC6 in colorectal cancer:
expression profiles and clinical significance. Virchows Archiv 469(3):255–265
DOI 10.1007/s00428-016-1970-5.
Chen XH, Wang A, Chu AN, Gong YH, Yuan Y. 2019. Mucosa-associated microbiota
in gastric cancer tissues compared with non-cancer tissues. Frontiers in Microbiology
10:1261 DOI 10.3389/fmicb.2019.01261.
Correa P. 1992. Human gastric carcinogenesis: a multistep and multifactorial process–
first American cancer society award lecture on cancer epidemiology and prevention.
Cancer Research 52(24):6735–6740.
Correa P, Houghton J. 2007. Carcinogenesis of Helicobacter pylori. Gastroenterology
133(2):659–672 DOI 10.1053/j.gastro.2007.06.026.
De Bolos C, Garrido M, Real FX. 1995. MUC6 apomucin shows a distinct normal tissue
distribution that correlates with Lewis antigen expression in the human stomach.
Gastroenterology 109(3):723–734 DOI 10.1016/0016-5085(95)90379-8.
Dinis-Ribeiro M, Areia M, Vries AC, Marcos-Pinto R, Monteiro-Soares M, O’Connor
A, Pereira C, Pimentel-Nunes P, Correia R, Ensari A, Dumonceau JM, Machado
JC, Macedo G, Malfertheiner P, Matysiak-Budnik T, Megraud F, Miki K, O’Morain
C, Peek RM, Ponchon T, Ristimaki A, Rembacken B, Carneiro F, Kuipers EJ,
European Society of Gastrointestinal E, European Helicobacter Study G, European
Society of P, Sociedade Portuguesa de Endoscopia D. 2012. Management of precan-
cerous conditions and lesions in the stomach (MAPS): guideline from the European
Dong et al. (2021), PeerJ, DOI 10.7717/peerj.10822 13/16Society of Gastrointestinal Endoscopy (ESGE), European Helicobacter Study Group
(EHSG), European Society of Pathology (ESP), and the Sociedade Portuguesa de
Endoscopia Digestiva (SPED). Endoscopy 44(1):74–94 DOI 10.1055/s-0031-1291491.
Duarte HO, Freitas D, Gomes C, Gomes J, Magalhaes A, Reis CA. 2016. Mucin-Type
O-Glycosylation in gastric carcinogenesis. Biomolecules 6(3):33
DOI 10.3390/biom6030033.
Filipe MI, Munoz N, Matko I, Kato I, Pompe-Kirn V, Jutersek A, Teuchmann S,
Benz M, Prijon T. 1994. Intestinal metaplasia types and the risk of gastric can-
cer: a cohort study in Slovenia. International Journal of Cancer 57(3):324–329
DOI 10.1002/ijc.2910570306.
Gawron AJ, Shah SC, Altayar O, Davitkov P, Morgan D, Turner K, Mustafa RA. 2020.
AGA technical review on gastric intestinal metaplasia-natural history and clinical
outcomes. Gastroenterology 158(3):705–731 e705 DOI 10.1053/j.gastro.2019.12.001.
Gutierrez-Gonzalez L, Wright NA. 2008. Biology of intestinal metaplasia in 2008: more
than a simple phenotypic alteration. Digestive and Liver Disease 40(7):510–522
DOI 10.1016/j.dld.2008.02.029.
Ha Kim G, Am Song G, Youn Park D, Han Lee S, Hyun Lee D, Oh Kim T, Jae Jo H, Heo
J, Hwan Kang D, Cho M. 2006. CDX2 expression is increased in gastric cancers
with less invasiveness and intestinal mucin phenotype. Scandinavian Journal of
Gastroenterology 41(8):880–886 DOI 10.1080/00365520500497140.
Hollingsworth MA, Swanson BJ. 2004. Mucins in cancer: protection and control of the
cell surface. Nature Reviews Cancer 4(1):45–60 DOI 10.1038/nrc1251.
Hondo FY, Kishi H, Safatle-Ribeiro AV, Pessorrusso FCS, Ribeiro U, Maluf-Filho F.
2017. Characterization of the mucin phenotype can predict gastric cancer recurrence
after endoscopic mucosal resection. Arquivos de Gastroenterologia 54(4):308–314
DOI 10.1590/s0004-2803.201700000-38.
Jin C, Kenny DT, Skoog EC, Padra M, Adamczyk B, Vitizeva V, Thorell A, Venkatakr-
ishnan V, Linden SK, Karlsson NG. 2017. Structural diversity of human gastric
mucin glycans. Molecular & Cellular Proteomics 16(5):743–758
DOI 10.1074/mcp.M117.067983.
Kim DH, Shin N, Kim GH, Song GA, Jeon TY, Kim DH, Lauwers GY, Park DY. 2013.
Mucin expression in gastric cancer: reappraisal of its clinicopathologic and prognos-
tic significance. Archives of Pathology and Laboratory Medicine 137(8):1047–1053
DOI 10.5858/arpa.2012-0193-OA.
Koseki K, Takizawa T, Koike M, Ito M, Nihei Z, Sugihara K. 2000. Distinction of
differentiated type early gastric carcinoma with gastric type mucin expression. Cancer
89(4):724–732
DOI 10.1002/1097-0142(20000815)89:43.0.CO;2-4.
Linden SK, Sutton P, Karlsson NG, Korolik V, McGuckin MA. 2008. Mucins in the
mucosal barrier to infection. Mucosal Immunol 1(3):183–197
DOI 10.1038/mi.2008.5.
Dong et al. (2021), PeerJ, DOI 10.7717/peerj.10822 14/16Nakayama J. 2014. Dual roles of gastric gland mucin-specific O-glycans in prevention of
gastric cancer. Acta Histochemica et Cytochemica 47(1):1–9
DOI 10.1267/ahc.13034.
Ota H, Katsuyama T. 1992. Alternating laminated array of two types of mucin in
the human gastric surface mucous layer. Histochemical Journal 24(2):86–92
DOI 10.1007/BF01082444.
Oue N, Sentani K, Sakamoto N, Uraoka N, Yasui W. 2019. Molecular carcinogen-
esis of gastric cancer: Lauren classification, mucin phenotype expression, and
cancer stem cells. International Journal of Clinical Oncology 24(7):771–778
DOI 10.1007/s10147-019-01443-9.
Oue N, Sentani K, Sakamoto N, Yasui W. 2015. Clinicopathologic and molecular
characteristics of gastric cancer showing gastric and intestinal mucin phenotype.
Cancer Science 106(8):951–958 DOI 10.1111/cas.12706.
Pimentel-Nunes P, Libanio D, Marcos-Pinto R, Areia M, Leja M, Esposito G, Garrido
M, Kikuste I, Megraud F, Matysiak-Budnik T, Annibale B, Dumonceau JM, Barros
R, Flejou JF, Carneiro F, Van Hooft JE, Kuipers EJ, Dinis-Ribeiro M. 2019. Man-
agement of epithelial precancerous conditions and lesions in the stomach (MAPS
II): European Society of Gastrointestinal Endoscopy (ESGE), European Helicobacter
and Microbiota Study Group (EHMSG), European Society of Pathology (ESP),
and Sociedade Portuguesa de Endoscopia Digestiva (SPED) guideline update 2019.
Endoscopy 51(4):365–388 DOI 10.1055/a-0859-1883.
Pinho SS, Reis CA. 2015. Glycosylation in cancer: mechanisms and clinical implications.
Nature Reviews Cancer 15(9):540–555 DOI 10.1038/nrc3982.
Reis CA, David L, Correa P, Carneiro F, Bolos Cde, Garcia E, Mandel U, Clausen H,
Sobrinho-Simoes M. 1999. Intestinal metaplasia of human stomach displays distinct
patterns of mucin (MUC1, MUC2, MUC5AC, and MUC6) expression. Cancer
Research 59(5):1003–1007.
Robbe C, Capon C, Coddeville B, Michalski JC. 2004. Structural diversity and specific
distribution of O-glycans in normal human mucins along the intestinal tract.
Biochemical Journal 384(Pt 2):307–316 DOI 10.1042/BJ20040605.
Silva E, Teixeira A, David L, Carneiro F, Reis CA, Sobrinho-Simoes J, Serpa J, Veerman
E, Bolscher J, Sobrinho-Simoes M. 2002. Mucins as key molecules for the classi-
fication of intestinal metaplasia of the stomach. Virchows Archiv 440(3):311–317
DOI 10.1007/s004280100531.
Teixeira A, David L, Reis CA, Costa J, Sobrinho-Simoes M. 2002. Expression of mucins
(MUC1, MUC2, MUC5AC, and MUC6) and type 1 Lewis antigens in cases with
and without Helicobacter pylori colonization in metaplastic glands of the human
stomach. The Journal of Pathology 197(1):37–43 DOI 10.1002/path.1083.
Virili C, Antonelli A, Santaguida MG, Benvenga S, Centanni M. 2019. Gas-
trointestinal malabsorption of thyroxine. Endocrine Reviews 40(1):118–136
DOI 10.1210/er.2018-00168.
Dong et al. (2021), PeerJ, DOI 10.7717/peerj.10822 15/16Yamanoi K, Nakayama J. 2018. Reduced alphaGlcNAc glycosylation on gastric gland
mucin is a biomarker of malignant potential for gastric cancer, Barrett’s adenocar-
cinoma, and pancreatic cancer. Histochemistry and Cell Biology 149(6):569–575
DOI 10.1007/s00418-018-1667-8.
Yamazaki K, Tajima Y, Makino R, Nishino N, Aoki S, Kato M, Sakamoto M, Moro-
hara K, Kaetsu T, Kusano M. 2006. Tumor differentiation phenotype in gastric
differentiated-type tumors and its relation to tumor invasion and genetic alterations.
World Journal of Gastroenterology 12(24):3803–3809
DOI 10.3748/wjg.v12.i24.3803.
Dong et al. (2021), PeerJ, DOI 10.7717/peerj.10822 16/16You can also read