Towards Understanding Cyberbullying Behavior in a Semi-Anonymous Social Network
←
→
Page content transcription
If your browser does not render page correctly, please read the page content below
Towards Understanding Cyberbullying Behavior in a
                                                Semi-Anonymous Social Network

                                                               Homa Hosseinmardi, Richard Han,                                      Amir Ghasemianlangroodi
                                                                 Qin Lv and Shivakant Mishra                                  Department of Electrical, Computer and
                                                             Department of Computer Science                                            Energy Engineering
                                                             University of Colorado at Boulder                                  University of Colorado at Boulder
                                             {homa.hosseinmardi,richard.han,qin.lv,shivakaht.mishra}@colorado.edu             amir.ghasemianlangroodi@colorado.edu
arXiv:1404.3839v2 [cs.SI] 21 Aug 2014

                                            Abstract—Cyberbullying has emerged as an important and            on such social networks as Youtube, Formspring, MySpace,
                                        growing social problem, wherein people use online social networks     and Twitter [10]–[12]. [10] investigated both explicit and
                                        and mobile phones to bully victims with offensive text, images,       implicit cyberbullying by analyzing negative text comments
                                        audio and video on a 24/7 basis. This paper studies negative          on Youtube and Formspring profiles. [11] investigates how
                                        user behavior in the Ask.fm social network, a popular new site        integration of MySpace user profile information like gender
                                        that has led to many cases of cyberbullying, some leading to
                                                                                                              in addition to text analysis can improve the accuracy of
                                        suicidal behavior. We examine the occurrence of negative words in
                                        Ask.fm’s question+answer profiles along with the social network       cyberbullying detection in social networks [12] tries to detect
                                        of “likes” of questions+answers. We also examine properties of        bullying in Twitter text data by looking for inappropriate
                                        users with “cutting” behavior in this social network.                 words using a Naive Bayes classifier. They track potential
                                                                                                              bullies, their followers and the victims. All of these works
                                                                                                              focused on text-based analysis of negative words, and did not
                                                              I.   I NTRODUCTION                              exploit social network relationships in their investigation of
                                            One of the most pressing problems in high schools is              cyberbullying.
                                        bullying. However, with today’s technology, bullying is moving            Previous work [13] has considered characterizing the lan-
                                        beyond the schoolyards via cell phones, social networks, online       guage model of MySpace users, though the emphasis was not
                                        video and images, etc. As bad as fighting and bullying were           on negative word usage. Our work seeks to understand whether
                                        before the prevalence of personal technology, the recording           social network relationship information can be useful in sup-
                                        and posting of hurtful content has magnified the harmful reach        plementing purely text-based analysis in helping to identify
                                        of bullying. On average, 24% of high school students have             negative user behavior in social networks. We are interested
                                        been the victim of cyberbullying [1]. Cyberbullying happens           in building graphs from social networks and analyzing their
                                        in many different ways, including: mean, negative and hurtful         properties to extract features such as in-degree or out-degree
                                        comments, pictures or videos posted online or on cell phones,         that may be useful in flagging such bad behavior.
                                        or through the spread of rumors or threats via technology.
                                                                                                                  In particular, this paper chooses to focus on analyzing the
                                            Although cyberbullying may not cause any physical dam-            Ask.fm social network for the following key reasons. First,
                                        age initially, it has potentially devastating psychological effects   Ask.fm is a major source of cyberbullying on the Internet. In
                                        like depression, low self-esteem, suicide ideation, and even          fact, it ranks as the fourth worst site in terms of percentage
                                        suicide [2], [3]. For example, Phoebe Prince, a 15 year old           of young users bullied according to a recent survey [14], after
                                        high school girl, committed suicide after being cyberbullied          Facebook, YouTube and Twitter. Second, very little research
                                        by negative comments in the Facebook social network [4].              has been published to date concerning the Ask.fm social net-
                                        Hannah Smith, a 14 year old, hanged herself after negative            work. Third, Ask.fm is a highly popular and rapidly growing
                                        comments were posted on her Ask.fm page, a popular social             social network, with over 70 million registered users as of
                                        network among teenagers [5]. Cyberbullying is such a serious          August 2013 [15]. Finally, Ask.fm provides publicly accessible
                                        problem that nine suicides have been linked with cyberbullying        data.
                                        on the Ask.fm Web site alone [6]. Cyberbullying was viewed
                                        as a contributing factor in the death of these teenagers [1].             One of our big challenges in analyzing the Ask.fm social
                                        Given the gravity of the problem and its rapid spread among           network is that it behaves as a semi-anonymous social network.
                                        middle and high school students, there is an immediate and            User profiles are public, but postings to each profile by users
                                        pressing need for research to understand how cyberbullying            other than the owner are by default anonymous. In addition,
                                        occurs today, so that techniques can be rapidly developed to          we cannot obtain from the public profiles which users are
                                        accurately detect, prevent, and mitigate cyberbullying.               following which other users. As a result, it is not possible for
                                                                                                              us to construct a social graph based on friendships. However,
                                            While most current studies have focused on the prevalence         we observe that another type of graph called an interaction
                                        and impact of cyberbullying in education and psychology [7]–          graph [16] can be extracted from the “likes” of comments. We
                                        [9], our interest is in understanding how social networks are be-     use this insight to build and analyze interaction graphs that
                                        ing used to enable cyberbullying. Prior work in cyberbullying         embed social relationship information, to help identify negative
                                        analysis and detection in social networks has largely focused         user behavior in this semi-anonymous social network.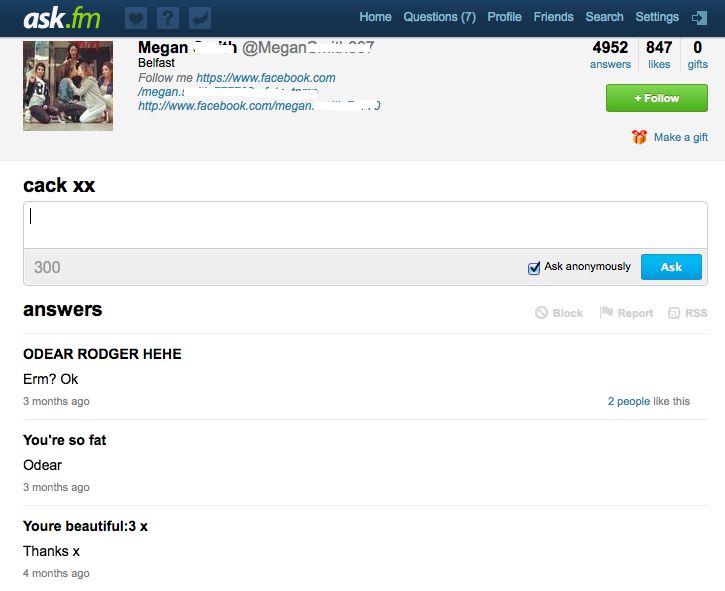
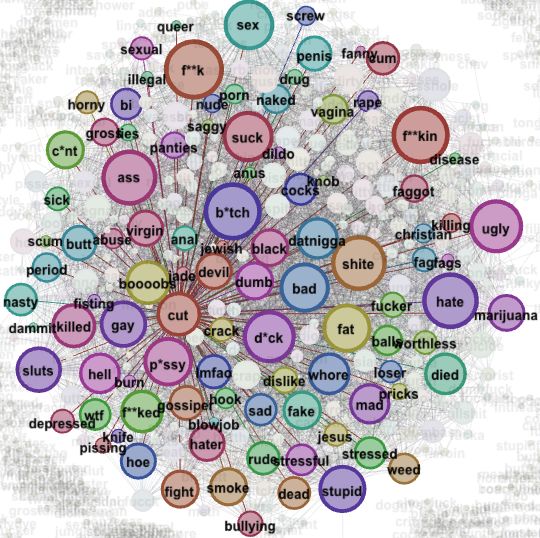
Fig. 1. Typical public profile on Ask.fm with questions/comments (usually   Fig. 2. An example of anonymous cyberbullying comments posted on a
anonymous) to the profile owner and answers from the profile owner.         user’s profile in Ask.fm.

     This paper makes the following contributions. It is the                of a question or comment is usually done anonymously (in
first paper to to provide a detailed characterization of key                fact, that is the default).
properties of the important Ask.fm semi-anonymous social
network. Second, it builds and analyzes interaction and word                    There are some policies specific to Ask.fm. First, only the
graphs and finds that properties of the interaction graph such              target user may post an answer to a question/comment on this
as in-degree and out-degree are strongly related to the amount              site. Only after answering a question will the question and
of negative user behavior expressed on a profile, i.e. highly               answer appear on his/her profile. Further, a user may choose to
positive profiles exhibit the highest degree of sociability in              “like” at the granularity of a question+answer pair, but cannot
terms of liking others and being liked by others, whereas                   like the question nor the answer individually. Liking is non-
profiles with a high number of negative questions exhibit the               anonymous, so that the identity of the likers is publicly known.
lowest degree of sociability.                                               Another feature of Ask.fm is that users may follow other users.
                                                                            However, this relationship data is not available publicly and
    In the following, we describe our data collection efforts,              only the profile owner knows who he/she is following. Even the
build graphs of users’ “likes” as well as negative word graphs,             user who is being followed can only know how many followers
and use these to illustrate the relationship between negative               he/she has (which is not publicly available to other users), not
words and user activity. We also analyze a particularly high                who is following him/her.
risk set of users who state on their profile that they have “cut”
themselves.                                                                     Figure 1 shows a typical publicly accessible profile ob-
                                                                            tained from the Ask.fm social Web site. We see that other
                                                                            users may post questions/comments on a target user’s profile,
                     II.   DATA C OLLECTION                                 and that the target user may answer each question/comment.
                                                                            In this example, we see both a negative comment “You’re so
   In this section, we discuss key aspects of the Ask.fm                    fat” mixed in with a positive comment “You’re beautiful”. A
social network, what information was collected from Ask.fm’s                more serious example of cyberbullying from the Ask.fm Web
publicly accessible profiles, e.g. questions, answers, and likes,           site is shown in Figure 2, where we observe that anonymous
and our process of building interaction and word graphs.                    negative comments have been repeatedly posted on the target’s
                                                                            profile wishing or threatening death upon the target’s father.
A. Ask.fm
    We observe that Ask.fm is generally an example of a semi-               B. Description of Collected Data
anonymous social network, in that the identity of users who                      The data we can extract from a common profile includes
post questions/comments to a profile is typically anonymous                 the following fields: userID, personal information (if any, as
(though posters may choose to reveal their identity, we have                it is optional), total number of answers, total number of likes,
seen this happen only rarely), whereas the identity of the target           content of answered questions posted on a user’s page, and the
user is publicly known. People can search Ask.fm users via                  userID of people who liked the questions+answers.
their name, id or email address. This is unlike non-anonymous
social networks such as Facebook and Twitter, where the                         An interaction graph can be constructed from the “likes” of
identity or ID of posters and target users are both publicly                answered questions, i.e. each directed edge in the graph con-
visible. Thus, in Ask.fm, any one (even people without an                   nects user i to neighbor j if user i has liked a question+answer
account) may post on another user’s profile, and this posting               pair in j’s profile. Note that the edges are not bidirectional,
6
so that i liking an question+answer on j’s profile does not 10
imply j liking one of i’s question+answer. In order to extract
this interaction graph from Ask.fm, we conducted a breadth-
Number of likes
4
10
first search starting from a couple of random seed nodes. Seed
nodes should have non-zero liked question+answer pairs. For
each seed node we found all nodes that liked an answered 2
10
question on its page (incoming edges are publicly known for
each profile). However by only looking at a user’s profile, we 0
are not privy to any of the nodes that this profile owner liked 10 0 1 2 3 4 5
10 10 10 10 10 10
(outgoing edges). In the second step, we collect the profile Number of answered questions
information of all neighbors of the seed node. These steps are
then repeated. Ultimately, the outgoing edges from a profile Fig. 4. Total number of likes versus total number of answered questions a
user receives
can be reconstructed from the incoming edges of other profiles.
Note that because we’re crawling profiles using breadth-first
search, we can only find that subset of the outgoing edges for questions is larger than 50, the correlation between the number
each profile that happen to be incoming edges on other crawled of likes and the number of answered questions increases to
profiles. The only way to find all outgoing edges for each 0.33. This means that as the number of question+answer pairs
profile is to crawl the entire Web site, which is impractical. increases beyond around 50, the number of likes becomes
Since the breadth-first search is terminated before crawling all weakly related to the number of answered questions.
profiles, then this is called snowball sampling, and results in
an interaction graph wherein all the internal nodes have been C. Modeled Interaction Network
fully crawled or sampled, but also a typically small fraction of
nodes on the edge that have not yet been crawled. Our analysis The preceding analysis provided a general overview of
below focuses only on fully sampled nodes in the interaction likes and answered questions in Ask.fm, but we are more
graph. Using snowball sampling, 30K profiles were crawled interested in likes and answered questions in the context of
from October to December 2013. cyberbullying. Our search for cyberbullying on the Ask.fm is
based on the insight that repetitive negative words represent
To provide some general context, we first perform an the core of the abusive text posted on profiles. Following
analysis of the total number of question+answer pairs and the occurrence of negative words led us to many examples
likes per Ask.fm user. We observe they both have heavy tail of cyberbullying. However, after a preliminary analysis of
distributions in Figure 3. The total number of likes has a the answers by the profile owner, we found that many such
heavier tail than the total number of question+answer pairs. examples seemed to have no effect on the targeted user, namely
Looking at the tail, we observe that as the total number of based on the answers the target seemed indifferent to the
answered questions in a user profile increases, the total number negative comments. In contrast, there were other more serious
of likes also grows, Figure 4. The red line is the best fit cases where the target seemed particularly vulnerable, making
obtained through linear regression in the transformed (log- statements like “you broke me” (See Figure 2).
log) space. It seems when a user is more popular and active,
they receive more questions, and more user visits and likes on Looking at the profiles, we observed that the users who
his/her page. Also pushing a like button is easier than writing seemed most vulnerable to negative questions were often those
a question, which makes the number of likes larger than the who were most isolated, with few “likes” and also rarely liking
number of questions. others’ comments. In contrast, users who were subject to but
seemingly indifferent to negative questions appear to have a
CCDF of number of likes and answered questions in 30K user profiles
10
0
fair number of likes and also seemed somewhat active in liking
others’ comments.
−1
10
Based on these two observations that (i) cyberbullying is
−2
10 the behavior of posting questions with negative words and (ii)
Pr(X ≥ k)
−3
vulnerable targets of cyberbullying (based on their answers)
10
seem isolated, we sought to build and analyze social graphs
10
−4 like and word graphs derived from our data that would capture the
question
negativity and isolation of users.
−5
10 0 2 4 6
10 10 degree k 10 10 In order to capture the greatest degree of interaction be-
tween the users, we collected the top 15 questions for each user
Fig. 3. Probability that the total number of likes and question+answer pairs that had the highest number of likes. For some users with very
for a user is greater than or equal to k low activity, the number of highest liked questions was less
than 15. Analyzing the most popular questions of profiles, we
Figure 4 describes the correlation between the number of
have built our network modeled as a directed bipartite network.
answered question+answer pairs and the number of likes. The
In order to build our graph, if user i likes a question+answer
correlation value when the number of answered questions is
in the page of user j, then there is a link from i to words on
less than 50 is -0.05. This shows that when the number of
that question and a link from those words to node j.
answered questions in a user page is low, the number of people
who like these users does not have any special relation with the From this bipartite graph, we seek to derive characteristics
number of answered questions. When the number of answered that can highlight the negativity and isolation associated withAverage number of answers per user 14.5
targeted users. In order to project a bipartite network with Average number of negative questions per user 0.778
adjacency matrix B, to the network of words W , we have Average number of positive questions per user 4.57
W = BB T . Then we can similarly build the network of users Average number of negative words per user 1.04
Average number of positive words per user 5.42
with adjacency matrix U from our bipartite network. That is, TABLE II. AVERAGE NUMBER OF QUESTIONS AND WORDS PER USER
based on this data, our idea is to build and use a like-based
interaction graph between users (U ) and examine the balance
of in-degree vs out-degree of the users with high degree of
negativity in their pages and small number of positive posts; We found that 46.0% have at least one question including
such users have both low in-degree and low out-degree in graph one of the top negative words. We term such a question a
terminology. In contrast, users who received on average the “negative” question. Furthermore, 7.74% of the users have at
same amount of negativity but have positive questions at the least three questions with top negative words, and 96.0% users
same time, show healthier in-degree and out-degree. had at least one question with a top positive word in their
profiles. We term such a question a “positive” question. Table
II shows the average number of positive and negative questions
D. Extracting Positive and Negative Words
and words per user.
We next consider which negative words are pertinent to our By a one mode projection of the bipartite graph, we were
analysis of negative user behavior. The natural approach is to able to obtain the like-based interaction graph U between these
select those negative words that have the highest frequency in 30K users in the Ask.fm social network. In the adjacency
the sampled profiles. However, we observe that it is the collec- matrix U , created from the users’ interaction graph, edges are
tive effect of negative words that is exploited by cyberbulliers. weighted. In fact the weight of each edge eij , from node
Negative words that may be commonly used but more in i to node j is a vector [n1 n2 ], where n1 is the number of
isolation rather than in a collective fashion would be less likely questions in node j including at least one negative word (from
to create a strong effect of cyberbullying. Therefore, we sought our selected dictionary) and n2 is the number of questions with
to create a word graph that measures the relationship between no negative word liked by node i. Since we are most interested
words, i.e. are they being used together on the same profile in negative behavior, we group positive and neutral behavior
to bully a victim. By one mode projection from a bipartite together into a “non-negative” category.
graph comprised of 30K users and a dictionary of around 1500
negative words (obtained from [17]), we constructed a word For further analysis, we have divided matrix U into two
graph wherein each word signifies a node in the graph and matrices Uneg and Unon−neg , where Uneg (negative adja-
each edge indicates that the two words have been used in the cency matrix) is the adjacency matrix with weights n1 and
same profile. Unon−neg (non-negative adjacency matrix) is the adjacency
matrix with weights n2 . Figure 5 shows the CCDF for the
We found that there is a cluster of connected negative in-degree and out-degree distribution of matrices Uneg and
words in the center of the word graph, but there are also Unon−neg . Authors in [18] show that in-degree and out-degree
many negative words that were not connected to any word. distributions in social networks are approximately the same.
Out of 1500 words, the eigenvector centrality of 968 words We can see from Figure 5 the in-degree and out-degree for
is zero, which means 968 negative words either have not non-negative degree distribution is approximately the same for
been seen in any profile or have not been seen together in non-negative degree distributions. However, the negative in-
a profile. These words were eliminated from our analysis. degree and negative out-degree distributions of the interaction
The top row of table I shows the remaining negative words graphs clearly differ, indicating that negative behavior in the
that had the highest frequency of appearance. The second Ask.fm semi-anonymous social network has different properties
row of Table I shows the negative words with the highest than previously reported in other social networks.
eigenvector centrality. Though there is a fair degree of overlap
with the highest frequency words, we note that the sets do 0
CCDF
10
indeed differ. Since eigenvector centrality captures to some non−Negative outdegree
extent the collective negativity of cyberbullying, we focused −1
10
Negative outdegree
non−Negative indegree
our word graph analysis below on the 80 negative words Negative indegree
with eigenvector centrality values larger than 0.5. A similar −2
10
Pr(K>=k)
approach was followed for a collection of 1000 positive words.
80 positive words with highest eigenvector centrality were −3
10
chosen for the following analysis.
−4
10
III. N ETWORK S TATISTICS −5
10 0 1 2 3 4 5
10 10 10 10 10 10
A. Building the Interaction Graph degree k
We collected and analyzed about 30K profiles that had a Fig. 5. Complementary cumulative distribution function for negative and
complete list of likes, using the snowball sampling method, non-negative interaction graphs/matrices.
gathering the top 15 most liked questions. We found that there
were on average 14.5 most liked questions per user, that is most Figure 6 shows the percentage of common users among
users had close to 15 questions with likes. We also focused on x% highest in-degree and x% highest out-degree. In fact this
a collection of 80 negative words and 80 positive words with figure shows whether the users with high out-degree are the
the highest eigenvector centrality as explained previously. same people with high in-degree. Authors in [18] show inhoe n**ga stupid slut kill p**sy cut suck gay fat sex bad d**k die ugly s**t
f**k ass bitch s**t hate d**k ugly sex bad suck p**sy fat gay stupid die kill
TABLE I. T HE FIRST ROW SHOWS THE NEGATIVE WORDS WITH THE HIGHEST FREQUENCY AND THE SECOND ROW SHOWS THE NEGATIVE WORDS WITH
THE HIGHEST EIGENVECTOR CENTRALITY ( VALUES DECREASE FROM LEFT TO RIGHT ).
1 Again we observe that the relationship between in-degree and
0.9
out-degree in Ask.fm is weaker than what was found for prior
Overlap of in−degree and out−degree subsets
social networks and is stronger than the Web.
0.8
0.7 The mean reciprocity of the interaction graph/matrix U
Ask.fm
0.6 Flickr is 28.2%, which is a low number compared to other social
0.5
Web
graphs like Yahoo! 360 with reciprocity 84% and Flickr with
reciprocity 68%, [19]. However Twitter has a more similar
0.4
structure to Ask.fm (in the sense that there is no friendship
0.3
concept between users) and has an even lower reciprocity equal
0.2 to 22.1% [19]. Ask.fm’s network negative reciprocity is a very
0.1 low 3.61%, which shows how much users like each others’
0
0.1 0.2 0.3 0.4 0.5 0.6 0.7 0.8 0.9 1
negative questions. This gives an insight that users who both
Fraction of users with highest in−degree and out−degree have negative posts do not tend to like each others’ negative
questions. Reciprocity between non-negative questions is a far
Fig. 6. Percentage of common users among two subsets of x% highest in- higher 27.9%.
degree and x% highest out-degree. Measurements for Flicker and Web have
been obtained from [18] 0.8 0.8
mean non−Negative reciprocity
0.7 0.7
mean Negative reciprocity
0.6
0.6
social networks for users with 1% highest in-degree and out- 0.5
0.5
degree, more than 60% of users are common. This value is less 0.4
0.4
than 20% for the Web. Here we observe that Ask.fm’s semi- 0.3
0.3
0.2
anonymous social network exhibits behavior that is between 0.2
0.1
previously analyzed social networks and the Web. Overlap of 0.1 0 0 0
1 2 3
the users with 1% highest in-degree and out-degree is more 10 10 10
non−Negative outdegree k
10 10
1
10
2
10
Negative outdegree k
3
10
than 20% and less than 30%. It seems the correlation between
in-degree and out-degree in an interaction graph built from
like-based interactions is much less than the correlation in Fig. 8. Reciprocity for non-negative and negative interaction graphs/matrices
friendship-based social graphs. Friendship is usually a symmet-
ric relation. However, in like-based interactions symmetry is Figure 8 shows the mean reciprocity for the two
less probable, which causes less correlation between in-degree graphs/matrices Uneg and Unon−neg versus out-degree. It
and out-degree. In addition, there is the ambiguity in Ask.fm as shows that in normal (non-negative) behavior the more active
to whether a like is for a question or answer. This decreases the a user is, the more he/she will receive likes from other users
correlation between in-degree and out-degree because we do or vice versa. On the other hand, the mean reciprocity does
not know whether the liker is liking the question as a support not increase with out-degree in the negative matrix. When the
of the question’s content or the answer to support the profile negative out-degree is high, this means that a user is active
owner. and likes others user’s negative questions. However this type
of active user receives a low negative in-degree in return. We
consider two likely possibilities that explain this result. First,
the user is supportive and popular, liking answered questions
often to show support for the answerer of a negative question.
Due to the lack of liking granularity in Ask.fm, this like is
recorded as a like of a negative question, even though the
intent of the user was to like the answer. Indeed, we found
cases on Ask.fm where a profile owner asked a liker why they
liked a negative question, and the liker responded that in fact
they were liking the profile owner’s response instead. Such a
supportive user would be unlikely to receive many negative
questions on their profile. Alternatively, the user is a bully and
unpopular, frequently liking other’s negative questions, and not
Fig. 7. Cumulative distribution function for ratio of out-degree to in-degree.
Measurements for Flicker and Web have been obtained from [18] receiving many likes of negative questions in return. Again,
we see that negative behavior follows a different pattern than
non-negative behavior.
Figure 7 shows the CDF for the ratio of out-degree to in-
degree. It has been shown in [18] that for social networks Next, we explore the relationship between the degree
more than 50% of users have in-degree within 20% of their of negativity (and positivity) on a profile and the profile’s
out-degree. However in the Ask.fm this value is around 16%. graph properties. We compute the average number of negativequestions in a set of profiles with negative questions that the earlier. Note the in-degree has two subcategories, pertaining
profile owner answers to show his/her unhappiness about the to negative in-degree and non-negative in-degree, i.e. a user X
questions. For example, as we saw in Figure 2, the profile will have a negative in-degree if another user likes one of the
owner says “you broke me again” in response to repeated questions posted on X’s profile that has a negative word in it,
negative questions. The average number of negative questions while another user liking a question without a negative word
in 150 profiles of this type was 2.87 and therefore we chose will count towards the non-negative in-degree of X. Similarly,
a threshold of 3 negative questions to define negative groups. out-degree has negative and non-negative subcategories.
In fact, we segmented the user base into 4 different groups:
From Table III, a key finding is that HN users are dis-
1) Highly Negative: users with at least 3 negative posts tinguished by having the smallest total (negative plus non-
and no positive posts (HN) negative) in-degree and the smallest total out-degree. It shows
2) Highly Positive: users with more than 10 positive they are either not popular in terms of being liked or do
posts (HP) not tend to have activity in this social network in terms of
3) Positive-Negative: users with at least 3 negative posts liking others. That is, the high degree of negativity that these
and more than 4 positive posts (PN) users are subject to is related to less sociable behavior on this
4) Others (OTR) social network. Our results indicate that we could leverage
low total in-degree and low total out-degree of Ask.fm’s
The definition of these groups helps us identify the prop- interaction graph to suggest a greater likelihood of determining
erties of the most negative profiles, namely the HN users who highly negative profiles of cyberbullying victims on this semi-
have no positive support, while also allowing us to contrast anonymous social network.
them with the graph properties of other users who have some
or a lot of positive words in support. They were chosen based Another major finding is that as the amount of positive
on our observations that targets of negative behavior could support increases, we find a greater in-degree and greater
be roughly divided into a group that receives support from out-degree of the users, that is users become more social and
bystanders and a group that has been left alone and doesn’t actively like and are liked more often. This is demonstrated
receive any support with positive posts. Figure 9 shows an first by the PN group, which like the HN group has at least
example of a mixed profile with both positive and negative 3 negative posts, but the PN group also has positive support.
comments, representative of the PN group. We observe that the PN group has increased activity in terms
of about twice the amount of total in-degree and total out-
degree as the HN group. Highly positive HP profiles exhibit
the highest sociability in terms of actively liking other profiles
and being liked by other profiles. We see that the total in-
degree and the total out-degree are both over 100, which is
much higher than the second nearest group OTHR, which has
a total in-degree and out-degree around 70 each. This confirms
the trend that higher positivity is strongly related to higher
sociability on Ask.fm’s interaction graph.
An interesting result of this analysis is that we can distin-
guish the HN group from the PN group not merely by the total
in-degree and total out-degree, but also by just the negative in-
degree. We see that the negative in-degree of HN is 6.39, while
PN’s negative in-degree is 14.0, over twice as large. While
the mean number of negative questions is the same in both
HN and PN, i.e. about 3, why would there be so many more
likes for the same number of negative questions for the PN
group? The explanation for this lies again we believe with the
Fig. 9. An example of a profile with both positive and negative comments.
limited granularity of liking in Ask.fm. In the case of liking a
question+answer pair, where the question/comment is negative
and the answer is positive, then it would not be clear whether
HN HP PN OTHR
Negative reciprocity 0.131 0 0.106 0.066
a user is liking a bullier’s negative comment or supporting a
Non-Negative reciprocity 0.210 0.379 0.246 0.339 positive answer from the target of bullying. The higher volume
Negative in-degree 6.39 0 14.0 2.16 of likes of negative questions we believe is actually users liking
non-Negative in-degree 21.1 112 49.4 70.1
Negative out-degree 3.48 2.73 3.73 3.59 the target’s positive response. This agrees with an examination
non-Negative out-degree 32.8 117 46.0 70.1 of a variety of examples, where we saw that the likes were
Total number of likes 1027 5995 1765 2906 mostly representative of support and a positive sign in this
Ratio of likes per answer 1.59 2.58 1.94 2.73
TABLE III. AVERAGE RECIPROCITY AND DEGREE FOR DIFFERENT case.
GROUPS
We also observe that HP users have little interaction with
negative posts. That is, their negative out-degree is clearly
Table III summarizes some of the key results of our lower than any of the other three groups. That means that not
graph analysis. We measure the average reciprocity of the only do HP users not have negative questions posted on their
four different groups, as well as the in-degree and out-degree, profiles, but HP users spend very little effort liking negative
based on the interaction graphs Uneg and Unon−neg calculated questions on other users’ profiles, focusing the vast majority oftheir effort on liking positive questions. Looking at negative IV. U SERS WITH C UTTING B EHAVIOR
reciprocity, it is clear that HP has negative reciprocity 0 as
it does not have any negative in-degree. In the group OTHR One of the most disturbing behaviors that we encountered
it seemed that there existed either a set of users with 1 or 2 was the problem of “cutting” (slicing one’s wrists). Looking
negative questions without any limitation on the positive posts, at the profiles of these cases and studying their answers, it
or a set of users with more than 2 negative questions and seemed that the profile owner exhibited weak confidence and
less than 10 positive questions. However, the average number depression problems, sometimes admitting to earlier failed
of negative questions is 0.774, which shows we have mostly attempts at suicide. In this section we first found 150 profiles
users belonging to the first set. We see that the reciprocity for which their owners have explicitly expressed the experience
on negative questions in this group is lower than the HN of “cutting” behavior and label them. A human labeled the
and PN groups. The reason is either because they have few profile as “cutting” behavior if and only if the profile owner
negative questions compared to the HN and HP groups (which has expressed explicitly in his/her answers that he/she has had
in average have less), or they have less support (they have such an experience. We observe in Figure 11 that among the
in average 4.76 positive questions compared to 6.53 positive words that the word “cut” has been connected to are the words
questions for the HP group). “depress”, “stressful”, “sad”, and “suicide” . This association
could be used to detect these type of users.
In order to calculate the local clustering coefficient for each
node we first turned our network into a simple graph. It means
either node i has liked node j’s question, or node j has liked
node i’s question, regardless of the number of likes. We set
Uij = 1 and Uji = 1, otherwise Uij = Uji = 0. We make
this assumption that either user i receives a like from user
j or posts a like on his/her profile, they are in the general
category of having some familiarity or “connectedness”. The
expected clustering coefficient of the network is 0.11 and the
averaged local clustering coefficient 0.356, as defined in [20].
Comparing with numbers reported by [21], shown in Table IV,
the clustering coefficient of Ask.fm is pretty small. In Figure
10 the local clustering as a function of degree has been de-
picted. As we expect, the local clustering coefficient decreases
when the degree increases in social networks. Looking
at the clustering coefficient of each group in Table V, we
observe that among 4 defined groups, HN has the highest mean
local clustering coefficient despite having the lowest degree,
while the group HP with highest degree has the lowest mean
local clustering. The implication is that users of the HN group
probably have a few people that know each other. However,
users of the HP group are very social and know many people,
and therefore the proportion of their friends that know each
other is small. In general, we can see each group that has Fig. 11. Word usage with the word “cut” in Ask.fm. The size of the circle
higher degree has lower mean local clustering. indicates Eigenvector Centrality score
HN HP PN OTHR The frequency of negative words used with “cut” has been
0.499 0.237 0.380 0.357 shown in Figure 12. We can see these user profiles have two
TABLE V. L OCAL CLUSTERING COEFFICIENT FOR DEFINED GROUP
peaks at words “ugly” and “f**k”.
Frequency of negative words per profile
Mean Fractional Clustering Coefficient
X: 2
0.8 Y: 0.7558 0.5
0.4
0.7
f**k
0.3
0.6 ugly
0.2 hate
0.5 kill
0.1
sad suicude die
Ck
0.4
0
0 10 20 30 40 50 60 70 80
0.3 Negative words
0.2 Fig. 12. Frequency of negative words seen with word ”cut”.
0.1
0
Table VI illustrates the statistics of the labeled users for
0 200 400 600
k
800 1000 1200 1400 “cutting” behavior. We found that such profiles have positive
questions close to PN profiles however the average number of
Fig. 10. Mean local clustering coefficient versus degree
negative posts is less by a factor 0.65 compared to the PN and
HN groups. This suggests surprisingly but encouragingly thatsocial media Ask.fm Facebook Twitter Gplus Flickr Orkut You Tube
Clustering Coefficient 0.356 0.606 0.565 0.490 0.313 0.171 0.136
TABLE IV. L OCAL CLUSTERING COEFFICIENT FOR SOME SOCIAL NETWORKS . C LUSTERING COEFFICIENT VALUES FOR F LICKR , O RKUT AND YOU
T UBE ARE FROM PAPER [18] AND VALUES FOR FACEBOOK , T WITTER , G PLUS ARE FROM THE WEBSITE [21].
Average number of questions per user 15
Average number of negative questions per user 2.31 able to use the interaction graph’s in-degree and out-degree as
Average number of positive questions per user 5.29 an indicator of the extent of negativity or positivity on a given
Average number of negative words per user 3.38 profile. (3) The negative in-degree and negative out-degree do
Average number of positive words per user 6.65
TABLE VI. AVERAGE NUMBER OF QUESTIONS AND WORDS PER USER not exhibit similar behavior, unlike the similarity of in-degree
WITH “ CUTTING ” LABEL and out-degree found in other social networks. (4) Finally,
our analysis of cutting behavior on Ask.fm reveals that such
profiles have surprisingly high positive support, and exhibit a
different signature than the other group segments studied.
these profiles do receive more support and less negative posts
compared to general HN users. Our initial analysis of cyberbullying on Ask.fm has uncov-
ered a plethora of future research directions. We hope to design
Table VII shows the statistics of the average reciprocity, classifiers to detect cyberbullying and evaluate their accuracy
in-degree and out-degree for cutting victims. Though we orig- and false positives/negatives over the general user population
inally expected this group to exhibit behavior similar to the on Ask.fm. Another way to improve detecting victims is
HN group, we found instead that this cutting group appears to looking at the answers in addition to the question. Here by
exhibit collectively a different behavior than the HN, HP, PN, not inspecting the content of the answers, we are potentially
and OTHR groups measured in Table III. The in-degree is 1.5 missing useful information. Answers give us further insight
times more than PN’s in-degree and the out-degree is also more on when a behavior received from other users starts to disturb
by a factor of 1.4. In fact total in-degree and out-degree is more the profile owner. Also, we have only looked at the top 15
similar to the group OTHR, though there is a marked difference liked questions. We can extend this to all questions, and also
in negative in-degree compared to OTHR. This group has investigate the role of the most recently posted questions on
an average number of negative and positive questions most a user’s page. We further intend to conduct a more extensive
closely related to PN profiles. However, it receives more sampling of Ask.fm, obtaining a larger set of profile data from
likes (higher in-degree), and exhibits more activity (higher this social network. We would like to investigate in more detail
out-degree) compared to PN groups. This deserves further the characteristics of high risk cutting victims to ease their
investigation to explain the reasons behind the differences. identification. In order to determine the effect of anonymity
users with “cutting” label
on the degree of negativity in user behaviors, we intend to
Negative reciprocity 0.146 compare the semi-anonymous social network Ask.fm with non-
Non-Negative reciprocity 0.248 anonymous social networks.
Negative in-degree 17.9
non-Negative in-degree 78.7
Negative out-degree 4.42 ACKNOWLEDGMENT
non-Negative out-degree 65.0
TABLE VII. AVERAGE RECIPROCITY AND DEGREE FOR USERS WITH
“ CUTTING ” LABEL
We wish to acknowledge financial support for this research
from the US National Science Foundation (NSF) through grant
CNS 1162614.
V. C ONCLUSIONS AND F UTURE W ORK
R EFERENCES
As far as we are aware, this paper is the first to present [1] J. W. Patchin, “Cyberbullying Research Center:Research summary
a detailed analysis of user behavior in the Ask.fm social net- (2004-2013),” 2013, [accessed 14-January-2014]. [Online]. Available:
work. We analyzed nearly 30K profiles of Ask.fm users using http://cyberbullying.us/data-posts/
interaction graphs, word graphs, and frequency distributions, [2] S. Hinduja and J. W. Patchin, “Cyberbullying research summary,
and characterized key properties such as reciprocity, clustering cyberbullying and suicide,” 2010.
coefficient, and the influence of negativity on in-degree and [3] A. N. E. Menesini, “Cyberbullying definition and measurement. some
out-degree. Some of the key findings of the work are that critical considerations,” Journal of Psychology, vol. 217, no. 4, pp. 320–
323, 2009.
(1) When people have highly negative profiles without any
positive support, they also have the lowest activities in terms [4] R. Goldman, “Teens indicted after allegedly taunting girl
who hanged herself, bbc news,” 2010, [accessed 14-January-
of both in-degree and out-degree, that is they are the least 2014]. [Online]. Available: http://abcnews.go.com/Technology/TheLaw/
sociable. (2) As the amount of positive support increases, we teens-charged-bullying-mass-girl-kill/story?id=10231357
find a greater in-degree and greater out-degree of the users, [5] L. Smith-Spark, “Hanna smith suicide fuels calls for action
that is users become more social and actively like and are on ask.fm cyberbullying, cnn,” 2013, [accessed 14-January-
liked more often. For example, users with negative profiles 2014]. [Online]. Available: http://www.cnn.com/2013/08/07/world/
europe/uk-social-media-bullying/
that also receive positive support have higher in-degree and
out-degree than owners of highly negative profiles that lack [6] R. Broderick, “9 teenage suicides in the last year were linked to
cyber-bullying on social network ask.fm,” 2013, [accessed 14-January-
positive support, that is they are more sociable. When people 2014]. [Online]. Available: http://www.buzzfeed.com/ryanhatesthis/
have highly positive profiles, then they also have the highest a-ninth-teenager-since-last-september-has-committed-suicide
in-degree and out-degree, which shows that they socialize the [7] R. K. P. W. Agatston and S. Limber, “Students’ perspectives on cyber
most on this social network. This suggests that we may be bullying,” Journal of Adolescent Health, 2007.[8] A. Schrock and D. Boyd, “Problematic youth interaction online: Solici-
tation, harassment, and cyberbullying,” Computer-Mediated Communi-
cation in Personal Relationships, 2011.
[9] H. Vandebosch and K. V. Cleemput, “Defining cyberbullying: A qual-
itative research into the perceptions of youngsters,” CyberPsychology
and Behavior, 2008.
[10] C. H. H. L. K. Dinakar, B. Jones and R. Picard, “Common sense
reasoning for detection, prevention, and mitigation of cyberbullying,”
ACM Trans. Interact. Intell. Syst., vol. 2, no. 3, pp. 18:1–18:30, Sep.
2012.
[11] M. Dadvar, F. M. G. de Jong, R. J. F. Ordelman, and R. B. Trieschnigg,
“Improved cyberbullying detection using gender information,” in Pro-
ceedings of the Twelfth Dutch-Belgian Information Retrieval Workshop
(DIR 2012), Ghent, Belgium. Ghent: University of Ghent, February
2012, pp. 23–25.
[12] S. K. H. Sanchez, “Twitter bullying detection,” ser. NSDI’12. Berkeley,
CA, USA: USENIX Association, 2012, pp. 15–15.
[13] S. W. J. Caverlee, “A large-scale study of myspace: Observations and
implications for online social networks,” ser. In Proceedings from the
2nd International Conference on Weblogs and Social Media (AAAI),
2008.
[14] D. the Label-Anti-Bullying Charity, “The annual cyberbullying
survey 2013.” [Online]. Available: http://www.ditchthelabel.org/
annual-cyber-bullying-survey-cyber-bullying-statistics/
[15] “Ask.fm wikipedia page,” 2014, [accessed 14-January-2014]. [Online].
Available: http://en.wikipedia.org/wiki/Ask.fm
[16] C. Wilson, A. Sala, K. P. N. Puttaswamy, and B. Y. Zhao, “Beyond
social graphs: User interactions in online social networks and their
implications,” ACM Trans. Web, vol. 6, no. 4, pp. 17:1–17:31, Nov.
2012.
[17] N. words list, “Negative words list form, luis von ahn’s research group,”
2014. [Online]. Available: http://www.cs.cmu.edu/∼biglou/resources/
[18] A. Mislove, M. Marcon, K. P. Gummadi, P. Druschel, and B. Bhat-
tacharjee, “Measurement and analysis of online social networks,” in
Proceedings of the 7th ACM SIGCOMM Conference on Internet Mea-
surement, ser. IMC ’07. New York, NY, USA: ACM, 2007, pp. 29–42.
[19] H. Kwak, C. Lee, H. Park, and S. Moon, “What is twitter, a social
network or a news media?” in Proceedings of the 19th International
Conference on World Wide Web, ser. WWW ’10. New York, NY,
USA: ACM, 2010, pp. 591–600.
[20] M. E. J. Newman, “Networks, an introduction,” published by Oxford.
[21] J. McAuley and J. Leskovec, “Stanford network analysis project,”
http://snap.stanford.edu/data/egonets-Facebook.html, 2012, [accessed
14-January-2014].You can also read