Investor Presentation - July 2020 Presenting: Elizabeth Austerberry - Chief Executive Greg Taylor - Executive Director Finance & Corporate ...
←
→
Page content transcription
If your browser does not render page correctly, please read the page content below
Investor
                                                       Presentation
                                                       July 2020

Presenting:
Elizabeth Austerberry – Chief Executive
Greg Taylor – Executive Director Finance & Corporate Services
Disclaimer
The information contained in this investor presentation (the “Presentation”) has been prepared to assist interest parties in making their own evaluation of Moat Homes
Finance PLC (the “Issuer”). This presentation and the offering of bonds of the Issuer (the “Bonds”) is believed to be in all material respects accurate, although it has not
been independently verified by the Issuer and does not purport to be all-inclusive. This presentation and its contents are strictly confidential, are intended for use by the
recipient for information purposes only and may not be reproduced in any form or further distributed to any other person or published, in whole or part, for any purpose.
Failure to comply with this restriction may constitute a violation of applicable securities laws. By reading this Presentation, you agree to be bound by the following
limitations. Neither the Issuer nor any of its representative directors, officers, board members, managers, agents, employees or advisers makes any representations or
warranty (express or implied) or accepts any responsibility as to or in relation to the accuracy or completeness of the information in this Presentation (and no one is
authorised to do so on behalf of any of them) and (save in the case of fraud) any liability in respect of such information or any inaccuracy therein or omission therefrom is
hereby expressly disclaimed, in particular, if for reasons of commercial confidentiality information on certain matters that might be of relevance to a prospective purchaser
has not been included in this Presentation.

No representations or warranty is given as to the achievement or reasonableness of any projections, estimates, prospects or returns contained in this Presentation or any
other information. Neither the Issuer nor any other person connected to it shall be liable (whether in negligence or otherwise) for any direct, indirect or consequential loss
or damage suffered by any person as a result of relying on any statement in or omission from this Presentation or any other information and any such liability is expressly
disclaimed. This Presentation includes certain statements, estimate and projections prepared and provided by the management of the Issuer with respect to its anticipated
future performance. Such statements, estimates and projections reflect various assumptions by the Issuer’s management concerning anticipated results and have been
included solely for illustrative purposes. No representations are made as to the accuracy of such statements, estimates or projections or with respect to any other
materials herein. Actual results may vary from the projected results contained herein.

The Bonds have not been and will not be registered under the U.S. Securities Act 1933, as amended (the “Securities Act”), or the laws of any state or other jurisdiction of
the United States, and may not be offered or sold within the United States, or for the account or benefit of, U.S. Persons (as such terms are defined in the Regulation S
under the Securities Act), absent registration or an exemption form, or in a transaction not subject to, the registration requirements of the Securities Act and applicable
state laws. This Presentation is made to and is directed only at persons who are (a) “Investment professionals” as defined under Article 19 of the Financial Services and
Markets Act 2000 (Financial Promotion) Order 2005, as amended (the “Order”) or (b) high net worth entities falling within Article 49(2)(a) to (d) of the Order (all such
persons together being referred to as “relevant persons”). Any person who is not a relevant person should not act or rely in this Presentation or any of its contents. Any
investment or investment activity to which this Presentation relates is available only to and will only be engaged in with such relevant persons.

This information presented herein is an advertisement and does not comprise a prospectus for the purposes of Regulation (EU) 2017/1129 (the “Prospectus Regulation”)
and/or Part VI of the Financial Services and Markets Act 2000. This Presentation does not constitute or form part of, and should not be construed as, an offer to sell, or the
solicitation or invitation of any offer to buy or subscribe for, Bonds in any jurisdiction or an inducement to enter into investment activity. No part of this Presentation, nor
the fact of its distribution, should form the basis of, or be relied on in connection with, any contract or commitment or investment decision whatsoever. Any purchase of
the Bonds should be made solely on the basis of the final offering circular to be prepared, which will contain the definitive terms of the transactions described herein and
be made public in accordance with the Prospectus Regulation and investors may obtain a copy of such final document form the National Storage Mechanism.
The distribution of this Presentation and other information in connection with the Bonds in certain jurisdictions may be restricted by law and persons into whose
possession this Presentation or any document or other information referred to herein comes should inform themselves about and observe any such restrictions. Any
failure to comply with these restrictions may constitute a violation of the securities laws of any such jurisdiction. This Presentation and any materials distributed in
connection with this Presentation are not directed to, or intended for distribution to or use by, any person or entity that is a citizen or resident or located in any locality,
state, country or other jurisdiction where such distribution, publication, availability or use would be contrary to law or regulation or which would require any registration or
licensing within such jurisdiction. The Issuer does not accept any liability to any person in relation to the distribution or possession of this presentation in or from any
jurisdiction.                                                                                2

Table of Contents

   Introduction & Overview   4

   Governance & Strategy     8

   Our People                17

   Our Performance           19

   Development & Sales       24

   Financial Performance     29

   Treasury                  32

   Summary                   35

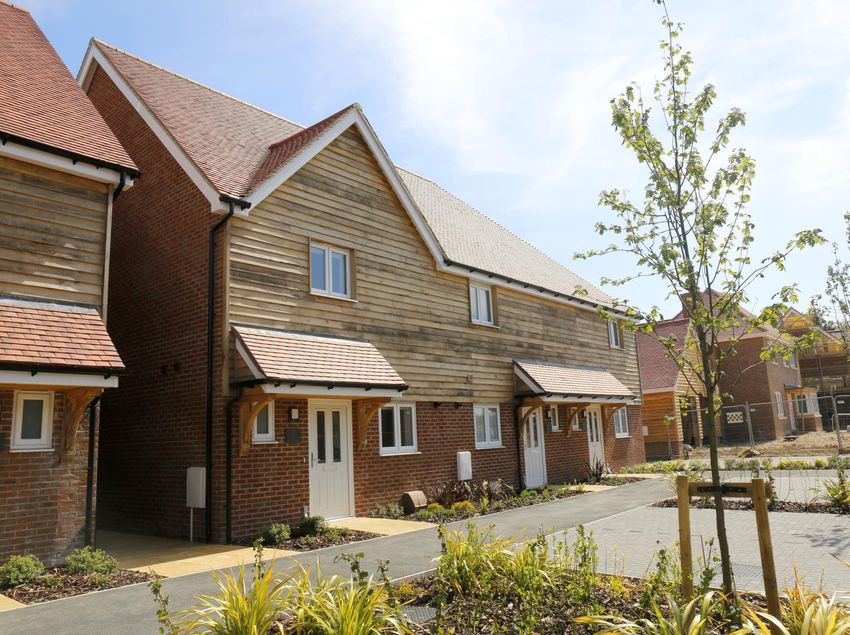
Langley Square, Dartford

                           Introduction & Overview

                           4
Introduction & Overview
Moat History
•   A leading Registered Provider, owning and managing over 20,000 homes in the South East.

•   Grown largely through organic development, with some historic Local Authority stock transfers and acquisitions.

•   Stock rationalisation programme completed in 2018, area of operation geographically dispersed across Kent, Essex,
    Sussex and south London in 36 LA areas, with development activity in c. 30 LA’s

•   Development programme
    • focus is small to medium sized mixed tenure schemes (typically less than 50 homes)
    • over 90% affordable homes to rent or to buy through shared ownership.
    • shared-ownership experience since late 1970’s , historically representing a higher proportion than most other RP’s
    • generates in excess of £7m pa Recycled Capital Grant (RCG) through staircasings ( £61m of grant available on balance
      sheet)

•   One of the benefits of RCG is that we have been able to keep more homes at Social Rent

•   Early decision in November 2018 to pause approvals of additional shared ownership homes and to limit London
    exposure in the future

•   Size of business and small Executive Team / Board enables strong management oversight of operations and
    speed / agility in decision making

                                                                  5
Introduction & Overview | Operating Areas

Operating Across
the South East

•   Our largest stock
    holdings are found in
    Merton, Maldon,
    Medway, Ashford,
    Sevenoaks and
    Greenwich

                            6
Introduction & Overview

Snapshot
                                                                     Finance                   Development           Property Management

•       Strong financial performer
                                                                     £142m                     424                   23days
•       Top quartile for the majority of KPI’s in peer               Turnover                  New Home Starts       Void Turnaround
        benchmarking

•       73% of revenue is derived from social housing
        letting activity, with the balance predominantly
                                                                     £26.7m 553                                      98%
                                                                     Surplus                   New Home Handovers    Repairs Satisfaction
        shared ownership first tranche sales
                                                                                                                     Housing Management

•       RSH G1, V1 rating – reaffirmed Nov 2019

•       Moody’s A2 rating (stable) – reaffirmed Nov 2019,
                                                                     35%                       1,703                 2.03%
                                                                     Operating Margin          Homes in Pipeline     Rent Arrears
        and noting:                                                                                                                 (excl. Universal Credit)

    •     strong interest cover metrics even when compared to
          other A2 rated peers
    •     Social Housing Lettings Interest Cover a strength due to
          strong core social lettings margin (40% in 2019)
                                                                     £1.5bn                    £132m                 77%
    •     relatively low levels of debt as a credit strength, with   Housing Properties Cost   Spend On New Builds   Overall Satisfaction

          gearing well below their A2 rated peers

                                                                     £542m
                                                                     Borrowings

                                                                     7
GMV, Greenwich

                 Governance & Strategy
                 8
Governance & Strategy | Strategic Roadmap

                        9
Governance & Strategy | Regulatory

Regulatory & Governance Considerations

•   Sustained focus on governance and regulatory considerations

    • UK Corporate Governance Code:

    • Dedicated Executive Director of Governance & Compliance appointed in 2019

    • External Governance review every 3 years (latest completed in 2020)

    • Increased governance oversight in key operational areas (e.g. fire safety and property compliance)

•   In May 2019 governance rating was returned to G1 very quickly following a downgrade purely in
    relation to the disposal of 26 units. All learnings embedded to Regulators satisfaction.

•   Board lead strategy, underpinned by strong governance / financial viability.

•   Board fully engaged in agreeing Golden Rule parameters for the business to operate within

•   Robust stress testing and recovery planning, including mitigations, clearly communicated
    throughout organisation

                                                            10
Governance & Strategy | Corporate Structure
Simple Corporate Structure
• Moat Homes Limited (MHL) is the parent
company and is a charitable registered
provider of social housing regulated by the
Regulator of Social Housing (RSH).
• Moat Housing Finance Plc (MHF) is the
group treasury vehicle which has issued a
£300m public bond.
• Moat Housing Group Limited (MHG)
develops homes for market sale and has net
assets of £10m
• Moat’s community orientated activities are
encompassed within the Moat Foundation
brand.
• Three further entities in the Group are
dormant - Moat Construction Services Ltd,
Moat Development Ltd, Mariner Facilities
Management Ltd
11Governance & Strategy | Board of Directors
Our Experienced Board is responsible for setting Gerry McCormack – Independent Director
Appointed to the Board in February 2015, Gerry brings 12 years of sector
our strategic direction and maintaining oversight experience from his time as an Independent Director and Chair of Audit and
of the performance of the organisation. Risk at Thames Valley Housing. His career included time as Group Finance
Director of publicly listed companies with substantial housebuilding and
construction businesses.
Steve White – Independent Chair
Elizabeth Rantzen – Independent Director
Steve joined Moat’s Board in July 2016 and became Chair in May 2018. Steve
has spent most of his career leading organisations through large A Moat Board member since December 2016, Elizabeth’s background is with
transformational change, including four and a half years as Chief Executive of commercial organisations, in IT, retail and legal businesses; she now works
the Hyde Group, during which time he developed a passion for all things exclusively in the public and not-for-profit sectors. She became involved in
housing. housing as a trustee of a small homelessness charity in London and spent
many years on the board of Shelter, and as Director of the J Paul Getty Jr Trust,
Jo Moran – Senior Independent Director funding a range of innovative housing and community initiatives.
Jo joined Moat’s Board in June 2014. She is currently Head of Transformation
for the Retail and Property Group at Marks & Spencer, where her focus is on Tim Boag – Independent Director
leading the change plan to take the business forward. Prior to that she was Tim joined Moat Board in December 2017. He is Group MD – Business Finance
Head of Customer Service at M&S where she championed, planned, and at Aldermore Bank. Tim has had an extensive career with RBS/NatWest
delivered the customer experience across all channels for the UK operation. undertaking a variety of roles throughout Corporate & Commercial Banking,
Finance and Risk, delivering across a wide range of industry sectors.
Ian Lindsay – Independent Director
Ian joined Moat’s Board in June 2014. He is currently a partner at Aspire CP – a Elizabeth Austerberry – Chief Executive
property consultancy specialising in strategic land acquisition and development
Executive Board member - Appointed 2013
management. Prior to Aspire CP, Ian served as Crossrail’s Land and Property
Director for 7 years and before that was at Network Rail taking forward Greg Taylor – Executive Director Finance & Corporate Services
commercial re-developments of the main London and regional stations.
Executive Board member – Appointed December 2009
Mark Foster – Independent Director
Steve Nunn – Executive Director Development & New Business
Mark joined Moat’s Board in May 2016. He has spent most of his career in the
entertainment industry in various marketing and international development Executive Board member – Appointed April 2009
roles. He has been at the forefront of digital transformation, particularly in the
music and cinema sectors, affecting all aspects of business including customer
engagement, marketing, and reporting. Note: Executive Team bios on page 14
12Governance & Strategy | Committee Structure
Our Committee Structure Utilises Our Board’s Diverse Skillset
Moat Board
Customer & Governance &
Remuneration
Audit Committee Communities Finance Committee Nominations
Committee
Committee Committee
Elizabeth Rantzen
Tim Boag (Chair)
Gerard McCormack (Chair)
Jo Moran (Chair) Steve White (Chair)
(Chair)
Gerard McCormack
Mark Foster
Mark Foster Mark Foster
Mark Foster
Steve White
Jo Moran
Steve White Jo Moran
Elizabeth Rantzen
Greg Taylor
Anne-Britt Karunaratne
13Governance & Strategy | Executive Team
The Executive team works alongside the Board and the Committees, to deliver overall strategy and business
plans, ensuring risks to the organisation are recognised and managed and performance is monitored.
Elizabeth Austerberry – Chief Executive
Elizabeth joined Moat in 2013, having previously worked in the City. Her experience includes the financing of major residential projects,
mortgage lending and the provision of advice to local and central government on housing. Whilst at Ernst & Young, she was seconded to the
Treasury dealing with banks’ exposure to residential development.
Elizabeth is a Board Member of the National Housing Federation and Chair of its Audit and Risk Management Committee. Elizabeth also
chairs the CASE group of housing associations
Greg Taylor – Executive Director Finance & Corporate Services
Greg joined Moat in 2009 and in addition to running the finance functions, also oversees the Information Technology team and Digital
Transformation initiatives across the business. Previously, Greg was employed at Cert Octavian plc, a national logistics and distribution
business, where he held the position of Finance and Commercial Director. Originally trained as a Chartered Accountant at Deloitte Touche,
Greg is also a qualified Corporate Treasurer
Steve Nunn – Executive Director Development & New Business
Steve joined Moat in April 2009. Having worked in the housing sector since 1989, he has a wide range of experience in housing
management, operations, property services, asset management, shared ownership, estate and social regeneration and development. Prior to
joining Moat Steve spent 18 years at the London and Quadrant Group becoming Managing Director of the home ownership specialist, Tower
Homes. Steve is currently a board member of B3 Living and Chair of their Development Committee
Anne-Britt Karunaratne – Executive Director Housing & Customer Services
Anne-Britt joined Moat in November 2017 and has worked in housing since 1986 in both the social and private sectors. Her experience
spans neighbourhoods, development, arrears management, contract management and customer engagement. Anne-Britt is on the board
of the Sutton Housing Partnership and a member of their Performance Committee.
Matthew Hayday - Executive Director : Governance and Compliance
Matt joined Moat in June 2019 to develop further the Risk and Governance functions. Matt serves as the organisation’s Data Protection
Officer, Company Secretary and Money Laundering Reporting Officer. Matt’s career has seen him take up several governance and
leadership roles, including posts with the NHS, a UK charity and a private hospital. Before joining Moat, Matt worked for the General
Pharmaceutical Council as Head of Governance, holding interim positions as Director of Fitness to Practice and Director of IT during this
time.
14Governance & Strategy | COVID-19 Response
Operational & Asset Management Response Financial Response
• All staff quickly moved to home working and offices closed • Sufficient liquidity in place to meet our obligations
• Effect on customer service minimised, utilising digital until June 2023. Expect to raise further funds within
channels to replace face to face contact the next 9 months.
• Dedicated phone calls to our more vulnerable customers, • Limited use of Government furloughing scheme
switched Moat Foundation activities to support the most
• COVID-19 stress testing and recovery planning
effected in our communities
undertaken
• Moat has retirement living schemes but does not
• forecasts updated for delays in repairs,
undertake extra care activities.
development and sales, together with
• Our response was swift, but was governed by tight control subsequent catch-up in spend
from the management team overseeing day-to-day
• no breaches in financial covenant or golden
operations, changes in working practices for remote
rules forecast
working and recovery planning
• Monitoring rental collection closely and expect
• No significant impact on arrears, to date. arears to increase once the current furloughing
• Reduced sales activity during April to June, nevertheless scheme ends in October
there were 42 completions.
• Pre-lockdown sales valuations holding and strong
interest from buyers. In last few weeks we soft launched
two schemes in Dartford and Ebbsfleet 3-4 months ahead
of handover – both are fully allocated. The Ebbsfleet
scheme had 80 registrations in an hour (for 30 homes)
• We are now working through the repairs backlog of 2,819
repairs which we expect to clear by 31 Dec 20
• Work resumed on all current development sites (34 sites)
15Governance & Strategy | Strategic Risk
Key Strategic Risks
• At the end of the financial year 2019/20, Moat had 13 strategic risks, to which two COVID-19 risks have been added.
These are reviewed at monthly Executive Team meetings, by Audit Committee quarterly and by Board twice a year
No. Strategic Risk Description
1 The impact of no deal Brexit on Moat
2 Exposure to falling house prices, particularly in market sale business and shared ownership
3 Reduced availability of credit impacting on market sales and shared ownership products
4 Regulatory Risk
5 Increased requirements following a review of building regulation and issues relating to the Grenfell Tower fire
6 Failure of safety management
7 Compromise of information systems and/or data
8 A change in Recycled Capital Grant policy and a requirement to pay back proceeds of staircasing to Homes England/GLA
9 Maintenance of financial covenants
10 Severe breach of Data Protection
11 Financial failure of contractors caused by increased cost of materials and labour
12 Replacement of Housing Management System
13 Welfare reform impact on tenant debt
• Four highest risks are currently:
• Brexit – with our business being wholly focused in the • Response to COVID-19 – working from home effected
UK any impact is likely to arise from any wider effect on quickly and tight senior management control of
the economy. We have undertaken the BoE stress test operations
and we have an operational plan to mitigate the • Recovery from COVID-19 –operational recovery senior
expected issues that might arise. management meetings and planning for long-term agile
• Exposure to falling house prices – we take a working
conservative approach to valuations which are updated
every 3 months. In Nov 2018 we took the decision to
reduce sales exposure which is working through the
programme. Stress testing models -30% HPI
16Neighbourhoods Team
Away Day
Our People
17We value and empower our people
Moat is a good place to work and our 350+ people
tell us that. In our last staff survey 99% of our
people said they were satisfied with Moat as an
employer
We focus on the development of our people through:
• Succession planning
• An award winning apprenticeship programme
• Leadership, coaching and mentoring programmes
• Health and wellbeing initiatives
• Professionally accredited learning and development
Recruitment / Retention
• 41% of our vacancies are filled from within and for positions where we have gone to the external market we
have been able to attract excellent candidates. Our turnover rate is 9% and we have supported 104 staff
through further education in the last 4 years.
18Ashmere Fields, Stelling Minnis
Our Performance
19Our Performance | Key Metrics
Strong Operational Performance Against Targets
Target Actual
Maintaining Our Homes Actual 2019/2020
2019/2020 2018/2019
Current landlords’ gas safety certificates 100% 100% 100%
Routine repairs: right first time 96% 95% 95%
Resident satisfaction with routine repairs service 98% 90% 99%
Void turnaround time in days: general needs, housing for older people and supported 23 17 15
Our Customers
Overall satisfaction with services provided (rented) 77% 80% 82%
Current rent gross arrears (excluding Universal Credit): general needs, housing for older people
2.03% 2.35% 2.46%
and supported
Current rent gross arrears for Universal Credit Customers: general needs, housing for older
6.20% 9.00% 8.09%
people and supported
Current rent gross arrears: Shared Ownership 1.33% 1.50% 1.58%
• We continued to see excellent progress being made against customer arrears during FY2020 which saw
a decline in universal credit (UC) arrears, despite the numbers on UC increasing
• This helped decrease our overall arrears rate for rented customers to 3.04%, down from 3.16% in FY2019
20Our Performance | Our Stock
Our Stock Key Stats
Property Type
• Moat owns and manages over 20,000 homes
1%
• 56% are houses/maisonettes
3%
• 40% flats
• 4% bungalows / bedsits 40%
• Majority of stock is 2 & 3 bed properties (76%) 56%
• 85% of rental units are general needs (social rent)
• We own 7 blocks we classify as ‘high rise’, none have ACM
cladding (of these 3 are under the 18m height threshold)
Bedsit/ Room/ Hostel Flat House/ Maisonette Bungalow
• The average (median) age of our stock is 25 years with 43%
being built in the last 20 years
No. of Bedrooms
3.6%
20.8%
Stock Age
34.5%
25%
20%
15%
10% 41.1%
5%
0%
Pre 1950 1950's 1960's 1970's 1980's 1990's 2000's 2010's 1 Bed 2 Beds 3 Beds 4 Beds +
21Our Performance | Our Customers
Who are our customers
• We have 20,483 customers paying rent Average Tenancy Length (Years)
12
• 11,842 (58%) are rented housing, of which 61%
are on housing benefit or universal credit 10
• 8,641 (42%) are shared owners 8
• Just under 80% of our customers are of working age 6
• 3,492 (13%) are 65 or over and so not subject to UC 4
• Average tenancy length is 8 years with the longest 2
being 70 years 0
Bedsit/Room/Hostel Flat House/Maisonette Bungalow
Rental Customer - Payment Methods Customer Age Profile
3%
7%
27% 17%
13%
39%
16%
22%
34%
22%
Self Payers Housing Benefit Universal Credit Under 25 25-34 35-44 45-54 55-64 65 & Over Unknown
22Our Performance | ESG
ESG
% of Heating source % of Homes
Environmental EPC Rating
Homes
• HA/Landlord of the Year award at the South East Energy A 0.05% Gas boilers 74.53%
Efficiency Awards 2020 B 27.37% Gas community 5.55%
heating
• Energiesprong pilot in 2019/20 retrofitted 5 homes to C 22.79%
improve environmental performance by cutting carbon D 17.23% District heating 0%
emissions by 90% and saving 3.2 tonnes of CO2 pa E or below 2.63% Electric 12.39%
• Sustainability strategy - programme of installing cavity wall Heatpumps 6.5%
insulation, loft insulation and ground source heat pumps Missing EPC's 29.93%
Biomass 0%
• 100% of homes meet Decent Homes Standard Other 1.03%
Total 100.00%
• 0% of homes have an outstanding FRA Based on 11,946 rented properties
Social Governance
• We are a social business with charitable objectives • Robust internal control / governance – Rated G1/V1 by RSH
• Over 99% of our social housing rents are at / below LHA • Board members re-elected every 3 years (normal maximum
tenure of 6 years which can be extended to 9 years)
• Customer engagement strategy built around flexibility,
responsiveness, inclusivity, accessibility and • 7 of the 10 Board members are independent non-exec
accountability directors, currently recruiting for further 2 non-exec’s
• Award winning apprenticeship scheme running since 2009 • Board skills matrix regularly reviewed
with 90% securing continuing employment with Moat.
• Working with external consultants on diversity, currently
• Moat Foundation invests £0.8m pa working with partners in • 30% of Board female
the community
• 13% of tenants, non-white, 12% of staff non-white
23Bloomsbury Gardens, Sissinghurst
Development & SalesDevelopment | Committed Development Pipeline
Historic Delivery
Rent Shared Ownership Intermediate rent Market rent Market sale Total
2009-10 418 194 68 3 3 686
2010-11 240 195 26 - - 461
2011-12 285 119 11 - - 415
2012-13 275 179 - - 31 485
2013-14 220 131 - - 13 364
2014-15 409 211 - - 21 641
2015-16 390 274 - - - 664
2016-17 224 182 - - - 406
2017-18 147 310 - - - 457
2018-19 200 200 - - - 500
2019-20 166 361 - 2 24 553
• Moat has a strong history of delivering a mix tenure pipeline, with higher levels of shared ownership than most other
RP’s, which has performed well
25Development | Development Pipeline
Development Pipeline (Units)
800
600
400
200
0
2021 2022 2023 2024 2025 2026 2027 2028 2029 2030
Committed Uncommitted
Development Capex
250
200
150
(£m)
100
50
0
2021 2022 2023 2024 2025 2026 2027 2028 2029 2030
Committed Uncommitted
• 10 year programme will see the planned delivery of just over 6,400 units
• Approximately 23% of these units are committed
• Uncommitted programme planned at 60% rented, 32% shared ownership 8% market sale
26Development | Future Development - Tenure Mix
Committed Uncommitted
London London Total
Social Affordable Shared Market Social Affordable Shared Market
Affordable Affordable
Rent Rent Ownership Sale Rent Rent Ownership Sale
Rent Rent
2020/21 6 336 7 234 29 - - - - - 612
2021/22 40 152 46 347 30 - - - - - 615
2022/23 - 37 71 84 31 120 123 39 126 - 631
2023/24 - 6 - - - 120 154 110 210 50 650
2024/25
- - - - - 120 160 110 210 50 650
Onwards
• Committed development program is materially complete by
Development approvals Nov 18 – Jun 20
FY2023 and will see delivery of 1,456
Shared Grand
• Targeted uncommitted program will aimed at 650 units per Area Rented
Ownership Total
annum
• Recent market conditions, as well as higher levels of grant London 42 19 61
income being available, has led to a shift back towards rental
v shared ownership more in line with Moat’s normal Outer London 56 7 63
business model that has historically worked well
Total 488 48 536
91.0% 9.0%
27Sales | Sales Exposure
Approach Historic Delivery
• Mixed portfolio approach Shared Shared Staircasings /
Open Market
Ownership Ownership redemptions
• different locations, markets and product mix Sales
Sales Resales equity loans
• characteristics of scheme determine sales period set and whether 2009-10 515 20 127 300
use own inhouse team or national or local agents 2010-11 201 0 125 270
• Capital Projects Committee (CPC) assesses impact of fall in 2011-12 171 0 138 281
values 2012-13 145 25 145 233
2013-14 158 18 150 423
• Regularly updated valuations 2014-15 186 21 169 454
• Conservative investment appraisal assumptions on HPI 2015-16 249 0 199 439
• Regular monitoring of sales (impairment) risk - reported to ET, 2016-17 216 0 244 338
Finance Committee and Board 2017-18 239 0 209 314
2018-19 275 0 233 298
• Open Market Sales 2019-20 331 0 226 261
• Additional governance process through MHG
• MHG has £10m net assets sheltering outright sales exposure Off Plan Sales
• On lending from MHL to MHG capped at £50m (currently £20m)
% of Completions Within 2 Weeks of Handover
• Development commitment capped at £70m 2015-16 5%
Forecast Sales 2016-17 16%
2017-18 32%
• All schemes currently selling and valuations holding 2018-19 25%
2019-20 39%
• Some larger schemes have estimated in excess of 6 month
selling period anyway, but selling process generally lengthened Forecast Sales
in last year (fire safety)
• Off plan sales remain strong Over the last 3 years 32% of Shared Ownership Sales Open Market Sales
completions occur within 2 weeks of handover, with 2019/20 2020-21 287 9
achieving 39% 2021-22 382 57
2022-23 41 24
28Springhead Park, Ebbsfleet
Financial Performance
29Financial Performance | Year Ended 21 March 2020
Actual Budget
Key Financials - Unaudited Summary Income Statement 2019/20 2019/20
£m £m
Strong financial performance Revenue 105.5 105.4
First Tranche Sales 36.2 39.4
Open Market Sales - 14.2
No reliance on asset sales to 141.7 159.0
cover interest costs Operating Margin 36.1 34% 36.5 35%
First Tranche Sales Margin 2.4 15% 3.0 15%
Open Sales Margin - 2.0
Low gearing Staircasing & Redemptions 11.6 10.8
50.1 35% 52.3 33%
Rent arrears decreasing
Movement in Fair Values (3.0) 0.0
47.5 52.3
Interest (21.0) (20.0)
26.7 32.6
Tax 0.0 0.0
Surplus 26.7 19% 32.6 21%
Housing Properties
Covenants:
Interest Cover [EBITDA MRI] (x) 2.03 1.90
Gearing [NBV Housing assets/Net borrowings] 36% 39%
Rent Arrears:
Socially Managed (Exclusive of UC) 2.03% 2.35%
Socially Managed (UC) 6.20% 9.00%
Shared Owners 1.33% 1.50%
30Financial Performance | Long Term Plan
• Strong operating margins, resulting in robust financial covenant performance and compliance with our financial Golden Rules.
• Prudent business planning assumptions assume relatively low margins on sales activity which has historically been outperformed
Margin Social Housing Performance
50% 2.0x
Social Housing Margin %
80 50%
£m
40% 1.8x
40%
Interest Cover
60
30% 30% 1.6x
40
20% 20% 1.4x
20
10% 10% 1.2x
0 0%
0% 1.0x
2021 2022 2023 2024 2025 2026 2027 2028 2029 2030
2021 2022 2023 2024 2025 2026 2027 2028 2029 2030
Operating Surplus Operating Margin
Social Housing Letting Interest Cover Social Housing Margin
Interest Cover (EBITDA MRI) Gearing (Historic Cost NBV)
2.50x
70%
2.00x 60%
50%
1.50x
40%
1.00x 30%
20%
0.50x
10%
0.00x 0%
2021 2022 2023 2024 2025 2026 2027 2028 2029 2030 2021 2022 2023 2024 2025 2026 2027 2028 2029 2030
31Peters Village, Wouldham
Treasury
32Treasury | Overview
Treasury Portfolio Fixed vs Floating (Drawn) Type of Debt
• Total funding of £782m, of which £532m was
outstanding as at March 2020 17%
29.8%
• Debt portfolio currently 83% fixed on a drawn 39.5%
basis, with a wide range of funding sources.
• The group has one own named bond which has
been tapped once providing a total of £250m 83% 30.7%
funding
• The group currently has £143m (notional) of
free-standing hedges, adequate collateral is in Fixed Floating Capital Markets RCF Term
place for these instruments
• The debt repayment profile is spread across the
next 27 years. High repayment levels in the first
5 years are due to two RCFs maturing towards 300
Debt Repayment Profile
the end of year 3 – extension or refinancing is
£m
250
expected
200
• C.£384m of unencumbered assets in the group 150
alongside significant levels of excess security on 100
charged facilities. 50
0
1-5 6-10 11-15 16-20 21+
Years
33Treasury | Treasury Risk Management
• Comprehensive treasury management strategy approved by the board annually
• Board approved Golden Rules which operate under a RAG system as noted in table below.
• Detailed Stress Testing and Recovery Planning undertaken including 8 single variant and 3 multi-variant tests which are evaluated against
financial covenants and golden rules. These tests cover a range of themes including;
• Revenue risks, including the regulation of rental income, market exposure and welfare impacts
• Treasury including macro-economic and financing risks
• Development and Investment, including increased sales and impairment risk on shared ownership and private sales homes
• Bank of England Brexit Scenario Stress test
• COVID-19 Impact
• Mitigating strategies have been developed that can be implemented once identified trigger points are reached to avoid any financial
covenant breaches under all stress scenarios
• Financial covenants and golden rules are forecast, monitored and reported each month to Board, to ensure financial viability and robustness,
whilst still delivering on our corporate objectives
Golden Rule Description RAG Rating Current RAG
Interest Cover > 1.4x (including asset sales) 1.4x >1.5x
EBITDA MRI /Interest Green
>1x (excluding asset sales) 1.0x >1.1x
Operating Margin > 30% 30% >35% Green
Liquidity Development program funded for 12 months + £25m 12m 36m + £25m Green
Sales / Impairment Risk Under £25m exposure >=£25mValeria Bay, New Romney
Summary
35Summary
✓ Long successful history of providing affordable housing across a range of tenures
✓ Strength and depth in affordable housing to rent and to buy via shared ownership
✓ Operate in areas of high demand and strong house price and population growth
✓ Strong governance and control environment with significant leadership experience
✓ Significant levels of experience with shared ownership sales with a well-managed approach to sales
exposure
✓ Development programme targeted in areas of high growth
✓ Strong credit and governance highlighted by Moody’s A2 rating and V1G1 regulatory rating
36Questions
37You can also read