FY20 RESULTS PRESENTATION - 10 August 2020 - Bell Direct
←
→
Page content transcription
If your browser does not render page correctly, please read the page content below
FY20 RESULTS
PRESENTATION
10 August 2020
slide
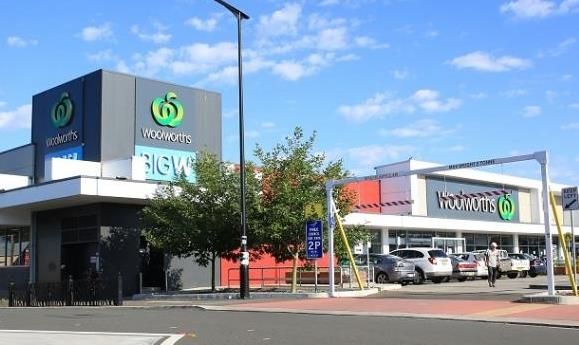
Warner, QLD
AGENDA
1. OVERVIEW OF FY20 RESULTS
2. FINANCIAL PERFORMANCE
3. OPERATIONAL PERFORMANCE
4. GROWTH OPPORTUNITIES
5. KEY PRIORITIES AND OUTLOOK
6. QUESTIONS
7. APPENDICES

                                slide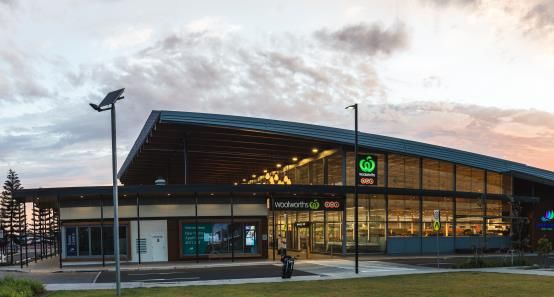
1
OVERVIEW OF
FY20 RESULTS
Anthony Mellowes
Chief Executive Officer

                          slide 3
FY20 HIGHLIGHTS

               FINANCIAL                                                                CAPITAL                                                         ACTIVE PORTFOLIO
             PERFORMANCE                                                              MANAGEMENT                                                          MANAGEMENT

                      FFO per unit 1                                                            Gearing 3                                     Portfolio occupancy 6 Specialty vacancy 6
     14.65 cpu, down by 10.3%                                                    25.6%, down by 7.2%                                                  98.2%                             5.1%

                Distribution per unit 1,2                                                    NTA per unit 4                                        Portfolio weighted average cap rate 7
     12.50 cpu, down by 15.0%                                                    $2.22, down by 2.2%                                                                  6.51%

                                                                         Weighted cost of               Weighted average
          Funds from operations (FFO)                1                                                                                              Acquisitions 8                 Divestments 8
                                                                             debt 5                      debt maturity 5
       $140.8m, down by 0.7%                                                3.5% pa                          5.1 yrs                                 $78.4m                         $21.5m

1.   For the year ended 30 June 2020 vs year ended 30 June 2019
2.   Final distribution of 5.00 cpu in respect of the year ended 30 June 2020 will be paid on 31 August 2020. First half distribution of 7.50 cpu was paid on 29 January 2020. “cpu” stands for Cents Per Unit
3.   As at 30 June 2020, compared to 30 June 2019. Gearing is calculated as Finance debt, net of cash (with USD denominated debt recorded as the hedged AUD amount) divided by total tangible assets (net of
     cash and derivatives)
4.   As at 30 June 2020, compared to 30 June 2019
5.   As at 30 June 2020. The corresponding numbers as at 30 June 2019 were weighted cost of debt of 3.6% and weighted average debt maturity of 6.1 years
6.   As at 30 June 2020. The corresponding numbers as at 30 June 2019 were portfolio occupancy of 98.2% and specialty vacancy of 5.3%
7.   As at 30 June 2020. Weighted average capitalisation rate as at 30 June 2019 was 6.48%
8.   During the year we acquired Warner Marketplace QLD for $78.4 million (excluding transaction costs), and sold Cowes VIC for $21.5 million

                                                                                                                                                                   slide 4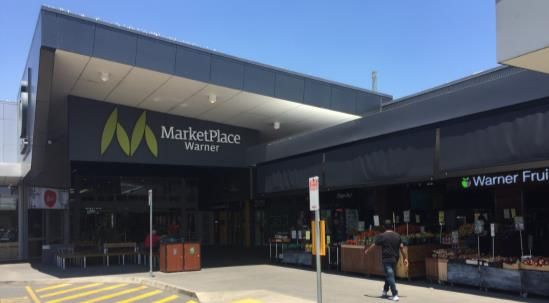
KEY ACHIEVEMENTS
Supermarket anchored convenience centres continue to be resilient
                    •   Throughout the COVID-19 pandemic, our convenience-based centres have been relatively resilient
                           – Anchor tenants have experienced strong sales growth and turnover rent has increased
                           – We have continued to complete leasing deals, with 75 renewals and 55 new lease deals completed during the COVID-
                                19 period (March 2020 to June 2020). Specialty vacancy is stable at 5.1% and specialty occupancy costs are also
                                stable at 10.0%. Approximately 92% of tenants are now open and trading including approximately 63% in Victoria
                    •   COVID-19 has impacted many of our specialty tenants
                           – Sales performance has been mixed, with many experiencing sales declines
  OPTIMISING THE           – We have provided rental assistance to over 600 tenants in accordance with the Mandatory Code of Conduct
                           – Rental collection rate of 77% during the COVID-19 period. We will continue to pursue payment from tenants of all of
  CORE BUSINESS                 the outstanding amounts not covered by agreed waivers or deferrals
                    •   Our focus continues to be to
                           – Improve tenancy mix with a bias toward non-discretionary categories
                           – Maintain high retention rates on renewal
                           – Maintain low specialty vacancy by working pro-actively with our tenants in these challenging times
                    •   This will ensure that we have sustainable tenants paying sustainable rents, supporting our strategy of generating defensive,
                        resilient cash flows to support secure and growing long term distributions to our unitholders

                    •   Acquisition of Warner Marketplace, a Woolworths and Aldi-anchored convenience centre in Brisbane QLD, for $78.4m
                        (excluding transaction costs) in December 2019
     GROWTH         •   Completion of Shell Cove Stage 3 development (5 additional specialty shops of 396sqm in total) for $4.8m in December 2019
                    •   Sale of Cowes VIC for $21.5m in February 2020 (9.7% above June 2019 book value)
  OPPORTUNITIES     •   Completed the sale process for the SURF 1 investment properties for $69.3m, achieved an 11.0% IRR for unitholders since
                        fund commencement in 2015

                    •   Balance sheet remains in a strong position
                          – Gearing of 25.6% is below our target range of 30-40%. This is due to the cash proceeds from the $250.0 million
     CAPITAL                  institutional placement in April 2020 and the $29.3 million unit purchase plan in May 2020
                          – Weighted average cost of debt is 3.5%, weighted average term to maturity of debt is 5.1 years, 91.1% of drawn debt
   MANAGEMENT                 either fixed or hedged
                          – Cash, term deposits and undrawn facilities of $622.8 million

                    •   FY20 FFO per unit of 14.65 cpu represents a decline of 10.3% compared to last year
    EARNINGS        •   FY20 Distributions of 12.50 cpu represents a decline of 15.0% compared to last year
 & DISTRIBUTIONS                                                                                                slide 5
2
FINANCIAL PERFORMANCE
Mark Fleming
Chief Financial Officer

                          slide 6
IMPACT OF COVID-19 ON EARNINGS
The largest negative impact has been increased rental arrears
 Cash rent shortfall
                                                                                                                Cash rent shortfall ($m)
 •   The difference between invoiced rental income and cash rent collected
     during FY20 was $26.8m:                                                                                                                  COVID-19 period shortfall = $22.7m
        –   $4.1m relates to the pre-COVID period (February 2020 or before)                                                                         (77% collection rate 1)
        –   $22.7m relates to the COVID period (March 2020 to June 2020),                                                                                                     13.9                       26.8
            including $4.5m of waived rent and $4.3m of deferred rent pursuant                                                                                     4.3
            to the Mandatory Code of Conduct                                                                                                  4.5
                                                                                                                       4.1
 Accounting treatment 2
                                                                                                                  Pre COVID-19            Waived Rent         Deferred Rent      Remaining Unpaid FY20 Cash Rent
 •   The accounting treatment for this $26.8m shortfall is:                                                           Period                                                          Rent           Shortfall
       –   $4.5m waived rent is not included in rental income or receivable
       –   $22.3m has been included in rental income and receivable, but an
           expected credit loss allowance (“ECL”) of $15.3m has been raised
           in receivables against this amount. As the starting ECL balance at
           30 June 2019 was $0.9m, the incremental $14.4m has been
           included in property expenses 3

 Impact on earnings
                                                                                                                Impact of COVID-19 on FY20 FFO ($m)
 •   The direct impact of COVID-19 on FY20 FFO is $20.5m (or 2.13cpu)
       –    $1.6m of additional property expenses (e.g. cleaning and security)
                                                                                                                                                                                 14.4                  20.5
       –    $4.5m of waived rent not included in rental income
       –    $14.4m of incremental ECL
                                                                                                                                                      4.5
                                                                                                                          1.6
 •   The indirect impacts of COVID-19 on FFO (or FFO per unit) are not
     included in this analysis. For example:                                                                      COVID-19 Expenses               Waived Rent               ECL Allowance        FY20 FFO COVID-19
        –   The April/May 2020 equity raisings reduced FFOPU by                                                   (included in property      (not included in rental     (included in property      Direct Impact
            approximately 0.36 cpu, due to increased weighted average units                                             expenses)                   income)                    expense)
            on issue, partially offset by saved net interest expense
        –   Higher specialty vacancy than previously anticipated, reduced
            renewal and new lease uplifts, lower other income, increased
            incentives, offset by increased turnover rent from anchors

                                                                                                                                                                          slide 7
1.   Collection rate is calculated as $22.7m cash rent shortfall, divided by total invoiced gross property income for the March 2020 to June 2020 period of approximately $100m
2.   For more information on the accounting treatments, refer to note 3 of the Financial Statements
3.   This means that $7.9m of non-cash rental income is included in Net Profit After Tax and FFO, being $26.8m less $4.5m waived rent, less $14.4m incremental ECL
PROFIT & LOSS
For the year ended 30 June 2020                                                                                                                                           30 June       30 June
•    Gross property income increased due to acquisitions (full year benefit of the FY19                             $m                                                     2020          2019     % Change
     acquisitions, and Warner Marketplace in December 2019), partially offset by sale of                            Anchor rental income                                   128.7         120.0      7.2%
     Cowes in February 2020 and non-recognition of waived rent ($4.5m)
                                                                                                                    Specialty rental income                                   126.1      116.6      8.1%
•    Property expenses increase includes the increased expected credit loss (”ECL”)                                 Recoveries and recharge revenue                            34.2      30.4      12.5%
     allowance of $14.4m and $1.6m of COVID-related expenses
                                                                                                                    Other income                                               8.1        5.4      50.0%
         – A detailed explanation of the ECL calculation is set out in note 3 of the Financial
           Statements                                                                                               Straight lining and amortisation of incentives             (8.1)     (8.6)     (5.8)%
                                                                                                                    Gross property income                                     289.0      263.8      9.6%
•    Distribution income relates to our CQR unitholding. Our unitholding has reduced to
     6.78m units (from 19.9m units as at 1 July 2018), and the DPU was reduced compared                             Property expenses                                         (108.6)    (84.2)    29.0%
     to the prior period                                                                                                                                            1
                                                                                                                    Property expenses / Gross property income (%)             36.6%     30.9%       5.7%
•    Funds management income includes $0.8m of disposal fees. SURF 1 will be wound up                               Net property income                                       180.4      179.6      0.4%
     in FY21
                                                                                                                    Distribution income from CQR                               1.7        4.4      (61.4)%
•    Corporate costs increase primarily due to increase in D&O insurance                                            Funds management income from SURF funds                    1.7        1.8      (5.6)%

•    Fair value adjustments:
                                                                                                                    Net operating income                                      183.8      185.8     (1.1)%
        –   Investment properties: $27.4m of the fair value loss can be directly attributed to                      Corporate costs                                           (13.8)     (13.1)     5.3%
            COVID-19 FY21 cash flow impacts, with the balance of the fair value loss due to
            a combination of capitalisation rate softening, valuation NOI decreasing and                            Fair value of investment properties                       (87.9)     (40.5)    117.0%
            discounted cash flow valuations adopted more conservative let-up assumptions                            Fair value of derivatives                                  51.4      66.3      (22.5)%
            and lower market rent growth
        –   Derivatives: mainly due to increasing value of USPP swaps (A$ depreciation and                          Unrealised foreign exchange loss                           (8.1)     (27.3)    (70.3)%
            decreased interest rates)                                                                               Share of net profit from associates                          -        1.2        nm
        –   Unrealised foreign exchange loss: is the increase in the A$ value of our US$ debt
            due to A$ depreciation over the reporting period                                                        Transaction costs                                          (1.5)     (3.7)     (59.5)%
        –   Share of net profit from associates: relates to SURF 1, 2 & 3 co-investment                             EBIT                                                      123.9      168.7     (26.6)%
            stakes, with net profits being offset by valuation reductions in the SURF 3 fund
                                                                                                                    Net interest expense                                      (37.9)     (58.5)    (35.2)%
•    Transaction costs are related to the equity raisings in April/May 2020                                         Tax expense                                                (0.5)     (0.6)     (16.7)%
•    Net interest expense:                                                                                          Net profit after tax                                       85.5      109.6     (22.0)%
       –    Average net debt relatively stable with prior year at c.$1.1bn with weighted
            average cost of debt now down to 3.5% (vs June 2019 of 3.6%)
       –    Prior year included swap termination cost of $17.7m                                                                                                     slide 8

1.   For the purpose of this ratio, gross property income excludes straight lining and amortisation of incentives
FUNDS FROM OPERATIONS
For the year ended 30 June 2020 $m
30 June 30 June
2020 2019 % Change
Net profit after tax (statutory) 85.5 109.6 (22.0)%
• Funds From Operations (“FFO”) of $140.8m is down by 0.7% compared to last
year, due to COVID-19 impacts offsetting the contribution from acquisitions
– Non-cash and one-off items have been excluded from FFO Adjustment for non cash items
– Direct impact of COVID-19 on FFO is $20.5m
Reverse: Straight lining & amortisation 8.1 8.6 (5.8)%
• Adjusted FFO (AFFO) of $124.3m is down by 2.4% compared to last year Reverse: Fair value adjustments
– New lease incentives have increased due to higher average incentives and - Investment properties 87.9 40.5 117.0%
increased number of new leases (146 in FY20 vs 87 in FY19)
- Derivatives (51.4) (66.3) (22.5)%
• Weighted average units on issue increased primarily due to distribution - Foreign exchange 8.1 27.3 (70.3)%
reinvestment plan (5.3m units in August 2019 and 10.3m units in January 2020),
institutional placement (115.7m units in April 2020) and unit purchase plan (13.6m Other adjustments
units in May 2020)
- Other income (0.5) - nm
- Net unrealised (profit)/loss from SURF funds 1.6 0.7 128.6%
• Distribution of 12.50 cpu represents 99.4% of AFFO
– Estimated tax deferred component decreased to 11% which is lower than - Transaction costs 1.5 3.7 (59.5)%
our expected normalised level of 20-25% primarily due to timing of - Swap termination cost - 17.7 nm
deductions associated with the ECL allowance. FY19 was higher due to
deductions associated with the September 2018 USPP FFO 140.8 141.8 (0.7)%
Number of units (weighted average)(m) 960.9 868.4 10.7%
• FFO per unit (“EPU”) decreased by 1.68cpu (or 10.3%) compared to the prior
FFO per unit (cents) ("EPU") 14.65 16.33 (10.3)%
year due to the contribution from acquisitions being offset by:
– COVID-19 impact of 2.13cpu: direct impact of $20.5m as set out on the Distribution ($m) 123.5 135.4 (8.8)%
previous slide; and Distribution per unit (cents) ("DPU") 12.5 14.7 (15.0)%
– Equity raisings impact of 0.36 cpu: the April/May 2020 equity raisings
Payout ratio (%) 85% 90% (5.0)%
increased the weighted average units on issue, partially offset by saved net
interest expense Estimated tax deferred ratio (%) 11% 58% (47.0)%
Less: Maintenance capex (6.0) (5.6) 7.1%
• Distributions represent 99.4% of AFFO Less: Leasing costs and fitout incentives (10.5) (8.8) 19.3%
– $7.9m of non-cash rental income is included in AFFO. This is expected to
be recovered in FY21 AFFO 124.3 127.4 (2.4)%
Distribution / AFFO (%) 99.4% 106.3% (6.9)%
slide 9BALANCE SHEET
As at 30 June 2020
$m 30 June 2020 30 June 2019 % Change
• Value of investment properties decreased from $3,147.0m to $3,138.2m due to: Cash 183.8 4.2 nm
– Acquisition of Warner Marketplace for $83.4m ($78.4m acquisition price
plus transaction costs of $5.0m) Investment properties 3,138.2 3,147.0 (0.3)%
– Disposal of Cowes for $21.5m
– Developments, capital expenditure and straight lining of $17.2m (including Investment in CQR 22.7 29.6 (23.3)%
completion of Shell Cove Stage 3 for $4.8m); and
– Like-for-like valuation decrease of $87.9m of which $27.4m is directly Other assets 245.0 191.4 28.0%
attributable to expected COVID-19 impact on FY21 cash flows
Total assets 3,589.7 3,372.2 6.4%
• Cash includes term deposits of $180.0m which are the excess proceeds from the Debt 1,083.6 1,137.5 (4.7)%
equity raisings in April/May 2020 (this excess cash will be applied to paying out
the maturing MTN facility in October 2020) Distribution payable 53.6 69.0 (22.3)%
Other liabilities 78.5 61.8 27.0%
• Investment in CQR of 6.78m units held at its closing price on 30 June 2020 of
$3.35 per unit Total liabilities 1,215.7 1,268.3 (4.1)%
• Other assets include derivative financial instruments with a mark-to-market Net tangible assets (NTA) 2,374.0 2,103.9 12.8%
valuation of $183.8m, SURF 1, 2 & 3 co-investment of $15.9m, receivables of Number of units (period-end)(m) 1,071.4 925.6 15.8%
$34.2m and other assets of $11.1m
NTA per unit ($) 2.22 2.27 (2.2)%
• Net debt has decreased due to equity raisings in April/May 2020 in excess of
acquisition and capital expenditure
Corporate costs 13.8 13.1 5.3%
External funds under management
• Units on issue has increased by 145.8m units due to: institutional placement of
115.7m units at $2.16 per unit raising $250.0m in April 2020, unit purchase plan of - SURF 1, 2 & 3 assets under management 104.8 186.4 (43.8)%
13.6m units at $2.16 per unit raising $29.3m in May 2020, distribution - Less: SURF 1, 2 & 3 co-investment (15.9) (26.5) (40.0)%
reinvestment plans issuing 5.3m units at $2.48 per unit in August 2019 and 10.3m
units at $2.71 per unit in January 2020 (underwritten), and 0.9m issued to Assets under management 3,678.6 3,532.1 4.1%
employees under vesting of remuneration plans 1
MER (%) 0.38% 0.37% 0.01%
• NTA per unit decreased by 2.2% to $2.22, primarily due to the decrease in like-
for-like investment properties valuations and dilutive equity raisings in April/May
2020
1. MER stands for “Management Expense Ratio” and is calculated as Corporate Costs divided by Assets Under Management at year end (including SURF 1,
SURF 2 and SURF 3). Bps stands for basis points. slide 10DEBT AND CAPITAL MANAGEMENT
As at 30 June 2020
• Gearing of 25.6% is below the target range of 30% to 40%. Our preference is for gearing 30 June 2020 30 June 2019
to remain below 35% at this time. The reduction of gearing from June 2019 is due to the Facility limit ($’m) 1 1,457.1 1,257.1
equity raise proceeds held in cash and term deposits, reducing net debt for gearing
purposes. Look-through gearing (including CQR and SURF investments) is 26.0% Drawn debt (net of cash) ($’m) 2 823.3 1,064.9
Gearing (%) 3 25.6 32.8
• Key movements in net debt during the period:
– Total facility limit was increased by $200.0m to $1,457.1m including new and % debt fixed or hedged 91.1 70.4
extended bilateral debt facilities of $150.0m expiring in FY25, and $50.0m expiring
in FY22
Weighted average cost of debt (%) 3.5 3.6
– Net debt decreased due to equity raisings of $250.0m in April 2020 and $29.3m in Average debt maturity (yrs) 5.1 6.1
May 2020, less transaction fees and costs of $7.6m
– Cash (including term deposits) and undrawn debt has increased to $622.8m 6 (up Average fixed / hedged debt maturity (yrs) 3.8 4.8
from $180.2m as at 30 June 2019) Interest cover ratio 4 4.5x 4.3x
• The next debt expiry is the $225.0m medium term note in April 2021. Under the terms of Net debt / FFO before interest cost 5 4.6x 5.8x
the MTN it can be repaid (with appropriate notice) from October 2020 with no make
whole obligation. The current intention is that the MTN will be repaid from existing cash
Debt Facilities Expiry Profile ($m)
(and term deposits) and undrawn debt
25.0 Bank debt undrawn
300
• Weighted cost of debt reduced from 3.6% to 3.5% due to lowering in base rates. Bank debt drawn
Average debt maturity has decreased to 5.1 years due to a new facility with shorter than 250 225.0 MTN
average maturity ($50.0m expires in FY22) offset with new and extended bilateral 225.0
200.0 USPP
facilities to FY25. Average hedge fixed maturity has decreased to 3.8 years as there 200
175.0
have been no changes in the hedging profile since June 2019
150
• We are well within debt covenant limits of less than 50% gearing and interest cover ratio 100.0 106.5 103.3
100 92.1
(ICR) greater than 2.0x 50.0 65.8
50 39.4
1. Facility limit is made up of $600.0m bilateral bank facility limits of $500.0m plus $100.0m syndicated non revolving
50.0
facility) plus USPP A$ denominated facility of $50.0m plus the USPP US$ denominated facilities at A$357.1m (being 0
made up of USPP2014 US$ denominated facility at A$159.8m and the USPP2018 US$ denominated facility at
A$197.3 (both being the AUD amount received and hedged in AUD)), plus the A$ MTN issuance of $450.0m. FY21 FY22 FY23 FY24 FY25 FY26 FY28 FY29 FY30 FY32 FY34
2. Drawn debt (net of cash) of $823.3m is made up of: statutory debt of $1,083.6m less $78.2m being the revaluation of
the USPP US$ denominated debt from statutory value of $435.3m (using the prevailing June 2020 spot exchange
rate) to restate the USPP to its hedged value of A$357.1m plus unamortised debt fees and MTN discount of $1.7m
less $183.8m cash and term deposits
3. Gearing calculated as drawn debt (net of cash) of $823.3m (refer note 2 above), divided by total tangible assets (net of cash and derivatives) being total
assets of $3,589.7m less cash and term deposits of $183.8m less derivative mark-to-market of $183.8m = $3,222.1m
4. Interest cover ratio is calculated as financial year Group EBIT $123.9m plus unrealised and other excluded gains and losses of $47.7m, divided by net
interest expense of $37.9m slide 11
5. Net debt / FFO before interest cost is calculated as drawn debt (net of cash) $823.3m divided by FFO $140.8m plus interest expense $38.2m = 4.6x
6. Cash and undrawn facilities is made up of facility limit of $1,457.1m less drawn debt net of cash and term deposits of $823.3m less $11.0m of debt
facilities used for bank guarantees = $622.8m3
OPERATIONAL PERFORMANCE
Anthony Mellowes
Chief Executive Officer
slide 12PORTFOLIO OVERVIEW
Weighting towards food, health and retail services (non-discretionary)
As at 30 June 2020 Number of Number of GLA Site Area Occupancy Value WALE Weighted average
centres specialties (sqm) (sqm) (% GLA) ($m) (yrs) cap rate (%)
Neighbourhood 75 1,321 465,497 1,495,916 98.3% 2,334.3 7.3 6.39%
Sub-regional 10 518 209,028 545,090 98.0% 803.9 7.8 6.84%
85 1,839 674,525 2,041,006 98.2% 3,138.2 7.4 6.51%
Tenants by Category (by gross rent)1 Specialty Tenants by Category (by gross rent)1,2 Geographic Diversification (by value)
WA
Other Retail 11% 15%
3
Woolworths 28% NSW
Petrol 2% Fresh Food/Food 24%
Catering/Liquor 30%
Discount Variety 6%
VIC
19%
Specialties 52% Apparel 8%
Big W 5%
Coles 11% TAS QLD
11% 25%
Pharmacy & Health
Services 22%
Care 21%
4
Wesfarmers 3% SA
Other major5 1% 6%
1. Annualised gross rent excluding vacancy and percentage rent
2. Mini Majors represent 12% of annualised specialty gross rent. Mini major tenants have been split across the relevant categories
3. Woolworths includes Endeavour Drinks (1.6% of gross rent)
4. Wesfarmers includes Kmart 2.3%, Bunnings 0.5% and Target 0.4% slide 13
5. Other majors includes Aldi, Farmer Jacks and Grand CinemasPORTFOLIO OCCUPANCY
Specialty vacancy is stable despite COVID-19 challenges
Portfolio Occupancy (% of GLA)
• Strategic focus on remixing toward non-discretionary categories, reducing long term
vacancies and maintaining the retention rate on existing tenant renewals 98.6% 98.4% 98.4% 98.2% 98.2%
• Total portfolio occupancy has remained stable at 98.2% of GLA
– Specialty vacancy is stable at 5.1%, at the higher end of target range of 3-5%
– Long term stability of portfolio occupancy illustrates the resilience of the portfolio
– Refer to slide 31 for a comparison between existing and FY19 acquisition
centres
• Specialty tenant holdover on total portfolio is 1.1% (increased from 1.0% at June 2019)
• Anchor tenant expiries in FY21:
– West End Plaza Coles in November 2020: new ten year term agreed subject to June 2016 June 2017 June 2018 June 2019 June 2020
Coles Board approval, two remaining ten year options
– West End Plaza Kmart in November 2020: new five year term agreed, two
remaining five year options
– Riverside Woolworths in April 2021: ten year extension agreed, with four Overall Lease Expiry (% of Gross Rent) 26.8%
remaining five year options granted expiring in 2051
– New Town Kmart in June 2021: expecting Kmart to exercise a ten year option
• Continued active management of lease expiry profile. Approximately 10% of leases
expiring per annum is consistent with c.50% of income from specialty tenants with 5-
year leases 12.2%
11.0% 10.4%
9.4%
8.0% 8.0%
5.6%
4.4% 4.2%
FY21 FY22 FY23 FY24 FY25 FY26 FY27 FY28 FY29 FY30
and
Beyond
slide 14SALES GROWTH AND TURNOVER RENT
Sales growth strong despite specialties impacted by COVID-19
• Supermarket portfolio MAT1 sales growth has increased by 5.1% (June 2019: 2.0%) Comparable Store MAT1 Sales Growth by Category (%)
– Increased growth during the COVID period, as customers engaged in panic
buying, shopped locally and government restrictions see customers eat and As at As at
entertain at home Total Portfolio
30 June 2020 30 June 2019
• Discount Department Store (DDS) portfolio MAT sales growth increased by 7.6%
(June 2019: 2.2%) Supermarkets 5.1% 2.0%
– Due to panic buying during COVID-19 and high demand for home and living
products DDS 7.6% 2.2%
• Mini Majors portfolio MAT strengthened to 2.9% (June 2019: (3.1)%)
– Discount variety and pharmacies saw increased growth due to panic buying. Mini Majors 2.9% (3.1)%
Additionally, discount variety stores saw high demand for home & living and
arts & crafts categories Specialties (1.1)% 1.8%
• Specialty portfolio MAT sales decreased to (1.1)% (June 2019: 1.8%)
– Non-discretionary categories MAT growth was 0.9%, continuing to outperform Total 4.2% 1.9%
discretionary categories that declined by 7.9% over the year
– Apparel impacted by voluntary closures during COVID-19. Leisure
experiencing growth in demand for gaming and home entertainment Turnover Rent ($m)
– Food catering and retail services impacted by government mandated closures
and restrictions 3.30
Captured in a Base Rent review
– Neighbourhood centres MAT was flat, outperforming sub regional centres 0.2
decreasing (3.1%) over the period Total Portfolio
• Excluding retailers closed due to COVID-19 related trading restrictions and voluntary 2.30
closures, speciality MAT would have improved to 2.5%
• Turnover rent continues to increase: 3.10
– 39 anchor tenants paying turnover rent as at 30 June 2020 (33 supermarkets, 3 2.30
Kmart's and 3 Dan Murphy’s) – represents 35% of portfolio anchors paying 1.20 1.30 1.40
0.90 1.10
turnover rent
– Another 14 supermarkets are within 10% of their turnover thresholds
– 5 anchor tenant turnover rents captured in a base rent review during the year FY14 FY15 FY16 FY17 FY18 FY19 FY20
8 14 15 17 20 34 39
• The sales numbers on this slide are for the total portfolio. Please refer to slide 31 for a
Anchors Anchors Anchors Anchors Anchors Anchors Anchors
breakdown between existing and acquired centres
1. Moving annual turnover sales growth measures the growth in sales over the last 12 months compared to the previous 12 month period slide 15
2. FY19 figures were adjusted from 53 week reporting period to 52 weeks comparable to FY20, with reported growth for existing centres of 3.8% for
supermarkets and 6.8% for DDS and FY19 Acquisitions 0.2% for supermarkets and 2.9% for DDS.SPECIALTY KEY METRICS
Executing our strategy in a challenging retail market exacerbated by COVID-19
• Sustainable rents and occupancy costs for specialty tenants:
– Sales growth declined by (1.1)% due to impact of COVID-19 (June 2019:
+1.8%)
Specialty Tenant Metrics
– Sales productivity increased to $8,229 psm (June 2019: $8,010 psm)
– Our gross rents remain the lowest in the sector at $778 psm Total Portfolio 30 June 2020 30 June 2019
– Occupancy cost reduced to 10.0% (June 2019: 10.1%)
Comparable sales MAT growth (%)1 (1.1)% 1.8%
• In a soft retail market exacerbated by COVID-19 challenges, our strategy remained
Average specialty occupancy cost (%)1 10.0% 10.1%
focused on:
– Maintaining a high retention rate on renewals at 76% (June 2019: 77%) Average specialty gross rent per square
$778 $772
– Reducing specialty vacancy by increasing deal count with a focus on long term metre
vacancies: 146 new deals done (June 2019: 87), a 68% increase in deal count Specialty sales productivity ($ per sqm)1 $8,229 $8,010
for the year despite 4 months of COVID-19 impact
– Continued to remix toward non-discretionary categories
• While average leasing spreads were negative and average incentives were higher, Renewals 30 June 2020 30 June 2019
we have achieved stable occupancy and an improvement in tenancy mix across the
portfolio. We are continuing to achieve 3%-5% annual fixed increases for 88% of Number 232 215
specialty tenants
Retention (%) 76% 77%
• The numbers on this slide are for the total portfolio. Please refer to slide 32 for a GLA (sqm) 31,817 26,455
breakdown between existing and acquired centres
Average uplift (%) (1.1)% (1.7)%
Specialty Lease Composition (as at 30 June 2020)
Incentive (months) 0.5 -
Annual Increase Mechanism Tenant Type
Other, 1%
New Leases 30 June 2020 30 June 2019
CPI, 10%
Number 146 87
National / GLA (sqm) 18,656 12,200
Regional,
Local, 40% 60% Average Uplift (%) (7.7)% 4.9%
Incentive (months) 13.8 11.0
Fixed, 89%
slide 16
1. Sales growth, occupancy cost and sales productivity metrics only include sales reporting tenants trading over 24 months4
GROWTH OPPORTUNITIES
Anthony Mellowes
Chief Executive Officer
slide 17PORTFOLIO MANAGEMENT
One acquisition, one completed development and one disposal in the year to 30 June
2020
ACQUISITION DEVELOPMENT
Warner Marketplace (Warner, QLD) Shell Cove – Stage 3 (Shellharbour,
NSW)
• Acquisition completed in Dec 2019
for $78.4m (5.92% implied fully let
• Stage 3 refers to a main street strip
yield excluding balance of land)
of retail comprising five tenancies
situated directly across from the
• Anchored by Woolworths and Aldi
SCP owned Shell Cove
supermarkets with 37 specialty
Neighbourhood centre
tenancies, 2 Kiosks, 2 ATM’s and 5
freestanding tenancies • Development completed in Dec
2019 for total consideration of $4.8m
• % of income from Anchors: 34% (6.25% implied fully let yield)
• Asset will form part of the existing
• Overall WALE (by income): 6.4 years
Shell Cove Neighbourhood Centre
• Occupancy at acquisition: 96% • Two year rental guarantee for any
vacancy
• Built: 2001; Expanded: 2014
DISPOSAL
Cowes, VIC: Contracts were exchanged on 3 December 2019 for a sale price of $21.5m, reflecting a $1.9m (9.7%) uplift on June 2019 book value (yield of 6.85%). The
transaction settled on 4 February 2020.
PENDING ACQUISITION
In July 2020 we agreed terms to acquire Bakewell in Darwin, NT for $33.0m (excluding transaction costs), an implied fully let yield of 7%, subject to due diligence and
final valuation support. This property is expected to settle in late August 2020.
slide 18CONVENIENCE BASED CENTRES
Fragmented ownership provides acquisition opportunities Indicative
CONVENIENCE BASED CENTRE LANDSCAPE
Ownership of Convenience Based Centres
• There are approximately 1,200 Coles and Woolworths anchored (number of centres)
neighbourhood and sub regional centres in Australia
ISPT VCX
• SCP is the largest owner (by number) of neighbourhood and sub regional CQR Syndicates, Funds
centres in Australia. SCP has an opportunity to continue to consolidate this & Other
SCP Institutions
fragmented segment by utilising its management capability, industry
knowledge and funding ability to source and execute acquisition
opportunities from private and corporate owners
• Since listing SCP has completed the acquisition of 50 neighbourhood and
sub regional centres for over $1.7b and has divested 31 freestanding and
neighbourhood centres for over $500.0m
RECENT TRANSACTIONS Private
• During the year ended 30 June 2020:
– 34 neighbourhood centres changed hands for total consideration of
~$1.3b FY20 Buyers FY20 Sellers
– 4 sub regional centre changed hands for total consideration of
~$460.0m (by value) (by value)
• More institutional sellers, while syndicates and privates remain active on the SCP
buy side for neighbourhood centres Private Investor
4% Syndicates 36%
• SCP acquired one property over the year, making up approximately 4% of Private Investor & Funds
total known transactions over the period 41% 3% SCP
1%
Other
ACQUISITION OUTLOOK Institutions
27%
Syndicates Other
• We will continue to take a disciplined approach to acquisitions: & Funds Institutions
– We have excess capacity following our equity raisings in April/May 28% 60%
2020. We could debt fund approximately $300m of acquisitions and
still keep our gearing below 32.5%
– Demand for quality neighbourhood assets remains strong, with recent
transaction cap rates of less than 6%
slide 19
Source: Management estimatesINDICATIVE DEVELOPMENT PIPELINE
Over $125m of development opportunities identified at 31 of our centres
over the next 5 years1
Estimated Capital Investment (A$m)
DEVELOPMENT TYPE CENTRE(S) FY20 FY212 FY22 FY23 FY24 FY25
Shell Cove, Epping North, Belmont, North Orange, Warner
Centre expansions Marketplace, Wyndham Vale, Northgate, Central Highlands,
5.9 7.1 11.7 18.3 20.1 21.7
Gladstone, Greenbank, Jimboomba, Mackay, Ocean Grove
Supermarket expansions Treendale, West Dubbo
- - - 0.5 4.0
Burnie, Ocean Grove, Oxenford, The Markets, New Town
Plaza, West End Plaza, Riverside, Shoreline, The Gateway,
Centre improvements
Whitsunday SC, Sturt Mall, Meadow Mews, Griffin Plaza, 0.8 22.3 11.1 2.3 2.3 2.3
Warnbro, Sugarworld, Wonthaggi, Northgate, Kingston
Preliminary & Defensive Various
0.1 0.3 0.3 0.3 0.3 0.3
Total
6.8 29.7 23.1 21.4 26.7 24.3
In FY20 Shell Cove Stage 3 was completed. The major projects for FY21 are at The Markets and Epping North
1. The exact timing of future developments, expansions and improvements are subject to prevailing market conditions and regulatory approvals
2. The $10.0m acquisition cost for the additional land at Greenbank occurring in December 2020 has been excluded from the Indicative slide 20
Development PipelineFUNDS MANAGEMENT BUSINESS – AUM $104.8M
Potential to deliver additional earnings growth in the future
• First fund “SURF 1” was launched in October 2015, and has successfully sold the five
assets, consistent with 5-year term set out in the original PDS
– Achieved sales price for the five assets of $69.3m (vs original cost of $60.9m and
June 2019 book value of $68.4m)
– IRR of 11.0%, with potential performance fee of $0.4m to be realised once residual
proceeds are distributed to unitholders
– The wind-up process will be completed during FY21
• Second and third funds performing in line with expectations
Moama Marketplace, NSW (SURF 3)
– “SURF 2” launched in June 2017 with two properties: Katoomba and Mittagong
– Mittagong was sold in June 2020 for $9.7m ($0.1m above 31 Dec 2019 book
value). The proceeds were used to repay a portion of the secured debt
facility and strengthened the balance sheet of SURF 2
– “SURF 3” launched in July 2018 with four properties
– Swansea was sold in July 2020 for $15.6m (in line with 31 Dec 2019 book
value). The proceeds were used to repay a portion of the secured debt
facility and strengthened the balance sheet of SURF 3
• Fee structure for all funds is the same1
– Establishment Fee: 1.5% of total asset value
– Management Fees: 0.7% of total asset value per annum Warrnambool Target, VIC (SURF 3) Woodford Woolworths, QLD (SURF 3)
– Disposal Fee: 1.0% of assets disposed
– Performance Fee: if the equity IRR exceeds 10.0%, SCP will receive 20.0% of the
outperformance
• No new funds are forecast for FY21. We will continue to monitor the retail and institutional
market appetite for new product
• The funds management business will continue to allow SCP to recycle non-core assets,
and utilise its expertise and platform to earn management fees in the future (subject to
market conditions)
Woolworths and Big W, Katoomba (SURF 2)
slide 21
1. SCA may defer fees, or rebate a portion of its fees to wholesale clients, at its discretion5
KEY PRIORITIES AND OUTLOOK
Anthony Mellowes and Mark Fleming
Chief Executive Officer and Chief Financial Officer
slide 22CORE STRATEGY UNCHANGED
Defensive, resilient cashflows to support secure and growing long term distributions to
our unitholders
WEIGHTED TO
FOCUS ON CONVENIENCE- LONG LEASES TO
NON-DISCRETIONARY
BASED RETAIL CENTRES QUALITY ANCHOR TENANTS
RETAIL SEGMENTS
APPROPRIATE GROWTH
CAPITAL STRUCTURE OPPORTUNITIES
slide 23FUTURE IMPACT OF COVID-19
Given current uncertainty, it is not possible to accurately forecast the impact of COVID-
19 on the FY21 results
Monthly Gross Property Income (approximate) ($m)
• Services includes several tenants that are Impact Monthly
from Gross
directly impacted, including travel agents, Income
COVID-19
gyms, nail bars and beauty Category VIC NSW QLD TAS SA WA ($m)
• Other retail includes some tenants that have Apparel 0.2 0.4 0.1 0.1 0.1 0.2 1.1
performed well (eg. leisure and
tobacconists) and others that have Services 0.5 0.7 0.4 0.3 0.2 0.5 2.6
experienced sales declines (eg.
newsagencies and jewellers) Other Retail 0.2 0.4 0.4 0.1 0.1 0.2 1.4
• Food catering includes cafes and
restaurants that have suffered reduced Food Catering 0.5 0.7 0.6 0.2 0.1 0.4 2.5
trade
Fresh Food & Liquor 0.3 0.3 0.4 0.2 - 0.1 1.3
• Within the “green” categories, there are still
some individual tenants that have Pharmacy / Medical 0.4 0.6 0.8 0.2 0.1 0.4 2.5
experienced sales declines
• Anchor tenants of supermarket and Discount Variety 0.1 0.2 0.2 0.1 - 0.1 0.7
discount department stores are performing
strongly Petrol 0.1 0.1 0.1 - - - 0.3
• The recent Victorian lockdowns will have a Anchors 1.9 2.7 2.7 1.3 0.8 1.6 11.0
significant impact on tenant sales in that
State, and will result in increased waivers Total Gross Rent 4.2 6.1 5.7 2.5 1.4 3.5 23.4
and deferrals
Other Income 1.6
Total Gross Property
25.0
Income
Every $5 million of rent lost is equivalent to a 0.5 cpu decrease in FFO per unit
slide 24KEY PRIORITIES AND OUTLOOK
Continue to deliver on strategy in FY21
• Our primary objective over the next 12 months is to ensure that our centres emerge from the COVID-19 pandemic in a
strong position, with sustainable tenants paying sustainable rents
• As such, our focus continues to be to:
– Improve tenancy mix with a bias toward non-discretionary categories
– Maintain high retention rates on renewal; and
OPTIMISING THE – Maintain low specialty vacancy by working pro-actively with our tenants in these challenging times
CORE BUSINESS • This may mean:
– Continuing to offer waivers and deferrals to tenants that are part of our long-term tenancy mix plans; and
– Leasing spreads may remain negative, and incentives may remain elevated
• This will ultimately support our strategy of generating defensive, resilient cash flows to support secure and growing long
term distributions to our unitholders
• Excess capacity to fund growth opportunities following our equity raisings in April/May 2020
GROWTH • Continue to explore value-accretive acquisition opportunities consistent with our strategy and investment criteria
OPPORTUNITIES • Progress our identified development pipeline
• New funds management opportunities as market conditions allow
• We intend to repay the $225.0m MTN in October 2020
• We will continue to actively manage our balance sheet to maintain diversified funding sources with long weighted average
CAPITAL MANAGEMENT debt expiry and a low cost of capital consistent with our risk profile
• Gearing to remain below 35% at this point in the cycle
• Due to the continued uncertainty created by the COVID-19 pandemic we will not provide FY21 guidance at this time
EARNINGS GUIDANCE • We will continue to target a Distribution payout ratio of approximately 100% of AFFO
slide 256
QUESTIONS
slide 267
APPENDICES
slide 27SUSTAINABILITY
We continue to focus on long-term sustainable performance
Our performance in the area of Environment, Social and Governance
(ESG) continues to mature and deliver practical solutions across our
Our Sustainability Objectives
growing portfolio.
SCP achievements during this period: Strengthen the relationships between
our shopping centres and their local
STRONGER
Stronger Communities
1 COMMUNITIES
communities and help improve the
wellbeing and prosperity of those
• Our commitment to the planning and delivery of stronger
communities' campaigns continued across our centres in FY20 communities
• Commenced a sizeable stronger communities' campaign at selected
centres, however due to COVID-19 this was scaled down.
• In discussions with a national charity to identify partnership
opportunities across the portfolio
Environmentally Efficient Centres Reduce the environmental footprint
ENVIRONMENTALLY
• Sustainability focussed capital investment to drive investment in
2 EFFICIENT CENTRES
of our shopping centres, particularly
greenhouse gas emissions through
initiatives that generate acceptable returns reducing energy consumption
• Solar panels and renewable energy utilisation on site
continues to be a focus for SCP
• Intelligent Building Automation Systems for the management
of indoor environments and energy demand including load
shedding capabilities installed
• Ongoing trials for the onsite processing of food organics Manage environmental, social and
waste. Exploring how we can efficiently implement waste governance (ESG) risks that are
RESPONSIBLE
diversion practices across the portfolio for specialty tenants
and common mall area organic waste
3 INVESTMENT
material to investment value and
communicate our performance
Responsible Investment on this
• Review and update of policies to improve transparency on code of
conducts, supply chain practices and modern slavery requirements
• Climate risk assessment across the portfolio complete
• Increased disclosure on SCP’s ESG performance and policies
slide 28LONG TERM LEASES TO WOOLWORTHS,
COLES AND WESFARMERS
Overall Lease Expiry (% of Gross Rent)
• 48.0% of gross rent is generated by anchor tenants (Woolworths 32.0%, Coles
26.8%
11.0%, Wesfarmers 4.0% and Other majors 1.0% on a fully leased basis), with an
Anchor WALE of 9.6 years
• Overall, a 7.4 year portfolio WALE combined with investment grade tenants and
non-discretionary retail categories provides a higher degree of income predictability 12.2%
11.0% 10.4%
9.4%
8.0% 8.0%
5.6%
• 378 specialty renewals and new leases completed in the 12 months to 30 June 4.4% 4.2%
2020 with majority on a 5 year lease term
PORTFOLIO LEASE EXPIRY PROFILE FY21 FY22 FY23 FY24 FY25 FY26 FY27 FY28 FY29 FY30
and
Beyond
WALE Years
Specialty Lease Expiry (% of Specialty Gross
30 June 2020 By Gross Rent By GLA
Rent)
Portfolio WALE 6.4 7.4
20.3%
18.1%
Anchor WALE 10.0 9.6 17.1%
14.8%
12.0%
6.9%
4.1% 3.4%
1.5% 1.8%
FY21 FY22 FY23 FY24 FY25 FY26 FY27 FY28 FY29 FY30
and
Beyond
slide 29ANCHOR TENANTS
30 June 2016 30 June 2017 30 June 2018 30 June 2019 30 June 2020
• All of our centres are currently anchored by either Woolworths
Woolworths Limited
Limited, Coles Group Limited or Wesfarmers Limited retailers
Woolworths 53 54 54 58 59
Big W 8 7 7 9 9
• We are gradually increasing our relative exposure to Coles Dan Murphy's 3 2 2 4 4
and Wesfarmers via acquisitions and divestments. Coles now Masters 1 - - - -
represents 25.0% and Wesfarmers represents 6.0% of our Countdown - - - - -
anchor tenants Total Woolworths Limited 65 63 63 71 72
Coles Group Limited
• Woolworths has announced the separation and potential
Coles Group Limited - - - 28 28
demerger of Endeavour Group. We have 4 Dan Murphy’s and
Total Coles Group Limited - - - 28 28
25 BWS stores accounting for 1.6% of our total gross rent
Wesfarmers Limited
• We have two Target stores: Coles 12 18 20 - -
– Gateway Langwarrin is a 1,500sqm store paying Target 3 2 2 2 2
$262,500pa rent ($175/sqm), and will close in April 2021. Kmart 2 2 2 4 4
We have commenced the process of looking for a Bunnings - 1 1 1 1
replacement
Total Wesfarmers Limited 17 23 25 7 7
– Wonthaggi is a 3,806sqm store paying $646,000pa rent
($170/sqm), and will be converted to a Kmart with lease
Other Anchor Tenants
expiry of December 2029 plus 3 x 5 year options thereafter
Aldi 1 1 1 1 2
Farmer Jacks - - - 1 1
Grand Cinemas - - - 1 1
Total Other Anchor Tenants 1 1 1 3 4
Total Anchor Tenants 83 87 89 109 111
slide 30ASSETS ACQUIRED IN FY19 – KEY METRICS
Sales growth, turnover rent, portfolio occupancy, WALE
Sales MAT Growth Existing Centres FY19 Acquisitions Total Portfolio
Existing Centres:
Supermarkets 5.8% 2.0% 5.1%
• Continue to perform strongly despite COVID-19 related trading DDS 8.9% 5.0% 7.6%
restrictions
Mini-majors 2.8% 3.3% 2.9%
• MAT Sales growth of 5.0% (June 2019: 2.6%), including 5.8% for
Specialty (0.3)% (3.1)% (1.1)%
supermarkets (June 2019: 2.7%).
Total 5.0% 1.3% 4.2%
• Specialty vacancy has increased to 5.2% (June 2019: 4.7%)
Acquired Centres: Turnover Rent Existing Centres FY19 Acquisitions Total Portfolio
• Vicinity acquisition centres part of SCA portfolio for almost two # anchors 28 11 39
years. Remixing strategies in relation to these centres are $ $2.3m $0.8m $3.1m
substantially complete
• MAT Sales growth improved to 1.3% (June 2019: (0.9)%), Portfolio Occupancy Existing Centres FY19 Acquisitions Total Portfolio
including 2.0% supermarkets (June 2019: (0.9)%).
Portfolio occupancy (%) 98.2% 98.2% 98.2%
• Specialty vacancy reduced to 4.6% (June 2019: 7.3%)
Specialty vacancy (%) 5.2% 4.6% 5.1%
• Performance continues to be in line with our expectations
WALE (by GLA) Existing Centres FY19 Acquisitions Total Portfolio
Portfolio 7.9 5.9 7.4
Anchor 10.2 7.6 9.6
slide 31ASSETS ACQUIRED IN FY19 – KEY METRICS
Specialty key metrics
Existing Centres:
Spec Tenant Metrics Existing Centres FY19 Acquisitions Total Portfolio
• Tenant metrics improving vs June 2019 with improvements in
sales productivity, occupancy cost and average gross rent psm. Comparable sales MAT growth (%) 1 (0.3)% (3.1)% (1.1)%
Comparable specialty sales MAT impacted by COVID-19 due to
Average Spec Occupancy Cost 9.3% 11.6% 10.0%
trading restrictions.
Average Gross Rent $PSM 1 $734 $894 $777
• Lease renewal spreads lower at 0.8% (June 2019: 5.3%)
reflecting strategy to maintain sustainable rent and retention rate Sales Productivity $PSM 1 $8,263 $8,147 $8,229
in soft retail market exacerbated by COVID-19.
• New lease spreads lower at (9.6)% (June 2019: 2.4%) and
incentives higher at 14.8 months (June 2019: 11.1 months)
reflecting challenging retail market exacerbated by COVID-19 and Renewals Existing Centres FY19 Acquisitions Total Portfolio
continued focus on leasing of longer term vacancies Number 177 55 232
• Pleasingly we continued to see deal flow despite COVID-19 Retention (%) 79.0% 68.0% 76.0%
challenges, with 39 new leases and 55 renewal deals between GLA (sqm) 25,560 6,256 31,817
March and June 20
Average uplift (%) 0.8% (6.1)% (1.1)%
Acquired Centres: 0.2
Incentive (months) 0.6 0.5
• Tenant metrics reflect the increased impact on trading conditions
in sub regional centres during COVID-19 with sales MAT
down (3.1)% (June 19: 0.0%). Occupancy cost in line with June New Leases Existing Centres FY19 Acquisitions Total Portfolio
19 (11.6% vs at 11.8%)
Number 101 45 146
• Renewal spreads improved to (6.1)% (June 2019: (14.6)%), new
GLA (sqm) 12,557 6,099 18,656
lease spreads lower at (3.2)% (June 2019: 10.6%) and incentives
higher at 11.7 months (June 2019: 10.8 months) Average Uplift (%) (9.6)% (3.2)% (7.7)%
Incentive (months) 14.8 11.7 13.8
• Remixing is substantially complete, and centres operating
“business as usual”
– Portfolio NOI was on track to be in line with acquisition NOI
by FY21, but we are reviewing short term impact of
COVID-19
slide 32
1. Sales growth, occupancy cost and sales productivity metrics only include sales reporting tenants trading over 24 monthsDEBT FACILITIES & INTEREST RATE HEDGING
Facility Limit Drawn Debt Financing capacity Maturity / Notes
$m (A$m) (A$m) (A$m)
Bank Facilities
Bank bilateral 50.0 - 50.0 FY22: Apr 2022
Bank bilateral 175.0 - 175.0 FY23: Dec 2022 $75.0m and Jun 2023 $100.0m
Bank bilateral 25.0 - 25.0 FY24: Dec 2023
Bank bilateral non-revolving 50.0 50.0 - FY24: Jun 2024
Bank bilateral 200.0 - 200.0 FY25: Mar 2025 $50.0m and May 2025 $150.0m (refer below & note 1)
Syndicated non-revolving 100.0 100.0 - FY26: Jun 2026
600.0 150.0 450.0
Medium Term Notes
4
Medium Term Note (#1) 225.0 225.0 - Apr 2021
Medium Term Note (#2) 4 225.0 225.0 - Jun 2024
450.0 450.0 -
DEBT FACILITIES US Private Placement
As at 30 June 2020 US$ denominated2 106.5 106.5 - Aug 2027
US$ denominated3 39.4 39.4 - Sep 2028
2
US$ denominated 53.3 53.3 - Aug 2029
A$ denominated 50.0 50.0 - Aug 2029
US$ denominated3 92.1 92.1 - Sep 2031
US$ denominated3 65.8 65.8 - Sep 2033
407.1 407.1 -
Total unsecured financing facililties 1,457.1 1,007.1 450.0
Add: cash and term deposits - 183.8 183.8
5
Net debt 1,457.1 823.3 633.8
1
Less: Debt facilities used for bank guarantees (11.0) May 2025; facility used for bank guarantees (refer note 1)
Total debt facilities available plus cash and term deposits 622.8 Net financing capacity of $622.8m
Due to expiry of $225m MTN in FY21 Made up of: $225.0m MTN (expiry
(coupon 3.75%) decrease in fixed Jun ’24 ) and $300.0m IRS (expiry
INTEREST RATE average cost from 2.88% to 2.50% Jul ’25 / Jul’26 / Jul’ 27)
FIXED /
HEDGING PROFILE
1. Bank guarantees of $11.0m are for the Group’s compliance with its Australian Financial Services Licences
2. USPP 2014 denominated repayment obligations have been fully hedged at A$ / US$ rate of 0.9387
3. USPP 2018 denominated repayment obligations have been fully hedged at A$ / US$ rate of 0.7604
4. The Group has two A$MTN issues. The first A$MTN (expiry April 2021 which can be repaid from October 2020 with no make whole) has a face value of slide 33
$225.0m and coupon of 3.75%. The second A$MTN (expiry June 2024) has a face value of $225.0m and a coupon of 3.90%
5. Drawn debt (net of cash) of $823.3m is made up of: statutory debt of $1,083.6m less $78.2m being the revaluation of the USPP US$ denominated debt
from statutory value of $435.3m (using the prevailing June 2020 spot exchange rate) to restate the USPP to its hedged value of A$357.1m plus
unamortised debt fees and MTN discount of $1.7m less $183.8m cash and term depositsACQUISITIONS AND DIVESTMENTS DURING THE YEAR
30 June 2020
Total
Anchor Specialty Total Implied
Acquisition % GLA Purchase
Centre Type GLA GLA GLA Fully Let
Date Committed Price
(sqm) (sqm) (sqm) Yield
($m)
Acquired Properties
Warner Marketplace Neighbourhood Dec 2019 6,164 5,306 11,470 96% 78.4 5.92%
Anchor Specialty Total Total Sale
Divestment % GLA Divestment
Centre Type GLA GLA GLA Price
Date Committed Cap Rate
(sqm) (sqm) (sqm) ($m)
Divested Properties
Cowes Neighbourhood Feb 2020 3,495 1,325 4,820 98% 21.5 6.85%
slide 34PORTFOLIO LIST (I)
Valuation
Completion Total GLA Occupancy Number of WALE Valuation June 2020
Property State Property Type Anchor Tenant(s) Date (sqm) (% by GLA) Specialties (Years by GLA) Cap Rate (A$m)
Lavington Square NSW Sub-Regional WOW; Big W 2005 20,236 98.0% 57 4.0 7.50% 57.4
Sturt Mall NSW Sub-Regional Coles; Kmart 2011 15,326 98.1% 49 3.1 6.50% 72.3
West End Plaza NSW Sub-Regional Coles; Kmart 2009 15,876 100.0% 44 5.7 6.50% 67.7
Lilydale VIC Sub-Regional WOW; Big W; Aldi 2013 21,737 99.6% 60 10.0 6.25% 110.0
Pakenham VIC Sub-Regional WOW; Big W 2011 16,925 99.3% 44 6.0 6.50% 83.7
Central Highlands QLD Sub-Regional WOW; Big W 2012 18,049 99.3% 34 9.6 7.75% 60.0
Mt Gambier SA Sub-Regional WOW; Big W; Bunnings 2012 27,723 97.4% 37 11.0 6.50% 71.3
Murray Bridge SA Sub-Regional WOW; Big W 2011 18,771 96.5% 54 5.8 7.50% 60.0
Kwinana Marketplace WA Sub-Regional Coles; WOW; Big W; Dan Murphy's 2012 32,952 96.6% 76 10.2 7.00% 130.6
Warnbro WA Sub-Regional Coles; WOW; Big W 2014 21,434 96.6% 63 7.9 7.00% 90.9
Belmont Central NSW Neighbourhood WOW 2008 7,868 94.3% 21 6.9 7.03% 29.0
Berala NSW Neighbourhood WOW 2012 4,013 100.0% 6 11.6 5.50% 28.6
Cabarita NSW Neighbourhood WOW 2013 3,426 100.0% 11 10.4 6.25% 22.0
Cardiff NSW Neighbourhood WOW 2010 5,848 100.0% 14 11.9 6.25% 25.3
Clemton Park NSW Neighbourhood Coles 2017 7,021 96.2% 22 11.3 6.00% 51.3
Goonellabah NSW Neighbourhood WOW 2012 5,115 98.1% 10 9.9 6.75% 20.0
Greystanes NSW Neighbourhood WOW 2014 6,005 100.0% 28 9.7 5.75% 59.6
Griffin Plaza NSW Neighbourhood Coles 1997 7,227 95.2% 30 4.2 6.75% 25.8
Lane Cove NSW Neighbourhood WOW 2009 6,721 100.0% 13 10.7 5.75% 57.5
Leura NSW Neighbourhood WOW 2011 2,546 100.0% 6 11.3 5.75% 18.5
Lismore NSW Neighbourhood WOW 2015 6,836 91.5% 24 10.8 7.50% 28.1
Macksville NSW Neighbourhood WOW 2010 3,446 100.0% 5 12.6 6.00% 14.3
Merimbula NSW Neighbourhood WOW 2010 5,012 98.6% 10 10.9 6.50% 18.2
Morisset NSW Neighbourhood WOW 2010 4,137 100.0% 8 7.1 6.75% 18.5
Muswellbrook Fair NSW Neighbourhood Coles 2015 9,007 98.7% 22 3.3 6.50% 31.9
Northgate NSW Neighbourhood Coles 2014 4,126 100.0% 13 3.5 6.50% 17.5
North Orange NSW Neighbourhood WOW 2011 4,844 99.5% 14 12.1 6.25% 34.0
Shell Cove NSW Neighbourhood WOW 2018 4,881 96.7% 8 15.6 6.00% 34.0
Ulladulla NSW Neighbourhood WOW 2012 5,282 96.6% 10 12.8 6.00% 24.7
West Dubbo NSW Neighbourhood WOW 2010 4,205 99.5% 10 10.1 6.25% 19.0
Albury VIC Neighbourhood WOW 2011 4,952 100.0% 14 10.8 6.50% 23.5
Ballarat VIC Neighbourhood Dan Murphy's; Big W 2000 8,963 100.0% 4 1.4 7.00% 17.2
Bentons Square VIC Neighbourhood WOW; Dan Murphy's 2009 9,997 99.3% 45 6.1 6.25% 82.6
Drouin VIC Neighbourhood WOW 2008 3,779 100.0% 4 7.5 5.75% 16.2
Epping North VIC Neighbourhood WOW 2011 5,259 100.0% 16 10.5 5.75% 30.0
Highett VIC Neighbourhood WOW 2013 5,476 100.0% 13 12.0 5.50% 30.1
Langwarrin VIC Neighbourhood WOW 2004 5,094 100.0% 16 4.0 5.75% 23.9
Ocean Grove VIC Neighbourhood WOW 2004 6,911 96.1% 21 4.1 6.25% 37.1
The Gateway VIC Neighbourhood Coles 2012 10,846 98.6% 41 4.1 6.75% 51.7
Warrnambool East VIC Neighbourhood WOW 2011 4,319 100.0% 6 7.4 6.25% 15.7
Wonthaggi VIC Neighbourhood Coles; Target 2012 11,831 99.4% 23 5.6 7.25% 40.0
Wyndham Vale VIC Neighbourhood WOW 2009 6,650 100.0% 10 8.8 5.75% 23.4
slidePORTFOLIO LIST (II)
Valuation
Completion Total GLA Occupancy Number of WALE Valuation June 2020
Property State Property Type Anchor Tenant(s) Date (sqm) (% by GLA) Specialties (Years by GLA) Cap Rate (A$m)
Annandale Central QLD Neighbourhood Coles 2007 6,655 99.1% 20 5.0 7.50% 26.1
Ayr QLD Neighbourhood Coles 2000 5,455 97.8% 8 4.8 7.00% 19.0
Brookwater Village QLD Neighbourhood WOW; 2013 6,755 100.0% 11 8.8 6.25% 35.1
Bushland Beach QLD Neighbourhood Coles 2018 4,567 99.3% 9 10.3 6.75% 22.5
Carrara QLD Neighbourhood WOW 2011 3,717 100.0% 6 7.6 6.50% 17.1
Chancellor Park Marketplace QLD Neighbourhood WOW 2001 5,859 100.0% 18 12.0 6.00% 45.9
Collingwood Park QLD Neighbourhood WOW 2009 4,567 100.0% 10 11.8 6.50% 11.8
Coorparoo QLD Neighbourhood WOW 2012 5,588 97.1% 14 11.1 5.75% 36.9
Gladstone QLD Neighbourhood WOW 2012 5,215 99.3% 13 9.3 7.00% 24.5
Greenbank QLD Neighbourhood WOW 2008 5,696 100.0% 17 7.2 6.25% 21.8
Jimboomba Junction QLD Neighbourhood Coles 2008 5,930 95.6% 21 3.4 6.50% 27.8
Lillybrook Shopping Village QLD Neighbourhood Coles 2004 6,996 98.8% 21 6.3 6.00% 28.7
Mackay QLD Neighbourhood WOW 2012 4,167 100.0% 9 10.9 6.75% 25.5
Marketplace Warner QLD Neighbourhood WOW; Aldi 2001 11,470 97.4% 44 9.1 5.75% 76.2
Marian Town Centre QLD Neighbourhood WOW 2014 6,707 96.4% 19 8.6 7.00% 32.5
Miami One QLD Neighbourhood Coles 2007 4,676 99.7% 35 4.0 6.50% 30.7
Mission Beach QLD Neighbourhood WOW 2008 3,904 97.8% 9 6.6 6.50% 11.6
Mt Warren Park QLD Neighbourhood Coles 2005 3,843 98.5% 11 8.0 6.00% 17.8
Mudgeeraba Market QLD Neighbourhood WOW 2008 6,143 97.9% 39 6.4 6.25% 33.7
North Shore Village QLD Neighbourhood Coles 2003 4,072 97.8% 14 6.4 6.00% 27.3
Oxenford QLD Neighbourhood WOW 2001 5,815 100.0% 17 5.9 6.00% 33.4
Sugarworld Shopping Centre QLD Neighbourhood Coles 2015 4,759 89.8% 12 10.8 6.75% 25.4
The Markets QLD Neighbourhood Coles 2002 5,253 86.9% 22 4.6 7.25% 29.4
Whitsunday QLD Neighbourhood Coles 1986 7,660 92.5% 34 4.8 7.50% 33.8
Worongary Town Centre QLD Neighbourhood Coles 2004 6,899 96.9% 43 3.6 6.00% 46.8
Blakes Crossing SA Neighbourhood WOW 2011 5,078 100.0% 13 6.6 6.75% 22.2
Walkerville SA Neighbourhood WOW 2013 5,263 99.1% 14 11.3 6.00% 26.0
Busselton WA Neighbourhood WOW 2012 5,432 98.8% 5 12.2 6.00% 26.7
WOW; Dan Murphy's; Farmer Jacks;
Currambine Central WA Neighbourhood 2016 17,032 99.3% 42 6.3 7.00% 90.4
Grand Cinemas
Kalamunda Central WA Neighbourhood Coles 2002 8,352 99.3% 40 3.9 6.00% 41.8
Stirlings Central WA Neighbourhood WOW 2013 8,446 92.7% 35 7.2 7.00% 40.6
Treendale WA Neighbourhood WOW 2012 7,319 96.6% 19 5.1 6.50% 30.5
Burnie TAS Neighbourhood Coles; Kmart 2006 8,572 100.0% 10 5.6 7.50% 22.5
Claremont Plaza TAS Neighbourhood WOW 2014 8,044 100.0% 26 7.3 6.50% 38.5
Glenorchy Central TAS Neighbourhood WOW 2007 7,090 100.0% 14 4.5 6.75% 27.1
Greenpoint TAS Neighbourhood WOW 2007 5,955 100.0% 11 2.2 7.00% 17.5
Kingston TAS Neighbourhood Coles 2008 4,958 100.0% 16 6.3 6.30% 31.0
Meadow Mews TAS Neighbourhood Coles 2003 7,670 100.0% 31 4.6 6.50% 63.5
New Town Plaza TAS Neighbourhood Coles; Kmart 2002 11,385 100.0% 12 1.2 6.50% 43.6
Prospect Vale TAS Neighbourhood WOW 1996 6,048 95.7% 19 10.8 6.75% 29.2
Riverside TAS Neighbourhood WOW 1986 3,107 100.0% 7 9.1 10.00% 5.2
Shoreline TAS Neighbourhood WOW 2001 6,291 100.0% 17 slide 2.1 6.25% 37.6
Sorell TAS Neighbourhood Coles 2010 5,450 100.0% 13 8.1 6.25% 29.9
TOTAL OWNED PORFOTLIO 674,525 98.2% 1,839 7.4 6.51% 3,138.2PORTFOLIO LIST (III)
WALE Valuation
Total GLA Occupancy Number of (Years by Valuation June 2020
Property State Property Type Anchor Tenant(s) Completion Date (sqm) (% by GLA) Specialties GLA) Cap Rate (A$m)
Properties Under Management - SURF 1
All assets have been sold and this vehicle will be wound up in FY21
Properties Under Management - SURF 2
Katoomba Marketplace NSW Freestanding WOW; Big W 2014 9,719 100.0% 0 15.3 6.50% 47.0
Properties Under Management - SURF 3
Moama Marketplace NSW Neighbourhood WOW 2007 4,518 99.7% 8 12.4 7.00% 14.3
Swansea NSW Neighbourhood WOW 2012 3,677 98.2% 5 13.7 5.75% 15.6
Warrnambool Target VIC Neighbourhood Target 1990 6,808 97.2% 11 3.9 9.00% 12.3
Woodford QLD Neighbourhood WOW 2010 3,672 100.0% 4 6.5 6.25% 13.4
TOTAL MANAGED PORTFOLIO 28,394 99.1% 28 10.7 6.72% 102.6
slide 37CONTACT DETAILS AND DISCLAIMER
For further information please contact:
Anthony Mellowes Mark Fleming
Chief Executive Officer Chief Financial Officer
T: +61 2 8243 4900 T: +61 2 8243 4900
E: anthony.mellowes@scaproperty.com.au E: mark.fleming@scaproperty.com.au
Disclaimer
This presentation has been prepared by Shopping Centres Australasia Property Group RE Limited (ABN 47 158 809 851) (SCPRE) as responsible entity of Shopping Centres
Australasia Property Management Trust (ARSN 160 612 626) (SCA Management Trust) and responsible entity of Shopping Centres Au stralasia Property Retail Trust (ARSN 160 612
788) (SCA Management Trust) (together, SCA Property Group or the Group). This presentation should be read in conjunction with the Financial Report published on the same date.
Information contained in this presentation is current as at the date of release. This presentation is provided for informatio n purposes only and has been prepared without taking account
of any particular reader's financial situation, objectives or needs. Nothing contained in this presentation constitutes inves tment, legal, tax or other advice. Accordingly, readers should,
before acting on any information in this presentation, consider its appropriateness, having regard to their objectives, finan cial situation and needs, and seek the assistance of their
financial or other licensed professional adviser before making any investment decision.
This presentation does not constitute an offer, invitation, solicitation or recommendation with respect to the subscription f or, purchase or sale of any security, nor does it form the basis
of any contract or commitment. Except as required by law, no representation or warranty, express or implied, is made as to th e fairness, accuracy or completeness of the information,
opinions and conclusions, or as to the reasonableness of any assumption, contained in this presentation.
The forward looking statements included in this presentation involve subjective judgment and analysis and are subject to sign ificant uncertainties, risks and contingencies, many of
which are outside the control of, and are unknown to, the Group. In particular, they speak only as of the date of these mater ials, they assume the success of the Group’s business
strategies, and they are subject to significant regulatory, business, competitive and economic uncertainties and risks. Actual future events may vary materially from forward looking
statements and the assumptions on which those statements are based. Given these uncertainties, readers are cautioned not to p lace undue reliance on such forward looking
statements. Past performance is not a reliable indicator of future performance.
By reading this presentation and to the extent permitted by law, the reader releases each entity in the Group and its affilia tes, and any of their respective directors, officers, employees,
representatives or advisers from any liability (including, without limitation, in respect of direct, indirect or consequentia l loss or damage or loss or damage arising by negligence) arising
in relation to any reader relying on anything contained in or omitted from this presentation.
The Group, or persons associated with it, may have an interest in the securities mentioned in this presentation, and may earn fees as a result of transactions described in this
slide
presentation or transactions in securities in SCP. All values are expressed in Australian dollars unless otherwise indicated. All references to “units” are to a stapled SCP security
comprising one unit in the SCA Retail Trust and one unit in the SCA Management Trust.You can also read