FIRST HALF FY21 RESULTS PRESENTATION - 8 February 2021 - Auburn Central, NSW - SCA ...

Page created by Lynn Duran
 
CONTINUE READING
FIRST HALF FY21 RESULTS PRESENTATION - 8 February 2021 - Auburn Central, NSW - SCA ...
FIRST HALF
FY21 RESULTS
PRESENTATION
8 February 2021

                  slide

                          Auburn Central, NSW
FIRST HALF FY21 RESULTS PRESENTATION - 8 February 2021 - Auburn Central, NSW - SCA ...
AGENDA
1. OVERVIEW OF FIRST HALF FY21 RESULTS
2. FINANCIAL PERFORMANCE
3. OPERATIONAL PERFORMANCE
4. GROWTH OPPORTUNITIES
5. KEY PRIORITIES AND OUTLOOK
6. QUESTIONS
7. APPENDICES

                                         slide
FIRST HALF FY21 RESULTS PRESENTATION - 8 February 2021 - Auburn Central, NSW - SCA ...
1
OVERVIEW OF
FIRST HALF
FY21 RESULTS
Anthony Mellowes
Chief Executive Officer

                          slide 3
FIRST HALF FY21 RESULTS PRESENTATION - 8 February 2021 - Auburn Central, NSW - SCA ...
FIRST HALF FY21 HIGHLIGHTS

               FINANCIAL                                                                CAPITAL                                                         ACTIVE PORTFOLIO
             PERFORMANCE                                                              MANAGEMENT                                                          MANAGEMENT

                  Net Profit After Tax1                                                         Gearing 3                                     Portfolio occupancy 6 Specialty vacancy 6
         $102.9m, up by 14.1%                                                       29.1%, up by 3.5%                                                 98.2%                             4.8%

                      FFO per unit 2                                                                                                               Portfolio weighted average cap rate 7
                                                                                             NTA per unit 4
     6.72 cpu, down by 20.4%                                                        $2.25, up by 1.4%                                                                 6.39%
              (up by 8.2% vs 2H FY20)

                 Distribution per unit 2
                                                                         Weighted cost of               Weighted average
     5.70 cpu, down by 24.0%                                                 debt 5                      debt maturity 5
                                                                                                                                                                    Acquisitions 8
             (up by 14.0% vs 2H FY20)
                                                                            3.2% pa                          6.2 yrs                                               $178.9m

1.   Net Profit After Tax is as per the Interim Financial Report, for the six months ended 31 December 2020 compared to the six months ended 31 December 2019
2.   FFO per unit is a non-IFRS measure, for the six months ended 31 December 2020 compared to the six months ended 31 December 2019. Distribution of 5.70 cpu in respect of the six months ended 31
     December 2020 was paid on 29 January 2021. “cpu” stands for Cents Per Unit
3.   As at 31 December 2020, compared to 30 June 2020. Gearing is calculated as Finance debt, net of cash (with USD denominated debt recorded as the hedged AUD amount) divided by total tangible assets (net
     of cash and derivatives)
4.   As at 31 December 2020, compared to 30 June 2020
5.   As at 31 December 2020. The corresponding numbers as at 30 June 2020 were weighted cost of debt of 3.5% and weighted average debt maturity of 5.1 years
6.   As at 31 December 2020. The corresponding numbers as at 30 June 2020 were portfolio occupancy of 98.2% and specialty vacancy of 5.1%
7.   As at 31 December 2020. Weighted average capitalisation rate as at 30 June 2020 was 6.51%
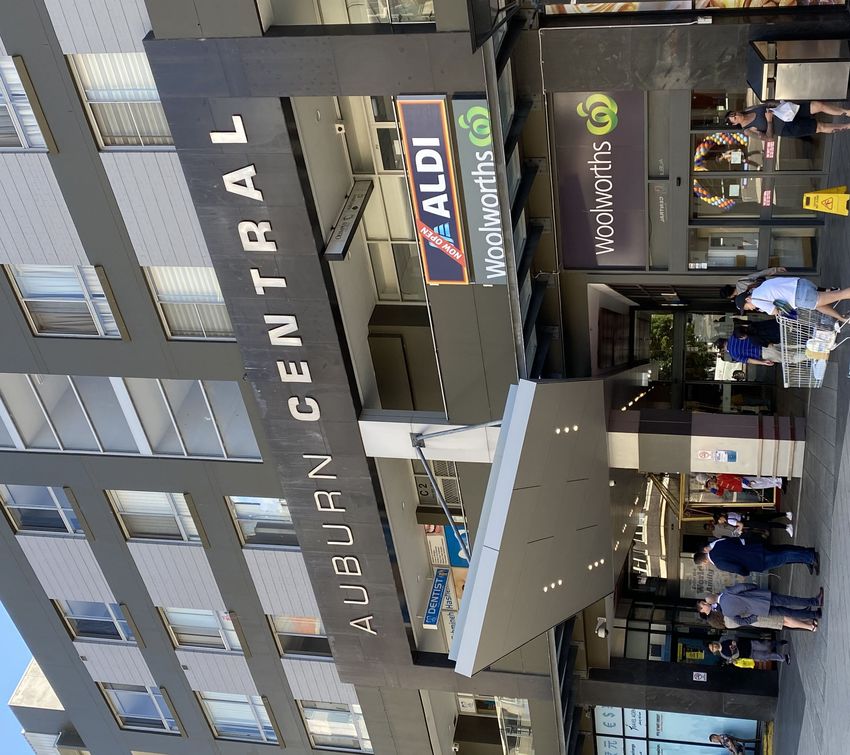
8.   During the period we acquired Auburn Central (New South Wales) for $129.5m, Bakewell Shopping Centre (Northern Territory) for $33.0m, Bakewell petrol station (Northern Territory) for $6.4m and vacant land
     adjacent to the Greenbank (Queensland) neighbourhood centre for $10.0m, excluding transaction costs.

                                                                                                                                                                   slide 4
FIRST HALF FY21 RESULTS PRESENTATION - 8 February 2021 - Auburn Central, NSW - SCA ...
KEY ACHIEVEMENTS
Our centres are trading strongly
                     •   Throughout the COVID-19 pandemic, our convenience-based centres have benefited from the shift to shopping locally
                           – Anchor tenants have experienced strong sales growth and turnover rent has increased
                           – Specialty sales have recovered following the easing of restrictions
                           – We have continued to complete leasing deals, with 96 renewals and 63 new lease deals and 70 non-code lease
                               extensions completed during period
                     •   COVID-19 has impacted some of our specialty tenants
                           – While most specialty tenants have experienced significant sales growth, three categories have been adversely affected
  OPTIMISING THE               being Apparel, Cafes/Restaurants and some Retail Services
  CORE BUSINESS            – We have provided rental assistance to over 800 tenants
                           – Total cash collection rates stabilised at around 99% by the end of the period
                     •   We have continued to progress our sustainability program, including:
                           – Stronger communities: commenced a new partnership with The Smith Family
                           – Environmentally efficient centres: continued to invest in energy saving initiatives, including efficient lighting rollout and
                               building automation systems
                           – Responsible investing: increased focus on ESG aspiration and strategy

                     •   Acquisitions of Auburn Central for $129.5m, Bakewell Shopping Centre and petrol station for $39.4m and vacant land
                         adjacent to the Greenbank neighbourhood centre for $10.0m were completed during the period
     GROWTH          •   In December 2020 we agreed terms to acquire Katoomba Marketplace for $55.1m from SURF 2 and in January 2021 we
                         agreed terms to acquire Cooloola Cove Shopping Centre for $18.6m. Settlement of both transactions is expected to occur in
  OPPORTUNITIES          February 2021
                     •   Wind-up of SURF 2 is expected to occur during 2H FY21, estimated to achieve an IRR of 12% for unitholders since the fund
                         commenced in 2016

                     •   Balance sheet remains in a strong position
     CAPITAL               – Gearing of 29.1% is below our target range of 30-40%
   MANAGEMENT              – Weighted average cost of debt is 3.2% with a weighted average term to maturity of 6.2 years
                           – Cash and undrawn facilities of $201.9m

    EARNINGS         •   1H FY21 FFO per unit of 6.72 cpu represents a decrease of 20.4% vs 1H FY20, but an increase of 8.2% vs 2H FY20
                     •   1H FY21 Distributions of 5.70 cpu represents a decrease of 24.0% vs 1H FY20, but an increase of 14.0% vs 2H FY20
 & DISTRIBUTIONS
                                                                                                                    slide 5
FIRST HALF FY21 RESULTS PRESENTATION - 8 February 2021 - Auburn Central, NSW - SCA ...
2
FINANCIAL PERFORMANCE
Mark Fleming
Chief Financial Officer

                          slide 6
FIRST HALF FY21 RESULTS PRESENTATION - 8 February 2021 - Auburn Central, NSW - SCA ...
IMPACT OF COVID-19
Strong sales growth continuing, and cash collection rates improving
Sales growth trends                                                                                    40%         Month-on-month sales growth (%) 1

•    Sales growth has been volatile throughout the COVID-19 period                                     30%
       –   Australia-wide restrictions significantly impacted tenant sales
           between March and May 2020
                                                                                                       20%
       –   Restrictions significantly impacted sales in Victoria between August
           and October 2020                                                                                                                                                                                             12.1%
                                                                                                       10%                                                                                                               9.9%
•    Sales growth rates have stabilised in November and December 2020 for                                                                                                                                                6.7%
     most categories at well above historical levels                                                    0%
                                                                                                              Jan-20   Feb-20   Mar-20    Apr-20   May-20   Jun-20    Jul-20   Aug-20    Sep-20    Oct-20   Nov-20   Dec-20
       –   Apparel, Cafes/Restaurants and some Retail Services remain
           relatively weaker due to ongoing COVID-19 related restrictions                             (10%)
       –   No significant differences by state
                                                                                                      (20%)

                                                                                                      (30%)
                                                                                                                                     Supermarkets                    DDS                 Specialties
Cash collection trends

•    Total cash collection rates have stabilised at around 99%                                                  Cash collection as a % of gross contracted rent 2
                                                                                                                 101%                                         98%           99%         98%        99%       99%         100%
                                                                                                                                                    95%
•    However, rents are taking longer to collect, with only around 85% of rents                                  16%                                          23%          22%          17%        14%        14%        14%
                                                                                                                                         80%        35%
     collected within 30 days                                                                                    85%        69%                                                                    85%        85%        86%
        –   Prior to COVID-19 we would expect at least 90% of rents to be paid                                                           23%                                            81%
                                                                                                                            8%                                75%          77%
            within 30 days
                                                                                                                           61%                      60%
                                                                                                                                         57%
•    Some of the rent collected during 1H FY21 relates to FY20 invoices

                                                                                                               Mar 20     Apr 20      May 20       Jun 20    Jul 20     Aug 20       Sep 20       Oct 20    Nov 20     Dec 20

                                                                                                                        Collected in the month invoices                 Collections relating to previous months

1.   Month-on-month sales growth compares like-for-like stores for the relevant month compared to the same month in the prior year
2.   Cash collection is calculated as total rental receipts as a percentage of total rental invoiced                                                                       slide 7
FIRST HALF FY21 RESULTS PRESENTATION - 8 February 2021 - Auburn Central, NSW - SCA ...
IMPACT OF COVID-19
The earnings impact of COVID-19 is starting to reduce
COVID-19 Impact on AFFO
                                                                               Estimated COVID-19 Impact on 1HY FY21
•   The estimated impact of COVID-19 on the 1H FY21 results is
    approximately $6.9 million:                                                                                                     Other Direct COVID-19      1H FY21 AFFO COVID-19
      –   Waived rent of $4.8m during the period (FY20: $4.5m). Waived            Waived Rent         Incremental ECL Allowance            Impacts                  Direct Impact
          rent is not included in rental income or receivable. Incremental
          deferrals of $2.5m during the period (FY20: $4.3m) are included in
          rental income and receivable offset by an ECL allowance of the                                        1.7
          same amount
      –   Expected credit loss allowance (“ECL”) has reduced by $2.4m
          (from $15.3m at 30 June 2020 to $12.9m at 31 December 2020).
          Of this movement, $0.7m was written off (no P&L impact), and the           (4.8)
          remaining $1.7m reduced property expenses. The ECL allowance
          has reduced because increased allowances for deferred and                                                                           (3.8)                         (6.9)
          unpaid rent during 1H FY21 were offset by greater than expected
          collections of FY20 unpaid rent
      –   Other direct COVID-19 impacts include additional expenses (eg.       AFFO Per Unit (cpu)
          cleaning, security), rent freezes required by law, lower rent
          reversions and reduced other income (eg. casual leasing),
                                                                                                                                  0.4                                     0.3
          partially offset by increased turnover rent from supermarkets                                                                                                   0.7
                                                                                                                                  2.1                                     0.7
AFFO Per Unit (cpu) trend

•   The estimated COVID-19 impact on AFFO is reducing:
       –   Estimated impact of $6.9 million (0.7cpu) in 1H FY21 was less                     7.5
           than the $20.5 million (2.1cpu) in 2H FY20                                                                                                                     5.8
                                                                                                                                  5.0
       –   Other impacts include increases in leasing capital expenditure,
           decreased funds management income and increased corporate
           costs
•   The proceeds from the $279.3 million equity raise in April/May 2020 will
    continue to be redeployed into acquisitions:                                         1H FY20                             2H FY20                               1H FY21
       –   As at 31 December 2020 we had redeployed $178.9m
                                                                                      AFFO         COVID-19 estimated impact            Equity raise estimated dilution         Other
       –   As at 31 December 2020 our gearing was 29.1%
•   When the impact of the COVID-19 pandemic has ended, and when we
    have fully redeployed the equity raising proceeds, we would expect to
    return to the pre-COVID level for AFFO per unit (and therefore
                                                                                                                                          slide 8
    Distributions per unit) of at least 7.5cpu per half year (or 15.0cpu pa)
FIRST HALF FY21 RESULTS PRESENTATION - 8 February 2021 - Auburn Central, NSW - SCA ...
PROFIT & LOSS
                                                                                                                                                                                 6 months to
For the six months ended 31 December 2020                                                                                                                                     31 Dec    31 Dec
                                                                                                                    $m                                                         2020      2019    % Change
                                                                                                                    Anchor rental income                                       65.9       63.5     3.8%
•    Net property income decrease is primarily due to COVID-19 related impacts and an
     increase in straight-lining expense                                                                            Specialty rental income                                    57.0      64.4     (11.5%)
        –  Property expenses includes the decreased expected credit loss (“ECL”)                                    Recoveries and recharge revenue                            17.5      17.4      0.6%
           allowance of $1.7m (1H FY20 increased ECL $0.2m). A detailed explanation of
           the ECL calculation is set out in note 3 of the Interim Financial Statements                             Other income                                               2.3       5.2      (55.8%)
                                                                                                                    Straight lining and amortisation of incentives             (6.3)     (4.7)    34.0%
•    Distribution income relates to our CQR unitholding. Our unitholding has remained
     constant but the distribution per unit was reduced compared to the same period last year                       Gross property income                                     136.4     145.8     (6.4%)
                                                                                                                    Property expenses                                         (48.1)    (46.6)     3.2%
•    Funds management income has decreased due to winding up of SURF 1 and the sale of
     certain assets in SURF 2 and SURF 3, but the current period includes $0.5m of                                  Property expenses / Gross property income (%)   1
                                                                                                                                                                              33.7%     31.0%      8.7%
     performance fee from SURF 1 and $0.2m of disposal fee from SURF 2
                                                                                                                    Net property income                                        88.3      99.2     (11.0%)
•    Corporate costs increase primarily due to increase in D&O insurance                                            Distribution income from CQR                               0.7       1.0      (30.0%)
                                                                                                                    Funds management income from SURF funds                    0.9       1.3      (30.8%)
•    Fair value adjustments:
        –   Investment properties: like-for-like valuation increased due to capitalisation rate                     Net operating income                                       89.9     101.5     (11.4%)
            tightening, valuation NOI increase, and a reduction in COVID-19 one off rent relief
                                                                                                                    Corporate costs                                            (7.9)     (6.8)    16.2%
            adjustments
        –   Derivatives: USPP cross-currency derivative mark-to-market value decreased                              Fair value of investment properties                        63.0      13.6       nm
            due to A$ strengthening and lower yield curve
                                                                                                                    Fair value of derivatives                                 (74.7)     0.7        nm
        –   Unrealised foreign exchange gain: decrease in the A$ value of our US$ debt due
            to A$ strengthening                                                                                     Unrealised foreign exchange gain                           46.5      0.5        nm
        –   Share of net profit from associates: relates to SURF 2 & 3 co-investment stakes                         Share of net profit from associates (SURF
                                                                                                                                                                               3.3       0.4        nm
                                                                                                                    Funds)
•    Net interest expense:
       –    Average net debt relatively stable with December 2019 but cost of debt has                              EBIT                                                      120.1     109.9      9.3%
            decreased to 3.2% as at December 2020 (vs December 2019 of 3.4%) due                                    Net interest expense                                      (16.9)    (19.3)    (12.4%)
            mainly to repayment of the $225.0m MTN with a coupon of 3.75% and lower base
            rates                                                                                                   Tax expense                                                (0.3)     (0.4)    (25.0%)
                                                                                                                    Net profit after tax                                      102.9      90.2     14.1%

                                                                                                                                                                    slide 9

1.   For the purpose of this ratio, gross property income excludes straight lining and amortisation of incentives
FIRST HALF FY21 RESULTS PRESENTATION - 8 February 2021 - Auburn Central, NSW - SCA ...
FUNDS FROM OPERATIONS
For the six months ended 31 December 2020                                                                                                      31 Dec
                                                                                                                                                            6 months to
                                                                                                                                                              30 June     31 Dec
                                                                                           $m
                                                                                                                                                2020           2020        2019
•   Funds From Operations (“FFO”) of $72.3m is down by 7.9% compared to the same           Net profit after tax (statutory)                     102.9          (4.7)       90.2
    period last year, primarily due to COVID-19 impacts offsetting the contribution from
    acquisitions
                                                                                           Adjustment for non cash items
•   Adjusted FFO (“AFFO”) of $62.4m is down by 11.0% compared to the same period           Reverse: Straight lining & amortisation                  6.3         3.4        4.7
    last year
       –   Maintenance capex has increased due to portfolio age and size while new         Reverse: Fair value adjustments
           lease incentives have slightly decreased due to lower number of deals and       - Investment properties                                 (63.0)     101.5       (13.6)
           lower average incentives                                                        - Derivatives                                            74.7      (50.7)       (0.7)
                                                                                           - Foreign exchange                                      (46.5)      8.6         (0.5)
•   Weighted average units on issue increased primarily due to the equity raisings in
    April and May 2020
                                                                                           Other adjustments
•   FFO per unit (“EPU”) decreased primarily due to:                                       - Other non cash items                                   0.6         1.6        (2.1)
      –  COVID-19 impacts of approximately $6.9m (or 0.7cpu);                              - Net unrealised (profit)/loss from SURF funds          (2.7)        1.1         0.5
      –  Impact of the April and May 2020 equity raisings of approximately 0.7cpu; and
      –  Other earnings reductions amounting to approximately 0.3cpu, being reduced        - Transaction costs                                       -          1.5          -
         funds management income, reduced distribution income, increased corporate         FFO                                                     72.3        62.3        78.5
         costs, decreased interest expense and additional units on issue due to DRP
                                                                                              Number of units (weighted average)(m)            1,075.1        1,004.0     929.8
•   Distribution of 5.70 cpu represents 98% of AFFO                                           FFO per unit (cents) ("EPU")                       6.72           6.21       8.44
       –   Estimated tax deferred component increased to 35% which is higher than our         Distribution ($m)                                  61.4           53.6       69.9
           expected normalised level of 20-25% due to the timing of deductions
           associated with the ECL allowance                                                  Distribution per unit (cents) ("DPU")              5.70           5.00       7.50
                                                                                              Payout ratio (%)                                   85%            81%        89%
•   When comparing the current period to the second half of the FY20 financial                Estimated tax deferred ratio (%)                   35%            11%        22%
    year, our earnings per unit have increased due to lower COVID-19 related
    impacts:                                                                               Less: Maintenance capex                              (3.9)          (4.1)      (1.9)
      –    FFO has increased by $10.0m (or 16.1%) from $62.3m to $72.3m                    Less: Leasing costs and fitout incentives               (6.0)       (4.0)       (6.5)
      –    FFO per unit has increased by 0.51cpu (or 8.2%) from 6.21cpu to 6.72cpu
                                                                                           AFFO                                                    62.4        54.2        70.1
      –    AFFO has increased by $8.2m (or 15.1%) from $54.2m to $62.4m
      –    AFFO per unit has increased by 0.4cpu (or 7.4%) from 5.40cpu to 5.80cpu         AFFO per unit (cents) ("EPU")                           5.80        5.40        7.54
      –    Distribution per unit has increased by 0.7cpu (or 14.0%) from 5.00cpu to        Distribution / AFFO (%)                                 98%         99%        100%
           5.70cpu

                                                                                                                                        slide 10
BALANCE SHEET
As at 31 December 2020
•   Value of investment properties increased from $3,138.2m to $3,403.3m due to:         $m                                              31 Dec 2020       30 June 2020       % Change
      –   Acquisition of Auburn Central for $129.5m, Bakewell Shopping Centre            Cash                                                 2.9              183.8           (98.4)%
          and petrol station for $39.4m and vacant land adjacent to the Greenbank
          neighbourhood centre for $10.0m (excluding transaction costs of $10.2m)        Investment properties                              3,403.3           3,138.2            8.4%
      –   Developments, capital expenditure and straight lining of $13.0m; and
      –   Like-for-like valuation increase of $63.0m (net of transaction costs           Investment in CQR                                    24.9             22.7              9.7%
          $10.2m and developments, capital expenditure and straight lining of
                                                                                         Other assets                                        185.7             245.0           (24.2)%
          $13.0m) of which the allowance for future lost rents directly related to the
          COVID-19 pandemic has decreased by $23.4m (from $27.4m as at June              Total assets                                       3,616.8           3,589.7            0.8%
          2020 to $4.0m as at December 2020)
                                                                                         Debt                                               1,051.2           1,083.6           (3.0)%
•   Cash at 30 June 2020 included term deposits of $180m which were the excess
                                                                                         Distribution payable                                 61.4             53.6             14.6%
    proceeds from the equity raisings in April and May 2020 (this excess cash was
    used to repay the maturing A$MTN $225m in October 2020)                              Other liabilities                                    76.6             78.5             (2.4)%

•   Investment in CQR of 6.78m units held at its closing price on 31 December            Total liabilities                                  1,189.2           1,215.7           (2.2)%
    2020 of $3.67 per unit                                                               Net tangible assets (NTA)                          2,427.6           2,374.0            2.3%
•   Other assets include derivative financial instruments with a mark-to-market          Number of units (period-end)(m)                    1,076.6           1,071.4            0.5%
    valuation of $109.0m, SURF 2 & 3 co-investment of $18.6m, receivables of
    $41.2m and other assets of $16.9m
                                                                                         NTA per unit ($)                                     2.25             2.22              1.4%
       –   Receivables includes a rental receivable of $16.8m (30 June 2020:             Corporate costs1                                     17.0             13.8             23.2%
           $22.3m), offset by an expected credit loss allowance of $12.9m (30 June
           2020: $15.3m). This implies that we expect to collect $3.9m of the rental     External funds under management
           receivable in future periods                                                  - SURF 1, 2 & 3 assets under management             100.5             104.8            (4.1)%
•   Net debt (net of cash) has increased due to acquisitions during the period           - Less: SURF 1, 2 & 3 co-investment                 (18.6)            (15.9)           17.0%

•   Units on issue has increased by 5.2m units due to: distribution reinvestment         Assets under management                            3,698.7           3,678.6            0.5%
    plans issuing 4.3m units at $2.22 per unit in August 2020 and 0.9m issued to         MER (%)2
                                                                                                                                             0.46%            0.38%             0.08%
    employees under vesting of remuneration plans
                                                                                         1.   Full year FY21 forecast
•   NTA per unit increased by 1.4% to $2.25, due to the increase in like-for-like        2.   MER stands for “Management Expense Ratio” and is calculated as FY21 forecast Corporate Costs
    investment property valuations offset by decreasing value of USPP swaps                   divided by Assets Under Management (including SURF assets). Bps stands for basis points.

•   MER has increased due to higher corporate costs, due mainly to increases in
    D&O insurance premiums and no KMP STIP in FY20                                                                                              slide 11
DEBT AND CAPITAL MANAGEMENT
         As at 31 December 2020
                                                                                                                                                                                31 Dec 2020 30 June 2020
     •   Gearing of 29.1% is below the target range of 30% to 40%. Our preference is for gearing to             Facility limit ($’m) 1                                                  1,232.1              1,457.1
         remain below 35% at this point in the cycle. The increase in gearing from June 2020 is due to
         the acquisitions during the period                                                                     Drawn debt (net of cash) ($’m) 2                                        1,019.2               823.3

     •   Key movements in drawn debt (net of cash) during the period:
                                                                                                                Gearing (%) 3                                                             29.1                 25.6
           –  Total facility limit decreased by $225.0m to $1,232.1m which was due to the repayment             % debt fixed or hedged                                                    56.4                 91.1
              of the $225m MTN in October 2020
           –  During the period we added $50m of new 10 and 15-year A$MTNs and terminated a                     Weighted average cost of debt (%)                                           3.2                  3.5
              $50m bank facility expiring in April 2022                                                         Average debt maturity (yrs)                                                 6.2                  5.1
           –  Drawn net debt increased due to acquisitions during the period, including Auburn
              Central for $129.5m, Bakewell Shopping Centre and petrol station for $39.4m and                   Average fixed / hedged debt maturity (yrs)                                  5.2                  3.8
              vacant land adjacent to the Greenbank neighbourhood centre for $10.0m plus
                                                                                                                Interest cover ratio     4                                                4.5x                 4.5x
              transaction costs
           –  As at 31 December we have cash and undrawn facilities of $201.9m                                  Net debt / FFO before interest cost 5                                     5.7x                 4.6x

     •   The next debt expiries are a $25.0m bank facility in December 2023, a $50.0m bank facility in
         June 2024, and the $225.0m MTN in June 2024                                                              Debt Facilities Expiry Profile ($m)
                                                                                                                                             225.0                                 Bank debt undrawn
     •   Weighted cost of debt reduced from 3.5% to 3.2% due mainly to the repayment of the $225m                 300                                       135.0                  Bank debt drawn
         A$MTN which had a coupon of 3.75%. Average debt maturity has increased to 6.2 years from
                                                                                                                  250                                                              MTN
         5.1 years and average hedge fixed maturity has increased to 5.2 years from 3.8 years
                                                                                                                                                     75.0                          USPP
                                                                                                                  200
     •   We are well within debt covenant limits of less than 50% gearing and interest cover ratio (ICR)
         greater than 2.0x                                                                                        150
                                                                                                                                                     125.0 140.0 106.5          103.3          92.1
                                                                                                                  100
                                                                                                                                                                                                      65.8
                                                                                                                   50                        75.0                        39.4           30.0                  20.0
1.   Facility limit of $1,232.1m is made up of $550.0m bilateral bank facility limits plus USPP A$ denominated facility of $50.0m
     plus the USPP US$ denominated facilities at A$357.1m (being made up of USPP2014 US$ denominated facility at A$159.8m 0
     and the USPP2018 US$ denominated facility at A$197.3m (both being the AUD amount received and hedged in AUD)), plus                   FY21 FY23 FY24 FY25 FY26 FY28 FY29 FY30 FY31 FY32 FY34 FY36
     the A$ MTN issuance of $275.0m
2.   Drawn debt (net of cash) of $1,019.2m is made up of: statutory debt of $1,051.2m less $31.7m being the revaluation of the
     USPP US$ denominated debt from statutory value of $388.8m (using the prevailing December 2020 spot exchange rate) to
     restate the USPP to its hedged value of A$357.1m plus unamortised debt fees and MTN discount of $2.6m less $2.9m cash
3.   Gearing calculated as drawn debt (net of cash) of $1,019.2m (refer note 2 above), divided by total tangible assets (net of cash and derivatives) being total assets
     of $3,616.8m less cash of $2.9m less derivative mark-to-market of $109.0m = $3,504.9m
4.   Interest cover ratio is calculated as calendar year Group EBIT $134.3m plus unrealised and other excluded gains and losses of $26.5m, divided by net interest
     expense of $35.4m = 4.5x                                                                                                                                            slide 12
5.   Net debt / FFO before interest cost is calculated as drawn debt (net of cash) $1,019.2m divided by annualised 1HY21 FFO $72.3m plus net interest expense
     $16.9m = 5.7x
6.   Cash and undrawn facilities of $201.9m is made up of facility limit of $1,232.1m less drawn debt net of cash of $1,019.2m less $11.0m of debt facilities used for
     bank guarantees
3
OPERATIONAL PERFORMANCE
Anthony Mellowes
Chief Executive Officer

                          slide 13
PORTFOLIO OVERVIEW
   Weighting towards food, health and retail services (non-discretionary)
    As at 31 December 2020                             Number of             Number of                   GLA               Site Area     Occupancy                 Value            WALE    Weighted average
                                                        centres              specialties                (sqm)               (sqm)         (% GLA)                  ($m)             (yrs)     cap rate (%)
    Neighbourhood                                              77                1,399                  485,370            1,670,600          98.4%                2,595.7           6.8         6.25%

    Sub-regional                                               10                517                    208,921             545,090           97.9%                807.6             7.4         6.84%

                                                               87                1,916                  694,291            2,215,690          98.2%                3,403.3           7.3         6.39%

          Tenants by Category (by gross rent)1                                   Specialty / Mini-Major Tenants (by gross rent)1,2                                     Geographic Diversification (by value)
                                                                                                                                                                                     VIC
                                                                                                        Other Retail 11%                                                             18%
                                                           Woolworths3 28%
                                                                                                                                                                                                         WA
                                                                                             Petrol 2%                                        Fresh Food/Food                                            13%
                                                                                                                                                                        TAS
                                                                                                                                             Catering/Liquor 32%        11%
                                                                                  Discount Variety 6%
                                                                                                                                                                                                                NT
                                                                                                                                                                                                                1%
                                                                                                                                                                       SA
Specialties 52%                                                                      Apparel 8%                                                                        5%

                                                                      Big W 5%

                                                                                                                                                                                                          NSW
                                                                                                                                                                                                          28%
                                                          Coles 11%                                                                                                           QLD
                                                                                            Pharmacy & Health                                                                 24%
                                                                                                                                       Services 20%
                                                                                                Care 21%
                                              Wesfarmers4 3%
                            Other major5 1%

   1.    Annualised gross rent excluding vacancy and percentage rent
   2.    Mini Majors represent 12% of annualised specialty gross rent. Mini major tenants have been split across the relevant categories
   3.    Woolworths includes Endeavour Drinks (1.6% of gross rent)
   4.    Wesfarmers includes Kmart 2.4%, Bunnings 0.5% and Target 0.1%                                                                                                        slide 14
   5.    Other majors includes Aldi, Farmer Jacks and Grand Cinemas
PORTFOLIO OCCUPANCY
Specialty vacancy is stable despite COVID-19 challenges
•   Strategic focus on remixing toward non-discretionary categories, reducing long term             Portfolio Occupancy (% of GLA)
    vacancies and maintaining the retention rate on existing tenant renewals despite
    challenges from COVID-19 restrictions.
                                                                                                        98.4%         98.4%
                                                                                                                                     98.2%             98.2%          98.2%
•   Total portfolio occupancy has remained stable at 98.2% of GLA
      –    Specialty vacancy is stable at 4.8% (5.1% at June 2020)
      –    Long term stability of portfolio occupancy illustrates the resilience of the portfolio

•   Specialty tenant holdover on total portfolio is 1.6% (increased from 1.1% at June 2020)

•   Anchor tenant expiries in FY21 - lease extensions have already been agreed:
      –  Oxenford Woolworths in October 2020: new twelve year term agreed with three
         ten year options
      –  The Markets (West End) Coles in October 2020: new ten year term agreed with
         two ten year options
                                                                                                      June 2017      June 2018      June 2019        June 2020     December 2020
      –  West End Plaza Coles in November 2020: new ten year term agreed with four
         five year options
      –  New Town Coles in June 2021: new ten year term agreed with two ten year
         options                                                                                    Overall Lease Expiry (% of Gross Rent)
      –  New Town Kmart in June 2021: new seven year term agreed with four five year
         options                                                                                                                                                            29.4%

•   Continued active management of lease expiry profile. Approximately 10% of leases
    expiring per annum is consistent with c.50% of income from specialty tenants with
    5-year leases
                                                                                                           11.1%   10.7%   10.2%
                                                                                                                                   8.1%                     8.9%
                                                                                                    6.3%                                   7.2%
                                                                                                                                                     4.3%            3.8%

                                                                                                    FY21   FY22    FY23    FY24    FY25    FY26      FY27   FY28    FY29     FY30
                                                                                                                                                                              and
                                                                                                                                                                            beyond

                                                                                                                                          slide 15
SALES GROWTH AND TURNOVER RENT
Sales growth strong despite specialties impacted by COVID-19

•    Supermarket portfolio MAT1 sales growth has increased by 8.6% (June 2020: 5.1%)                           Comparable Store MAT1 Sales Growth by Category (%)
       –  Continuation of working from home, border closures and restricted travel has
          seen shopping behaviour remain local as people continue to eat and entertain                                                                                As at                  As at
          at home in the COVID-19 environment                                                                    Total Portfolio
                                                                                                                                                                31 December 2020         30 June 2020
•    Discount Department Store (DDS) portfolio MAT sales growth increased by 15.0%                               Supermarkets                                         8.6%                  5.1%
     (June 2020: 7.6%)
        –  Strong demand for home and living products as more people stay at home                                DDS                                                 15.0%                  7.6%
           during the COVID-19 pandemic
                                                                                                                 Mini Majors                                          6.3%                  2.9%
•    Mini Majors portfolio MAT strengthened to 6.3% (June 2020: 2.9%)
       –   Discount variety, pharmacies and sporting goods saw increased growth due                              Specialties                                          0.5%                  (1.1)%
           more time spent at home
                                                                                                                 Total                                                7.9%                  4.2%
•    Specialty portfolio MAT sales increased to 0.5% (June 2020: (1.1%))
       –   Strong Christmas trade with specialty sales growth up 10.5% for the month of
           December compared to the prior year                                                                    Turnover Rent ($m)
       –   Non-discretionary categories MAT growth was 3.3%, continuing to outperform                                                                                                            2.6
           discretionary categories that declined by (9.4%) over the year. Apparel                                                                                                               0.1
           impacted by voluntary closures during COVID-19                                                                   Total Portfolio
       –   Neighbourhood centres MAT outperformed sub regional centres as they                                              Captured in a Base Rent review
           continue to service everyday convenience needs
       –   Excluding Victoria (due to 16 weeks of lockdown), specialty MAT growth was
           4.0%
                                                                                                                                                                                                 2.5
       –   Excluding retailers that closed due to COVID-19 related trading restrictions and
           voluntary closures, speciality MAT would have improved to 5.2%
                                                                                                                                                                     1.1           1.1
•    Turnover rent continues to increase:                                                                                0.6               0.7        0.7
       –   39 anchor tenants paying turnover rent as at 31 December 2020 (35
           supermarkets, 2 Kmart's and 2 Dan Murphy’s) – represents 35% of portfolio                                 15 Anchors     16 Anchors     20 Anchors     34 Anchors   34 Anchors     39 Anchors
           anchors paying turnover rent (June 2020: 34)
       –   Another 14 supermarkets are within 10% of their turnover thresholds                                        1H FY16            1H FY17    1H FY18        1H FY19      1H FY20        1H FY21
       –   2 anchor tenant turnover rents captured in a base rent review during the half
           year
1.   Moving annual turnover sales growth measures the growth in sales over the last 12 months compared to the previous 12 month period                          slide 16
SPECIALTY KEY METRICS
 Executing our strategy in a challenging retail market
     •    Sustainable rents and occupancy costs for specialty tenants:                                                     Specialty Tenant Metrics
            –   Sales growth was 0.5% due to impact of COVID-19 (June 2020: (1.1%))
            –   Sales productivity increased to $8,367 psm (June 2020: $8,229 psm)                                         Total Portfolio                                   31 December 2020   30 June 2020
            –   Gross rent has increased 1.3% to $788 despite COVID-19 impacts
            –   Occupancy cost decreased marginally to 9.9% (June 2020: 10.0%)                                             Comparable sales MAT Growth (%)1                        0.5%            (1.1%)
     •    In a soft retail market exacerbated by COVID-19 challenges, our strategy focused on:                             Average speciality occupancy cost (%)1                  9.9%            10.0%
             –   Maintaining a high retention rate on renewals at 78% (June 2020: 76%)
                                                                                                                           Average speciality gross rent per square metre          $788            $778
             –   Reducing specialty vacancy with a focus on reducing long term vacancies: 63 new
                 deals done (December 2019: 78), a strong result given the COVID-19 restrictions                           Speciality sales productivity ($ per sqm)1              $8,367          $8,229
                 in a number of states
             –   Continued to remix toward non-discretionary categories
                                                                                                                                                                                6 months to     12 months to
                                                                                                                           Renewals
     •    The strength and quality of new deals is reflected in positive average leasing spread of                                                                           31 December 2020   30 June 2020
          0.8% (June 2020: (7.7%)) and lower average incentives at 11.8 months (June 2020: 13.8
          months. The average renewal spread was (4.6%) (June 2020: (1.1%)), due to three                                  Number                                                   96              232
          unfavourable pharmacy renewals. Excluding these, the renewal spread is (1.9%), which                             Retention (%)                                            78%             76%
          is relatively consistent to renewal spread at June 2020
                                                                                                                           GLA (sqm)                                               12,521          31,817
     •    Continuing to achieve 3%-5% annual fixed increases for 80% of specialty tenants
                                                                                                                           Average uplift (%)                                      (4.6%)          (1.1%)
                                                                                                                           Incentive (months)                                       0.5             0.5
            Specialty Lease Composition (as at 31 December 2020)
                                                                                                                                                                                6 months to     12 months to
             Annual Increase Mechanism                                     Tenant Type                                     New Leases
                                                                                                                                                                             31 December 2020   30 June 2020
                         Other, 1%
                                                                                                                           Number                                                   63              146
                        CPI,
                        10%                                                                                                GLA (sqm)                                               5,408           18,656
                                                                                                                           Average uplift (%)                                      0.8%            (7.7%)
                                                                                     National /
                                                                   Local, 41%
                                                                                     Regional,                             Incentive (months)                                       11.8            13.8
                                                                                       59%

                          Fixed, 89%

                                                                                                                                                                        slide 17

1.       Sales growth, occupancy cost and sales productivity metrics only include sales reporting tenants trading over 24 months
SUSTAINABILITY
    We continue to focus on long-term sustainable performance

                                                                                     ENVIRONMENTALLY
                    STRONGER                                                                                                                             RESPONSIBLE
                                                                                         EFFICIENT
                   COMMUNITIES                                                                                                                            INVESTMENT
                                                                                         CENTRES

Our commitment to building stronger community                               Sustainability focussed investment to drive                     The next phase of strategic planning and
relationships further progressed with the commencement                      programs that generate acceptable returns.                      engagement across the business to deliver
of our partnership with The Smith Family.                                                                                                   revitalized strategic outlook for ESG at SCP.
ABOUT THE SMITH FAMILY                                                      BUILDING AUTOMATION                                             STRATEGIC PLANNING
The Smith Family is a national, independent children's charity helping
disadvantaged Australians to get the most out of their education, so        Intelligent Building Automation Systems for the management      A strategy session was held to review our aspiration and
they can create better futures for themselves. The Smith Family works       of indoor environments and energy demand including load         evolution of ESG strategy. Republic of Everyone hosted
across 91 communities in Australia, where the communities have been         shedding capabilities installed. Reduction in energy demand     session designed to build a refreshed long-term plan that aligns
identified as having higher concentrations of families living in economic   levies and improved efficiencies for plant such as air          with SCP’s long term business strategy. Participation from all
disadvantage and are across all Australian states and territories. The      conditioning, ventilation and lighting.                         levels of the business reinforced the desire to connect with our
Smith Family targets and supports disadvantaged youth through                                                                               local communities and focus on sustainable outcomes for the
education, allowing these youth to participate fully in their education,                                                                    communities, our retail partners and our business.
                                                                            ENERGY EFFICIENT LIGHTING
giving them the best chance at breaking the cycle of disadvantage.

PARTNERSHIP OPPORTUNITIES                                                   Program of works to install energy efficient lighting such as
                                                                            LED in conjunction with building automation to enable smart     CLIMATE RISK
The Smith Family and SCA held a strategy session with a number of           lighting controls and operation.
SCA and TSF employees to brainstorm ideas on how the groups can                                                                             Completion of the initial phase of our Climate Risk assessment
best partner with each other over the 3-year partnership. The strategy                                                                      program. First phase focused on future weather-related risks
session identified a range of opportunities which included:                 RENEWABLE ENERGY                                                driven by projected future climate changes (10 and 30 years).
                                                                                                                                            Second phase will focus on the higher risk geographical
•      Supporting Toy and Book Appeal through retailer relationships        Market review and strategy paper completed by external          locations.
       and centre marketing initiatives                                     industry consultant to guide the future investment in onsite
                                                                            renewable energy generation and distribution.
•      Raising awareness through centre social media and digital
       platforms                                                            INDUSTRY PARTICIPATION

•      Staff volunteering                                                   Ongoing participation in industry benchmarking activities
                                                                            such as NABERS, Greenstar and GRESB.
•      Workplace giving

•      Hosts for cadetship to career program

                                                                                                                                                              slide

                                                                                                                                                                      slide 18
4
GROWTH OPPORTUNITIES
Anthony Mellowes
Chief Executive Officer

                          slide 19
PORTFOLIO MANAGEMENT
Two acquisitions in the six months to 31 December 2020

ACQUISITIONS
                                         Bakewell SC & Petrol Station                                                           Auburn Central

                                         (Bakewell, NT)                                                                         (Auburn, NSW)

                                         • Acquisition of the shopping centre                                                   • Acquisition of the shopping centre
                                           completed in Sep 2020 for $33.0m                                                       completed in Dec 2020 for $129.5m
                                           (7.22% implied fully let yield)                                                        (6.03% implied fully let yield)

                                         • Anchored by Woolworths with 10                                                       • Anchored by Woolworths, Aldi & Tong
                                           specialty tenancies, 1 Kiosk, 3                                                        Li, with 52 specialty tenancies, 6
                                           freestanding tenancies and 1 ATM                                                       Kiosks and 4 ATMs

                                         • % of income from Anchor: 58%                                                         • % of income from Anchors: 24%

                                         • Overall WALE (by income): 7.2 years                                                  • Overall WALE (by income): 6.6 years

                                         • Occupancy at acquisition: 96%                                                        • Occupancy at acquisition: 95%

                                         • Bakewell Petrol Station was acquired in                                              • Built in 2004 and redeveloped in 2020
                                           Dec 2020, for $6.4m (6.11% implied
                                           fully let yield) and a 15 year WALE (EG
                                           Fuelco)

                                         • Both built in 2016

OTHER ACQUISITION:              In December 2020 we exercised our option to purchase 10 hectares of development land adjacent to our existing Greenbank
..                              shopping centre (QLD) at $10.0m

PENDING ACQUISITIONS:           In December 2020 we agreed terms to acquire Katoomba, NSW for $55.1m (excluding transaction costs), an implied fully let yield of
                                5.5%. This property is expected to settle in February 2021

SUBSEQUENT ACQUISITIONS: In January 2021 we exchanged Cooloola Cove, QLD for $18.6m (excluding transaction costs), at an implied fully let yield of 5.7%. This
                          property is expected to settle in February 2021                                               slide

                                                                                                                                    slide 20
CONVENIENCE BASED CENTRES
Fragmented ownership provides acquisition opportunities                                                                                                              Indicative

CONVENIENCE BASED CENTRE LANDSCAPE                                                                        Ownership of Convenience Based Centres
                                                                                                                    (number of centres)
•   There are approximately 1,200 Coles and Woolworths anchored                                                                   VCX
                                                                                                                           ISPT
    neighbourhood and sub regional centres in Australia                                                              CQR
•   SCP is the largest owner (by number) of neighbourhood and sub regional                                                                   Syndicates, Funds &
                                                                                                               SCP                            Other Institutions
    centres in Australia. SCP has an opportunity to continue to consolidate this
    fragmented segment by utilising its management capability, industry
    knowledge and funding ability to source and execute acquisition
    opportunities from private and corporate owners
•   Since listing SCP has completed the acquisition of 52 neighbourhood and
    sub regional centres for over $1.9b and has divested 34 freestanding and
    neighbourhood centres for over $500m

RECENT TRANSACTIONS                                                                                                         Private

•   During the half year to 31 December 2020:
       –   10 neighbourhood centres changed hands for total consideration of
           ~$600m                                                                                   HY21 Buyers                                      HY21 Sellers
       –   3 sub regional centres changed hands for total consideration of                           (by value)                                       (by value)
           ~$300m
•   Increased institutional demand over the period, with evidence of cap rate                                                                                        Private Investor
                                                                                                                Private Investor          Syndicates &                     11%
    tightening in convenience-based centres                                        Syndicates & Funds                 4%                     Funds
                                                                                          28%                                                 36%
•   SCP acquired two neighbourhood centres over the half year, making up
    approximately 18% by value of total known transactions over the period                                             SCP
                                                                                                                       18%

ACQUISITION OUTLOOK

•   We will continue to take a disciplined approach to acquisitions:                 Other Institutions
      –   We have excess capacity following our equity raisings in April/May               50%                                                                     Other Institutions
                                                                                                                                                                         53%
          2020. We could debt fund over $250m of acquisitions and still keep
          our gearing below 35%
      –   Demand for quality neighbourhood assets remains strong, with cap
          rates to remain stable or tighten further

                                                                                                                                        slide 21
Source: Management estimates
INDICATIVE DEVELOPMENT PIPELINE
     Over $100m of development opportunities identified at more than 30 of our centres
     over the next 5 years1
                                                                                                                                                Estimated Capital Investment (A$m)
                                                                                                                      1HY21
     DEVELOPMENT TYPE                           CENTRE(S)                                                             Actuals          2HY21            FY22       FY23      FY24    FY25

                                                Greenbank, Warner, North Orange, Wyndham Vale, Epping
                                                North, Belmont, New Town Plaza, Whitsunday SC, White Box
     Centre expansions                                                                                                   0.1              3.3            16.8       27.2     22.5    25.0
                                                Rise, Collingwood Park, Currambine, Bushland Beach,
                                                Marian, Tamworth, Jimboomba, Kirkwood & Emerald

                                                Burnie, Oxenford, The Markets, New Town Plaza, Wonthaggi,
                                                Belmont, West End Plaza, Griffin Plaza, Meadow Mews,
     Centre improvements2                                                                                                8.4              7.4            16.5        0.5       -       -
                                                Warnbro, Sturt Mall, Sugarworld, Shoreline, The Gateway,
                                                Riverside, Tamworth, Kingston & Whitsunday SC

     Sustainability3                            Various                                                                  0.2              2.3            2.5         2.5      2.5     2.5

     Preliminary & Defensive                    Various                                                                  0.1              0.2            0.3         0.3      0.3     0.3

                                                Total                                                                    8.8             13.2            36.1       30.5     25.3    27.8

                           Major projects in FY21: The Markets, New Town, Oxenford, Wonthaggi, Belmont & Warner
1.     The exact timing of future developments, expansions and improvements are subject to prevailing market conditions and regulatory approvals
2.     Majority of this amount is made up of contributions to major’s refurbishments at Oxenford, Wonthaggi, Belmont, Burnie & West End ($6.2m) and The Markets
       project ($2.0m)
                                                                                                                                                                  slide 22
3.     Includes efficient lighting and building automation systems
FUNDS MANAGEMENT BUSINESS – AUM $100.5M
SURF 1 – successfully ended in October 2020 with an IRR of 11% to unitholders
SURF 2 – on track to end in 2021 with an expected IRR of 12% to unitholders
•    First fund “SURF 1” was launched in October 2015, and has successfully sold the five
     properties, with the final return made in October 2020 (consistent with 5-year term set out in
     the PDS)
        –    Achieved an IRR of 11.0%, with a performance fee to SCA Property Group of $0.5m
             (booked in 1H FY21) and a disposal fee of $0.2m (booked in 1H FY20)

•    Second fund “SURF 2” launched in June 2017 with two properties, and has successfully sold
     both properties with an estimated IRR in excess of 12%:
        –   The Fund sold Mittagong in FY20 and Katoomba Marketplace which is expected to
                                                                                                      Moama Marketplace, NSW (SURF 3)
            settle in February 2021. The IRR is estimated to be around 12%, with an estimated
            performance fee being of $0.7m payable after the final distributions are paid to
            unitholders

•    “SURF 3” launched in July 2018 and now has three properties (previously four properties)
       –  Swansea Woolworths was sold in July 2020 for $15.6m (in line with 31 Dec 2019 book
          value). The proceeds were used to repay a portion of the secured debt facility and
          strengthened the balance sheet of SURF 3

•    Fee structure for all funds is the same1
       –    Establishment Fee: 1.5% of total asset value
       –    Management Fees: 0.7% of total asset value per annum                                      Warrnambool Target, VIC (SURF 3)    Woodford Woolworths, QLD (SURF 3)
       –    Disposal Fee: 1.0% of assets disposed
       –    Performance Fee: if the equity IRR exceeds 10.0%, SCP will receive 20.0% of the
            outperformance

•    No new retail funds are forecast in the near term. We will continue to monitor the retail and
     institutional market appetite for new product

                                                                                                      Woolworths and Big W, Katoomba (SURF 2)

                                                                                                                                         slide 23
1.   SCA may defer fees, or rebate a portion of its fees to wholesale clients, at its discretion
5
KEY PRIORITIES AND OUTLOOK
Anthony Mellowes and Mark Fleming
Chief Executive Officer and Chief Financial Officer

                                                      slide 24
CORE STRATEGY UNCHANGED
Defensive, resilient cashflows to support secure and growing long term distributions to
our unitholders

                                     WEIGHTED TO
  FOCUS ON CONVENIENCE-                                           LONG LEASES TO
                                  NON-DISCRETIONARY
   BASED RETAIL CENTRES                                       QUALITY ANCHOR TENANTS
                                   RETAIL SEGMENTS

                      APPROPRIATE                      GROWTH
                   CAPITAL STRUCTURE                OPPORTUNITIES

                                                                    slide 25
FUTURE IMPACT OF COVID-19
Three sub-categories of specialty tenants have experienced subdued sales growth

                                                                                                  % of Gross
                                                                    Category                     Rental Income                      Sales Growth (%)

•   Three categories of specialty tenants have
                                                                                                                  November 2020        December 2020     December 2020
    experienced subdued sales (Apparel, Services          Impact                                                 (month-on-month)     (month-on-month)       (MAT)
    and Cafes / Restaurants)                               from
                                                         COVID-19
       –   Sales trends improved in November and                    Apparel                           3%              7.3%                 3.7%             (21.7%)
           December (after the Victorian lock-down
           ended)                                                   Services                         10%              (1.7%)               5.4%             (13.5%)
       –   These categories represent 16% of our
           gross rental income                                      Cafes / Restaurants               3%              2.9%                 (1.6%)           (15.1%)

                                                                    Takeaway Food                     7%              10.3%                9.0%              4.5%
•   During the period we had 60 closures and 63 new
    lease deals                                                     Fresh Food & Liquor               6%              9.3%                 6.6%              7.1%
       –   Apparel exposure reduced (8 stores closed
           and 2 stores opened)                                     Pharmacy / Medical               10%              1.8%                 12.8%             1.5%
       –   Services exposure increased (23 stores
           closed and 27 opened)                                    Other Specialty                   7%              22.3%                16.6%             7.1%
       –   Cafes/Restaurants exposure increased (4
                                                                    Total Specialty (excluding
           stores closed and 6 opened)                              Mini-Majors)
                                                                                                     46%              10.5%                9.9%              0.5%

                                                                    Mini-Majors                       6%              8.8%                 7.8%              6.3%
•   COVID-19 related rental assistance has been
    steadily reducing, from a peak of 44% of specialty              Discount Department Stores        8%              22.0%                12.1%            15.0%
    tenants in April 2020 down to below 10% in
    October 2020                                                    Supermarkets                     40%              7.1%                 6.7%              8.6%

       –   Mandatory Code of Conduct has ended in                   Total Portfolio                  100%             8.8%                 7.6%              7.9%
           QLD, SA, TAS and NT, and is due to end
           on 28 March 2021 in NSW, VIC and WA

                                                                                                                                slide 26
KEY PRIORITIES AND OUTLOOK
“Love local, Shop local, Act local”
                       •   Our primary objective over the next 6 months is to ensure that our centres emerge from the COVID-19 pandemic in a
                           stronger position as we get back to business as usual
                       •   As such, our focus continues to be:
                              – Serving our local communities for their everyday needs
                              – Partnering with our supermarket anchors to provide a convenient supermarket offer. This includes working with
                                   Coles and Woolworths to improve their online offer:
    OPTIMISING THE                       – 58 supermarkets in our portfolio now have dedicated click ‘n collect bays
    CORE BUSINESS                        – 2 supermarkets have drive-through for online pick up, with a further 7 planned for 2H FY21
                                         – Online sales are generally included in turnover rent calculations
                              – Actively managing our centres to ensure that we have sustainable specialty tenants paying sustainable rents; and
                              – Ensuring the long term sustainability of our business, including by building stronger communities, environmentally
                                   efficient centres and responsible investing
                       •   This will support our strategy of generating defensive, resilient cash flows to support secure and growing long term
                           distributions to our unitholders

       GROWTH          •   Continue to explore value-accretive acquisition opportunities consistent with our strategy and investment criteria
    OPPORTUNITIES      •   Progress our identified development pipeline

                       •   We will continue to actively manage our balance sheet to maintain diversified funding sources with long weighted average
 CAPITAL MANAGEMENT        debt expiry and a low cost of capital consistent with our risk profile
                       •   Gearing to remain below 35% at this point in the cycle

                       •   FY21 FFO per unit guidance is at least 14.4cpu (1.7% below FY20) and FY21 AFFO per unit guidance is at least 12.2cpu
                           (5.7% below FY20), assuming no further major outbreaks of COVID-19, no significant new government restrictions, and no
  EARNINGS GUIDANCE        further acquisitions (other than Katoomba Marketplace and Cooloola Cove)
                       •   Our medium-term target is to return AFFO per unit to the pre-COVID level of 7.5cpu per half (or 15.0cpu per annum) once
                           the impacts of the COVID-19 pandemic have ended and the equity raising proceeds are fully redeployed

                                                                                                                           27
                                                                                                                   slide
6
QUESTIONS

            slide 28
7
APPENDICES

             slide 29
PORTFOLIO DETAIL
Portfolio construction provides high degree of income predictability
•   Overall, a 7.3 year portfolio WALE combined with investment grade tenants and
                                                                                              Overall Lease Expiry (% of Gross Rent)
    non-discretionary retail categories provides a higher degree of income predictability
                                                                                                                                                                      29.4%

•   229 specialty renewals, new leases and COVID-19 extensions completed in the 6
    months to 31 December 2020 with majority on a 5 year lease term and the COVID-
    19 extensions averaging 13 months
                                                                                                      11.1%   10.7%   10.2%
                                                                                                                              8.1%                      8.9%
                                                                                               6.3%                                     7.2%
                                                                                                                                                 4.3%          3.8%

         PORTFOLIO LEASE EXPIRY PROFILE                                                        FY21   FY22    FY23    FY24    FY25     FY26      FY27   FY28   FY29    FY30
                                                                                                                                                                        and
                                                 WALE Years                                                                                                           beyond

    31 December 2020                 By Gross Rent            By GLA                        Speciality Lease Expiry (% of Speciality Gross Rent)
    Portfolio WALE                         6.3                 7.3                                    18.5%   17.8%
                                                                                                                      15.6%
    Anchor WALE                            9.7                 9.4
                                                                                                                              12.8%
                                                                                              11.4%
                                                                                                                                        9.6%

                                                                                                                                                 5.0%   4.9%
                                                                                                                                                                      2.8%
                                                                                                                                                               1.6%

                                                                                               FY21   FY22    FY23    FY24    FY25     FY26      FY27   FY28   FY29    FY30
                                                                                                                                                                        and
                                                                                                                                                                      beyond

                                                                                                                                      slide 30
ANCHOR TENANTS
48% of gross rent generated by anchor tenants
•   All of our centres are currently anchored by either Woolworths                                 30 June 2017   30 June 2018   30 June 2019   30 June 2020   31 Dec 2020
    Limited, Coles Group Limited or Wesfarmers Limited retailers      Woolworths Limited
                                                                      Woolworths                       54             54              58            58             60
                                                                      Big W                             7              7               9             9              9
•   Gradually increasing relative exposure to Coles and
    Wesfarmers via acquisitions and divestments. Coles now
                                                                      Dan Murphy's                      2              2               4             4              4
    represents 25% and Wesfarmers represents 6% of the anchor         Total Woolworths Limited         63             63              71            71             73
    tenants in the portfolio.
                                                                      Coles Group Limited
                                                                      Coles Group Limited               -              -              28            28             28
•   48.1% of gross rent is generated by anchor tenants
    (Woolworths Limited 32.9%, Coles 10.8%, Wesfarmers 2.9%
                                                                      Total Coles Group Limited         -              -              28            28             28
    and Other majors 1.5% on a fully leased basis), with an
    Anchor WALE of 9.4 years (by GLA)                                 Wesfarmers Limited
                                                                      Coles                            18             20               -             -             -
                                                                      Target                            2              2               2             2             1
•   Woolworths has announced the separation and potential
                                                                      Kmart                             2              2               4             4             5
    demerger of Endeavour Group. There are 4 Dan Murphy’s
    and 25 BWS stores in the portfolio accounting for 1.6% of total
                                                                      Bunnings                          1              1               1             1             1
    gross rent                                                        Total Wesfarmers Limited         23             25               7             7             7

                                                                      Other Anchor Tenants
•   There is one remaining Target store:
                                                                      Aldi                              1              1               1             2             3
    –   Gateway Langwarrin is a 1,500sqm store paying
        $262,500pa rent ($175/sqm), and will close in April 2021.     Farmer Jacks                      -              -               1             1             1
        The process of looking for a replacement has commenced        Grand Cinemas                     -              -               1             1             1
                                                                      Total Other Anchor Tenants        1              1               3             4             5
•   Acquired two Woolworths stores and one Aldi store:
    –   Auburn Central (NSW)- 3,650 sqm Woolworths store and          Total Anchor Tenants             87             89             109            110           113
        1,787 sqm Aldi store
    –   Bakewell (NT) - 4,854 sqm Woolworths store
                                                                                                                                  slide 31
DEBT FACILITIES & INTEREST RATE HEDGING
                                                                                                                         Financing
                                                                                    Facility Limit Drawn Debt             capacity Maturity / Notes
                                   $m                                                       (A$m)      (A$m)                 (A$m)
                                   Bank Facilities
                                   Bank bilateral                                            75.0         75.0                    -   FY24: $25m Dec 2023 and $50m Jun 2024
                                   Bank bilateral (including Bank Guarantee)                200.0        125.0                 75.0   FY25: $50m Mar 2025 and $150m May 2025
                                   Bank bilateral                                           175.0         40.0                135.0   FY26: $175m Nov 2025
                                   Syndicated non-revolving                                 100.0        100.0                    -   FY26: $100m Jun 2026
                                                                                            550.0        340.0                210.0
                                   Medium Term Notes (fixed rate)(A$MTN)
                                   Medium Term Note 4                                       225.0        225.0                     - Jun 2024; Coupon of 3.90%
                                   Medium Term Note 4                                        30.0          30.0                    - Sep 2030; Coupon of 3.25%
                                   Medium Term Note    4                                     20.0         20.0                     - Sep 2035; Coupon of 3.50%
                                                                                            275.0        275.0                     -
     DEBT FACILITIES               US Private Placement
(INCLUDING FIXED RATE DEBT)
                                   US$ denominated2                                         106.5        106.5                     - Aug 2027
 As at 31 December 2020            US$ denominated3                                          39.4          39.4                    - Sep 2028
                                   US$  denominated2                                         53.3          53.3                    - Aug 2029
                                   A$ denominated                                            50.0          50.0                    - Aug 2029
                                   US$ denominated3                                          92.1          92.1                    - Sep 2031
                                   US$ denominated3                                          65.8         65.8                    - Sep 2033
                                                                                            407.1        407.1                    -
                                   Total unsecured financing facililties                  1,232.1      1,022.1                210.0
                                   Add: cash                                                    -          2.9                  2.9
                                   Net debt5                                              1,232.1      1,019.2                212.9
                                   Less: Debt facilities used for bank
                                   guarantees1                                                                                (11.0) May 2025; facility used for bank guarantees (refer note 1)
                                   Total debt facilities available plus cash                                                  201.9 Net financing capacity of $201.9m

                                    In addition to the fixed rate A$ MTN noted above, the Group has the following interest rate swaps in place where the Group pays fixed rates and receives floating rates;
                                                                                  Notional Face
                                   Hedging                                          Value (A$m) Fixed Rate                   Expiry
     OTHER HEDGES                  Interest Rate Swap                                      100.0      1.370%               Jul 2025
 As at 31 December 2020            Interest Rate Swap                                      100.0      1.455%               Jul 2026
                                   Interest Rate Swap                                      100.0      1.547%               Jul 2027
                                    Total                                                  300.0

1.    Bank guarantees of $11.0m are for the Group’s compliance with its Australian Financial Services Licences
2.    USPP 2014 denominated repayment obligations have been fully hedged at A$ / US$ rate of 0.9387
3.    USPP 2018 denominated repayment obligations have been fully hedged at A$ / US$ rate of 0.7604
4.    The Group currently has three separate A$MTN on issue                                                                                                      slide 32
5.    Drawn debt (net of cash) of $1,019.2m is made up of: statutory debt of $1,051.2m less $31.7m being the revaluation of the USPP US$ denominated debt
      from statutory value of $388.8m (using the prevailing December 2020 spot exchange rate) to restate the USPP to its hedged value of A$357.1m plus
      unamortised debt fees and MTN discount of $2.6m less $2.9m cash
ACQUISITIONS DURING THE PERIOD
Six months to 31 December 2020

                                                                                                                                          Total
                                                                       Anchor          Specialty         Total                                          Implied
                                                  Acquisition                                                         % GLA             Purchase
                               Centre Type                               GLA             GLA              GLA                                           Fully Let
                                                     Date                                                            Committed            Price
                                                                        (sqm)           (sqm)            (sqm)                                           Yield
                                                                                                                                          ($m)
Acquired Properties
Bakewell Shopping Centre     Neighbourhood          Sep 2020            4,854            1,553           6,407           96%                33.0          7.22%
Bakewell Petrol Station       Freestanding          Dec 2020            2,710               -            2,710           100%                6.4          6.11%
Auburn Central               Neighbourhood          Dec 2020            5,437            8,182          13,619           95%                129.5         6.03%
                                                                       13,001            9,735          22,736           95%                168.9         6.27%

OTHER ACQUISITION:              In December 2020 we exercised our option to purchase 10 hectares of development land adjacent to our existing Greenbank
..                              shopping centre (QLD) at $10.0m

PENDING ACQUISITIONS:           In December 2020 we agreed terms to acquire Katoomba, NSW for $55.1m (excluding transaction costs), an implied fully let yield of
                                5.5%. This property is expected to settle in February 2021

SUBSEQUENT ACQUISITIONS: In January 2021 we exchanged Cooloola Cove, QLD for $18.6m (excluding transaction costs), at an implied fully let yield of 5.7%. This
                          property is expected to settle in February 2021

                                                                                                                                 slide 33
PORTFOLIO LIST (I)
                                                                                                                                                                       Valuation
                                                                                      Completion   Total GLA   Occupancy    Number of         WALE         Valuation   Dec 2020
Property                    State   Property Type         Anchor Tenant(s)              Date        (sqm)      (% by GLA)   Specialties   (Years by GLA)   Cap Rate     (A$m)
Lavington Square      NSW           Sub-Regional             WOW; Big W                  2005       20,222       95.4%          58                3.6       7.25%        62.3
Sturt Mall            NSW           Sub-Regional             Coles; Kmart                2011       15,233       97.3%          48                2.7       6.50%        70.0
West End Plaza        NSW           Sub-Regional             Coles; Kmart                2009       15,876       97.7%          44                5.3       6.50%        74.3
Lilydale              VIC           Sub-Regional           WOW; Big W; Aldi              2013       21,737       99.6%          60                9.5       6.25%        110.0
Pakenham              VIC           Sub-Regional             WOW; Big W                  2011       16,925       99.3%          44                5.5       6.50%        83.8
Central Highlands     QLD           Sub-Regional             WOW; Big W                  2012       18,049       99.3%          34                9.2       7.75%        60.6
Mt Gambier            SA            Sub-Regional        WOW; Big W; Bunnings             2012       27,723       98.4%          37                10.4      6.50%        70.1
Murray Bridge         SA            Sub-Regional             WOW; Big W                  2011       18,771       96.2%          54                5.6       7.75%        57.0
Kwinana Marketplace   WA             Sub-Regional   Coles; WOW; Big W; Dan Murphy's      2012       32,952       95.6%          76                9.8       7.00%        131.5
Warnbro               WA             Sub-Regional          Coles; WOW; Big W             2014       21,434       96.6%          62                7.6       7.00%         88.0
Auburn Central        NSW           Neighbourhood              WOW; Aldi                 2004       13,619       95.4%          58                5.5       6.00%        129.5
Belmont Central       NSW           Neighbourhood               WOW                      2008       7,868        93.4%          24                8.0       6.79%        31.1
Berala                NSW           Neighbourhood               WOW                      2012       4,013       100.0%          6                 11.1      5.25%        30.5
Cabarita              NSW           Neighbourhood               WOW                      2013       3,426        99.9%          11                10.2      6.25%        22.6
Cardiff               NSW           Neighbourhood               WOW                      2010       5,848        99.0%          14                11.6      6.00%        26.6
Clemton Park          NSW           Neighbourhood               Coles                    2017       7,020        96.3%          22                10.8      5.75%        55.6
Goonellabah           NSW           Neighbourhood               WOW                      2012       5,115        98.0%          10                9.8       6.50%        19.5
Greystanes            NSW           Neighbourhood               WOW                      2014       6,005       100.0%          29                10.1      5.50%        62.6
Griffin Plaza         NSW           Neighbourhood               Coles                    1997       7,184        94.8%          29                4.2       6.50%        27.0
Lane Cove             NSW           Neighbourhood               WOW                      2009       6,721       100.0%          13                10.6      5.75%        54.1
Leura                 NSW           Neighbourhood               WOW                      2011       2,546       100.0%          6                 10.8      5.50%        19.5
Lismore               NSW           Neighbourhood               WOW                      2015       6,836        92.6%          23                10.4      7.25%        29.3
Macksville            NSW           Neighbourhood               WOW                      2010       3,446       100.0%          5                 12.3      5.75%        15.6
Merimbula             NSW           Neighbourhood               WOW                      2010       5,012        99.6%          10                10.6      6.25%        20.3
Morisset              NSW           Neighbourhood               WOW                      2010       4,137       100.0%          8                 6.6       6.75%        19.1
Muswellbrook Fair     NSW           Neighbourhood               Coles                    2015       9,007        99.1%          22                2.9       6.25%        34.2
Northgate             NSW           Neighbourhood               Coles                    2014       4,126       100.0%          13                3.3       6.50%        17.3
North Orange          NSW           Neighbourhood               WOW                      2011       4,844       100.0%          14                11.7      6.00%        37.0
Shell Cove            NSW           Neighbourhood               WOW                      2018       4,882        96.7%          12                15.1      5.75%        39.5
Ulladulla             NSW           Neighbourhood               WOW                      2012       5,282        96.9%          10                12.4      5.75%        27.3
West Dubbo            NSW           Neighbourhood               WOW                      2010       4,205       100.0%          10                9.6       6.00%        19.4
Albury                VIC           Neighbourhood               WOW                      2011       4,952        98.7%          14                10.5      6.25%        24.5
Ballarat              VIC           Neighbourhood         Dan Murphy's; Big W            2000       8,963       100.0%          4                 3.9       7.25%        17.4
Bentons Square        VIC           Neighbourhood         WOW; Dan Murphy's              2009       10,004      97.2%           44                 6.1      6.00%        88.4
Drouin                VIC           Neighbourhood              WOW                       2008       3,779       99.9%           4                  7.4      5.50%        16.9
Epping North          VIC           Neighbourhood              WOW                       2011       5,259       100.0%          17                10.7      5.75%        30.5
Highett               VIC           Neighbourhood               WOW                      2013       5,476       100.0%          13                11.5      5.50%        30.5
Langwarrin            VIC           Neighbourhood               WOW                      2004       5,094       100.0%          16                3.8       5.75%        24.7
Ocean Grove           VIC           Neighbourhood               WOW                      2004       6,909        96.2%          21                3.9       6.25%        36.4
The Gateway           VIC           Neighbourhood            Coles: Target               2012       10,846      100.0%          41                3.7       6.75%        52.0
Warrnambool East      VIC           Neighbourhood               WOW                      2011       4,319        98.2%          6                 6.9       6.25%        15.7
Wonthaggi             VIC           Neighbourhood            Coles; Kmart                2012       11,856       99.4%          22                5.9       6.50%        45.8
                                                                                                                                          slide
Wyndham Vale          VIC           Neighbourhood               WOW                      2009       6,650       100.0%          10                8.4       5.75%        24.0
PORTFOLIO LIST (II)
                                                                                                                                                                                Valuation
                                                                                              Completion   Total GLA   Occupancy    Number of          WALE         Valuation   Dec 2020
Property                           State   Property Type          Anchor Tenant(s)              Date        (sqm)      (% by GLA)   Specialties    (Years by GLA)   Cap Rate     (A$m)
Annandale Central             QLD          Neighbourhood               Coles                     2007       6,655       99.1%           21               5.3         7.50%        25.6
Ayr                           QLD          Neighbourhood               Coles                     2000       5,455       97.8%           8                4.6         6.75%        21.4
Brookwater Village            QLD          Neighbourhood               WOW;                      2013       6,755       100.0%          11               8.3         6.00%        35.5
Bushland Beach                QLD          Neighbourhood               Coles                     2018       4,567       99.3%           9                9.9         6.75%        22.5
Carrara                       QLD          Neighbourhood               WOW                       2011       3,717       100.0%          6                7.1         6.00%        17.5
Chancellor Park Marketplace   QLD          Neighbourhood               WOW                       2001       5,859       98.8%           18              11.7         6.00%        46.5
Collingwood Park              QLD          Neighbourhood               WOW                       2009       4,567       99.7%           10              11.4         6.25%        12.4
Coorparoo                     QLD          Neighbourhood               WOW                       2012       5,588       97.7%           15              10.6         5.50%        38.8
Gladstone                     QLD          Neighbourhood               WOW                       2012       5,215       98.1%           13               8.9         7.00%        23.9
Greenbank                     QLD          Neighbourhood               WOW                       2008       5,694       100.0%          17               6.8         6.00%        32.3
Jimboomba Junction            QLD          Neighbourhood               Coles                     2008       5,930       94.6%           22               3.1         6.25%        28.6
Lillybrook Shopping Village   QLD          Neighbourhood               Coles                     2004       6,996       100.0%          21               5.8         6.00%        28.4
Mackay                        QLD          Neighbourhood               WOW                       2012       4,167       100.0%          9               10.4         6.75%        25.5
Marketplace Warner            QLD          Neighbourhood             WOW; Aldi                   2001       11,470      96.0%           45               6.8         5.75%        77.1
Marian Town Centre            QLD          Neighbourhood               WOW                       2014       6,707       97.6%           19               8.4         7.00%        31.5
Miami One                     QLD          Neighbourhood               Coles                     2007       4,676       98.6%           35               3.7         6.25%        30.3
Mission Beach                 QLD          Neighbourhood               WOW                       2008       3,904       97.8%           9                6.1         6.50%        12.0
Mt Warren Park                QLD          Neighbourhood               Coles                     2005       3,843       98.4%           11               7.5         6.00%        18.2
Mudgeeraba Market             QLD          Neighbourhood               WOW                       2008       6,143       97.0%           39               6.0         6.25%        34.9
North Shore Village           QLD          Neighbourhood               Coles                     2003       4,072       97.8%           14               5.9         5.75%        29.1
Oxenford                      QLD          Neighbourhood               WOW                       2001       5,815       100.0%          18               8.9         5.75%        35.0
Sugarworld Shopping Centre    QLD          Neighbourhood               Coles                     2015       4,759       89.8%           12              10.3         6.75%        25.9
The Markets                   QLD          Neighbourhood               Coles                     2002       5,416       81.8%           24               7.9         7.25%        29.4
Whitsunday                    QLD          Neighbourhood               Coles                     1986       7,660       88.0%           35               4.4         7.50%        33.9
Worongary Town Centre         QLD          Neighbourhood               Coles                     2004       6,899       96.8%           43               3.2         6.00%        48.3
Blakes Crossing               SA           Neighbourhood               WOW                       2011       5,078       100.0%          13               6.1         6.50%        21.5
Walkerville                   SA           Neighbourhood               WOW                       2013       5,263       100.0%          12              10.9         6.00%        26.0
Busselton                     WA           Neighbourhood               WOW                       2012       5,432       97.0%           5               11.9         6.00%        26.7
                                                           WOW; Dan Murphy's; Farmer Jacks;
Currambine Central            WA           Neighbourhood                                         2016       17,032       95.8%          42              5.9          7.00%        90.3
                                                                  Grand Cinemas
Kalamunda Central             WA           Neighbourhood               Coles                     2002        8,352      95.7%           40               3.9         6.00%        44.9
Stirlings Central             WA           Neighbourhood               WOW                       2013        8,428      90.4%           35               7.0         6.75%        40.6
Treendale                     WA           Neighbourhood               WOW                       2012        7,319      96.6%           19               4.7         6.25%        31.6
Burnie                        TAS          Neighbourhood            Coles; Kmart                 2006        8,431      100.0%          10               5.1         7.50%        23.5
Claremont Plaza               TAS          Neighbourhood               WOW                       2014        8,044      100.0%          26               7.6         6.50%        42.2
Glenorchy Central             TAS          Neighbourhood               WOW                       2007        7,090      100.0%          14               6.6         6.50%        28.1
Greenpoint                    TAS          Neighbourhood               WOW                       2007        5,830      100.0%          10               1.9         6.75%        19.8
Kingston                      TAS          Neighbourhood               Coles                     2008        4,958      100.0%          16               5.9         6.30%        31.5
Meadow Mews                   TAS          Neighbourhood               Coles                     2003        7,670      97.7%           31               4.4         6.50%        64.6
New Town Plaza                TAS          Neighbourhood            Coles; Kmart                 2002       11,385      98.9%           12               7.7         6.25%        47.0
Prospect Vale                 TAS          Neighbourhood               WOW                       1996        6,048      95.7%           19              10.4         6.50%        30.7
Riverside                     TAS          Neighbourhood               WOW                       1986        3,107      100.0%           7               8.8         6.25%         9.5
Shoreline                     TAS          Neighbourhood               WOW                       2001        6,277      100.0%          16
                                                                                                                                                  slide 1.8          6.25%        38.0
Sorell                        TAS          Neighbourhood               Coles                     2010        5,450      100.0%          13               7.6         6.25%        30.9
Bakewell                      NT           Neighbourhood               WOW                       2016        6,407      96.5%           14               8.2         6.92%        39.4
TOTAL OWNED PORFOTLIO                                                                                       694,291     98.2%          1,916             7.3         6.39%       3,403.3
PORTFOLIO LIST (III)

                                                                                                                                                                  WALE                  Valuation
                                                                                                                      Total GLA   Occupancy    Number of        (Years by   Valuation   Dec 2020
Property                                     State              Property Type Anchor Tenant(s)      Completion Date     (sqm)     (% by GLA)   Specialties        GLA)      Cap Rate     (A$m)

Properties Under Management - SURF 1
All assets have been sold and this vehicle was wound up in October 2020

Properties Under Management - SURF 2
Katoomba Marketplace*            NSW                             Freestanding          WOW; Big W        2014           9,719      100.0%           -              14.8       N/A*        55.1

Properties Under Management - SURF 3
Moama Marketplace                NSW                            Neighbourhood            WOW             2007           4,505      99.9%           8               12.1      6.25%        16.7
Warrnambool Target               VIC                            Neighbourhood            Target          1990           6,983      97.3%           11               3.5      9.00%        12.3
Woodford                         QLD                            Neighbourhood            WOW             2010           3,672      100.0%          5                6.1      6.00%        14.2

TOTAL MANAGED PORTFOLIO                                                                                                24,879       99.3%          24              9.8       7.33%        98.3

*Katoomba Marketplace was contracted for sale in December 2020 to SCA Property Group

                                                                                                                                                             slide 36
You can also read