Investor Presentation September 2020 - Skipton Building ...
←
→
Page content transcription
If your browser does not render page correctly, please read the page content below
Investor Presentation September 2020

Contents
An Introduction to Skipton Building Society
Half Year
Performance
Key Balance Sheet Metrics
Estate Agency
The Proposed Transaction
Appendix
2
Introduction
Executive Summary
The Society has a clear strategy which has been consistent for many years and continues to serve
us well
The Society entered the pandemic induced recession in a strong financial position, with healthy
capital and liquidity ratios
Whilst income for the whole of 2020 will be lower than last year, the Society is confident that it is
well placed to maintain its financial strength. The Estate Agency division Connells, has seen strong
trading since the estate agency market re-opened, and the mortgage market has seen margins
improve
We have reasonably prudent economic indicators underpinning our loan impairment provisions
The Society is taking a prudent approach by bringing forward this Senior Non Preferred transaction,
which will support our MREL requirement over the life of our Corporate Plan
4
Skipton Group
The UK’s fourth largest building society by asset size
Committed to mutuality – As a mutual organisation, the
Society is owned by its members and as such we are able
to take decisions to promote long term sustainability. Our
focus is on delivering on our Purpose which is to ‘help
more people into homes, help people save for life ahead
and support long term financial well being’
Our story started in 1853 and we have been helping
generations of members for over 167 years; we’re well
placed to help even more in the future. We are a purpose-
led organisation and as times change our purpose stays
the same, although how we fulfil it has and will evolve
Structure - the Building Society sits at the head of the
Mortgages & Savings (M&S) division, complemented by
subsidiary investments which provide additional earnings Deliver strong return on capital employed
and potential future capital gains
Group model – The M&S division comprises the Society,
Skipton International Limited, which carries out mortgage
lending in the Channel Islands and the UK and accepts
deposits in Guernsey. In addition the division includes our
specialist lending businesses, Amber Homeloans Limited Remaining books are in run-off
and North Yorkshire Mortgages Limited, both of which
ceased lending in 2008. The Skipton Group also holds
significant presence in the estate agency sector through
the Connells group, which includes property sales, surveys
and valuations, conveyancing, lettings, asset management
and mortgage and insurance broking Core IT platform
Credit ratings - rated A- (negative) by Fitch and Baa1
(stable) by Moody’s, affirmed by both agencies in the last
5
three months
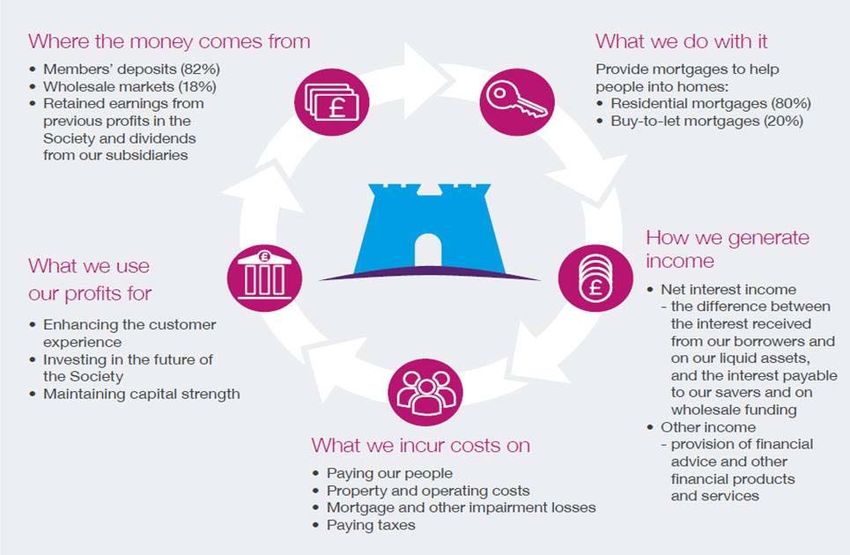
Our business model
The Society’s business model can be summarised as follows:
6
Sustainability Strategy
Our focus on long term sustainability does not end with the Society itself but extends to the communities we operate in
This aligns to our core vision of ‘Building a better Society’
In pursuit of our vision, in 2019 the Society released its sustainability report which focused on four UN Sustainable Development Goals
(SDGs) with associated challenging targets set against those goals:
Goal 11 – Sustainable Cities and Communities: We will help more people into Goal 8 – Decent Work and Economic Growth: We will be one of the best places
homes and support our local communities. to work.
We will do this by: We will do this by:
Helping 30,000 first-time buyers into homes by Increasing the number of young people who gain
2022 employment following our apprenticeship
programmes by 200% by 2022
Supporting 1,000 homeless people by 2022
Offering 50% of places on our talent development
Increasing the time our people spend programmes to women, to foster a healthy pipeline
volunteering in the community by 100% by 2022 of female talent
Maintaining our Investors in People platinum
accreditation
Goal 16 – Peace, Justice and Strong Institutions: We will always be owned by Goal 12 – Responsible Consumption and Production: We will give more to the
and responsible to our members, not shareholders. planet than we take.
We will do this by:
We will do this by:
Eliminating single-use plastics by 2020
Becoming a Disability Smart accredited
organisation by 2020
Sending zero waste to landfill by 2022
Showing that we care about our customers by
Halving our carbon footprint by 2022
delivering a customer empathy score in excess
of 80%
Ensuring that our net customer satisfaction
levels are always above 90%
7Half Year Performance
Business and Financial Highlights
        1,045,969 members
        Society continued to support its membership through a difficult time with 1,045,969 members (HY 2019: 1,030,526)

        £0.2bn Savings balances growth
        Savings balances grew by £0.2bn to £17.6bn, (HY 2019: £0.6bn), this represents a 1.4% growth since the end of 2019
        (HY 2019: 3.6%)

        £2.1bn Gross residential mortgage lending
        Gross residential mortgage lending of £2.1bn (HY 2019: £2.5bn)

        £0.9bn Mortgage book growth
        The mortgage book grew by £0.9bn to £21.0bn, a growth rate of 4.7% (HY 2019: £1.1bn, a growth rate of 5.9%)

        £34.4m Total Group Profit Before Tax (PBT)
        Total Group PBT was £34.4m (HY 2019: £67.0m), profits have been heavily impacted in the short term by a worsening of
        the economic outlook arising from the effects of the COVID-19 outbreak

        £47.9m Underlying Group PBT
        Underlying Group PBT was £47.9m (HY 2019: £78.9m). Group net interest margin was 0.87% (FY 2019: 0.98%)

        37.5% Group Common Equity Tier 1 ratio
        The Common Equity Tier 1 ratio remains strong at 37.5% (HY 2019: 33.5%, FY 2019: 39.1%) and the leverage ratio was
        6.0% (HY 2019: 6.1%)

        A Liquidity Coverage Ratio of 173%
        The liquidity coverage ratio remains well above both the regulatory limit of 100% and the internal limit set by the Board
        throughout the period. As at HY 2020 the LCR was 173% (HY 2019: 177%)

  “Despite an unforeseen challenging environment the Society continues to demonstrate
             excellent asset quality, strong capital strength & high liquidity”                                                     9
Group statement of financial position and income statement
HY 2019 FY 2019 HY 2020 HY 2019 FY 2019 HY 2020
£m £m £m £m £m £m
Liquid Assets 4,054 4,523 3,989 Net Interest Income 119.9 238.1 111.2
Mortgages 19,263 20,066 21,156 Total Income 349.5 726.1 292.0
Other Assets 911 900 959 Admin Expenses (274.7) (554.0) (230.6)
Total Assets 24,228 25,489 26,105 Loan Impairment - (0.5) (19.1)
Other Impairment and realised
Shares 16,711 17,364 17,645 (1.0) (0.3) (2.9)
losses
Wholesale Funding1 5,280 5,798 5,985 Provisions (6.8) (18.1) (5.0)
Other Liabilities 629 653 800 Group reported PBT 67.0 153.2 34.4
Subscribed Capital 42 42 42
Underlying Group PBT was £47.9m1 (HY 2019: £78.9m)
Reserves 1,566 1,632 1,633
Group Net Interest Margin reduced to 0.87% (FY 2019: 0.98%)
Total Liabilities & Mortgages & Savings division underlying PBT of £26.0m (HY 2019: £51.5m)
24,228 25,489 26,105
Reserves
“Strong profitability and diversification of income through our business model”
1 See
10
appendix 1 for Group underlying profits breakdownGroup PBT by division
The Mortgages & Savings division reported pre-tax profits of
HY 2019 FY 2019 HY 2020 £15.6m (HY 2019: £39.0m), a reduction of £14.0m,
£m £m £m predominantly as a result of loan impairment charges in the
division of 23.4m (HY 2019: £nil) as a consequence of the
worsening economic outlook arising from COVID-19,
Mortgages & significantly impacting the Group’s loan impairment charges
39.0 100.8 15.6 which, in line with the IFRS 9 accounting standard, need to be
Savings
booked upfront before they are incurred. In addition, the two
Bank Base Rate cuts announced by the Bank of England in
March 2020 has contributed to a reduction in net interest
Estate Agency 26.2 50.1 17.2 income during the period. The division reported an underlying
PBT of £26.0m (HY 2019: £51.5m)
The Estate Agency division reported a PBT of £17.2m (HY
Investment Portfolio 1.7 4.0 1.2 2019: £26.2m; FY 2019: £50.1m). Connells closed its
branches to the public on 23 March for two months, in line with
Government guidelines to help efforts in preventing the spread
of coronavirus
Sundry including
interdivisional 0.1 (1.7) (0.4)
The Investment Portfolio includes invoice discounting and debt
Adjustments1
factoring through Skipton Business Finance Limited and the
provision of software solutions to a range of industries through
Jade Software Corporation Limited, who also assist in the
Profit Before Tax 67.0 153.2 34.4
development of the Society’s core technology
1 Sundry including inter-divisional adjustments relate primarily to the elimination of inter- SBF delivered pre-tax profits of £1.1m (HY 2019: £1.8m). Profit
divisional trading and the cost of the Connells management incentive scheme for the period has been adversely impacted by COVID-19, with
decreased client sales leading to reduced income, whilst
impairment provisions have also increased to reflect the
challenges being faced by clients as a result of the pandemic
Jade Software Corporation (JSC) recorded a PBT of £0.1m
(HY 2019: £0.2m loss)
“Both main divisions of the Group remained profitable despite the challenging 11
economic operating environment”Prudent provisioning
HY 2019 FY 2019 HY 2020 Mortgage loan impairment
£m £m £m The loan impairment charge on residential mortgages
was £11.6m (2019: £0.6m)
Impairment charge on loans
- 0.5 19.1
and advances to customers The key driver for the increase in the loan impairment
charge is changes made to forward-looking economic
Other impairment and realised assumptions to reflect the economic uncertainty
1.0 0.3 2.9 caused by the COVID-19 pandemic. See appendix
losses
2 for the Society’s forward looking economic
Total impairment losses 1.0 0.8 22.0 assumptions
The impairment charge on commercial mortgages
HY 2019 FY 2019 HY 2020 was £7.1m (2019: £0.6m credit). Commercial
£m £m £m mortgage arears also remain low, with the charge
also driven by the change in forward-looking
Financial Services
- (0.3) - economic assumptions. We are also providing
Compensation Scheme
support through concessionary arrangements with
Provisions for the costs of commercial customers who have been financially
surplus properties (0.1) (0.1) (0.1) affected by COVID-19, which has led to an increase
in overall impairment
Commission clawbacks /
7.4 15.2 4.6
rebates Impairment charges on other loans amounted to
£0.4m in the period (2019: £nil). These are all in
Survey and valuation claims
0.4 0.8 - Skipton Business Finance and reflect the challenges
being faced by its clients as a result of the pandemic
Customer compensation
(0.9) (0.8) 0.5 Other impairment losses and realised losses
Other These mainly comprise impairment of goodwill of
- 3.3 - £2.0m and of joint ventures of £1.0m in Connells
Total provisions charge 6.8 18.1 5.0 Provisions charge
The key component of the provisions charge relates
to commission clawbacks in Connells of £4.6m
(2019: £7.4m), which arise in the ordinary course of 12
businessKey Balance Sheet Metrics
Capital & MREL
Capital MREL
The following table shows the composition of the prudential group’s MREL is set for the Society by the Bank of England. For the
regulatory capital as at HY 2020. The capital ratios are reported on a transitional period until 31 December 2021, the Society is required to
CRD IV transitional basis hold MREL liabilities greater than 18% of risk weighted assets
On an end-point basis our CET1 ratio would remain the same at MREL at the end of the transitional period is subject to review by the
37.5%. The leverage ratio is reported on an end-point basis Bank of England.
Under CRD IV end-point rules the PIBS are fully transitioned into Tier As at HY 2020, the Society is in compliance with the current risk
2 capital. On an end-point basis our CET1 ratio would remain the weighted asset and leverage requirements.
same at 37.5%. The leverage ratio is reported on an end-point basis.
The proposed SNP issuance is in line with the Society's prudent
approach to ensuring continued compliance with MREL requirements
HY 2019* HY 2020
£m £m
Capital Resources £m:
Common Equity Tier 1 capital 1,443.0 1,515.4
Total Tier 1 capital 1,470.0 1,533.4
Total Tier 2 capital 13.0 22.0
Total regulatory capital 1,483.0 1,555.4
Risk weighted assets 4,329.4 4,042.0
Capital and leverage ratios **
Common Equity Tier 1 ratio (CET 1) 33.3% 37.5%
Leverage ratio 6.0% 6.0%
* The comparative period has been restated as outlined in note 1b) to the Condensed Consolidated Financial Statements, resulting in a decrease to Common Equity
Tier 1 capital, Total Tier 1 capital and total regulatory capital for the half year 30 June 2019 of £11.8m.
** The CET 1 ratio is calculated as relevant capital divided by risk weighted assets and the leverage ratio is calculated as Tier 1 capital divided by total exposure i.e. total
assets per the prudential group consolidated position (subject to some regulatory adjustments). The leverage ratio is reported on a CRD IV end-point basis; under CRD
IV end-point rules all existing Additional Tier 1 instruments that become ineligible as capital are excluded in full.
“A strong capital and MREL position provides the Society with excellent resilience in
this continuing challenging environment” 14Liquidity
The Group continues to hold healthy levels of liquid
High Quality Liquid Assets £m % of
assets to support the business and to help mitigate
(HQLA) HQLA
the current economic uncertainty arising from the
COVID-19 pandemic
Reserve Account 751.4 26%
The Liquidity Coverage Ratio (LCR) as at 30 June
2020 was 173%
Gilts 293.5 10%
Liquidity remains well above both the regulatory limit
of 100% and the internal limit set by the Board
throughout the period Treasury bills 670.6 24%
Contingent liquidity is pre-positioned with the Bank of Fixed rate bonds 573.5 20%
England in the form of mortgage assets.
At 30 June 2020, the Society held £2.8bn of Floating rate notes 204.0 7%
unencumbered High Quality Liquid Assets (HQLA),
as shown in the table
RMBS 72.3 3%
The Group’s NSFR was 142% as at 30 June 2020
which is well in excess of the minimum regulatory Covered bonds 278.4 10%
requirement of 100%
When measured as a percentage of shares, deposits TOTAL 2,843.7
and borrowings, the liquidity ratio remained strong at
16.9%
“Strong levels of liquidity and access to the Bank of England TFSME
with contingent liquidity pre-positioned”
15Mortgages
Gross mortgage lending amounted to £2,086m (HY 2019: £2,547m), whilst net lending
was £938m (HY 2019: £1,063m). We achieved strong net growth in our mortgage book Gross Mortgage Lending (£m)
in the period of 4.7% (HY 2019: 5.9%), without compromising the quality of our mortgage
assets
H2:
Helped 12,376 (HY 2019: 14,641) homeowners to purchase or remortgage their 2,347
properties. This included 2,369 first time buyers (HY 2019: 2,640) and 3,627 (HY 2019: 3,968
4,619) Buy-to-let borrowers 4,476 4,329
H1:
2,547
2,086
At 30 June 2020 the average indexed loan-to-value (LTV) of Group residential
mortgages on a valuation-weighted basis (calculated as the total outstanding balance
2016 2017 2018 2019 HY 2020
divided by the total fair value of collateral held) is 46.3% (HY 2019: 47.0%)
Suspension of in-person house valuations at the end of March impacted on the range of Geographically Diversified Residential Portfolio1
mortgage products, particularly in the high loan-to-value (LTV) range, that we could offer
in the short term. However, our agile response to expand the use of different valuation
techniques has meant we were able to continue to offer mortgages up to 75% LTV Key
throughout the restrictions, and we increased this to 85% LTV from June following the 0% - 5%
restoration of physical valuations 5% - 10%
10% - 15%
The Society set up a dedicated mortgage payment deferral mailbox, enabling customers 15% - 20%
to quickly log requests for help. In addition to quickly arranging over 22,000 mortgage
deferrals, the Society proactively called customers who had arranged a mortgage
deferral to check they had all the information and support they needed
At its peak, 15% of the Society’s borrowers had a mortgage payment deferral. At 30
June 2020, this figure had reduced to 5%
Mortgage payment deferrals are showing good signs of performance, as at HY 2020
98% of members who decided not to extend their payment deferral paid the full monthly
amount due on their mortgage in the following month
Channel Islands
Source: Skipton Building Society
1Representative of the Full year 2019 Group residential mortgage portfolio which include BTL and Equity Release
16Asset quality
Group residential mortgages in arrears by three months or
more, represented only 0.27% of mortgage accounts (FY Group Arrears
2019: 0.25%), which compares to an industry average of
0.74% of mortgages in arrears by more than three months* 2.5%
The percentage of mortgage accounts in arrears by three
months or more within Amber and NYM are 3.68% and
2.06% respectively (HY 2019: 2.21% and 1.40% 2.0%
respectively; FY 2019: 2.24% and 1.81% respectively). Both
books are closed to new business and have been in run-off
Arrears – Number of Accounts (%)
since 2008
1.5%
The quality of our mortgage assets has been maintained
through the application of prudent lending policy (see
appendix 3)
1.0%
The commercial lending portfolio, which has been closed to
new business since 2008, stands at £229.2m (or 1% of the
total mortgage assets) at HY 2020 (HY 2019: £253.5m; FY
0.5%
2019: £236.7m) with an average loan size of £248k. Arrears
levels within our commercial lending portfolio remain low,
however there was a charge to the Income Statement in the
period of £7.1m for the impairment allowance on this
0.0%
portfolio (HY June 2019: £0.6m credit; FY 2019: £0.2m
credit), driven by the change in forward-looking economic
assumptions impacting the IFRS 9 loan impairment models
Group 1+ MIA Group 3+ MIA
The quality of the Skipton International Limited book remains SBS 1+ MIA SBS 3+ MIA
good with only 2 cases in arrears by three months or more
(HY 2019: 1)
17
*Source: UK Finance industry arrears as at 31 March 2020Cost analysis
Precautionary steps in carefully managing costs has been a priority and despite increased costs as safety measures and home-
working provisions were introduced, costs are broadly flat in the period at £76.4m (six months ended 30 June 2019: £75.9m)
Despite flat costs, the cost income ratio for the M&S division has increased to 62.9% mainly due to the decrease seen in net
interest income
Cost income ratios have increased across the peer group over the past two years, driven by pressures on margin
The management expense ratio has improved as we continue to focus on efficiencies. This has been achieved whilst continuing
to invest in the future of the Society and enhancing our member offering. In 2019 we invested heavily in renewing our financial
advice customer proposition to provide a tailored service, making financial advice more accessible to more of our customers
Cost Income Ratio* (%) Management expenses over mean total assets (%)
62.90%
0.68%
60.20%
0.65%
56.20%
0.60%
2018 2019 HY2020 2018 2019 HY2020
“Strong focus on costs whilst continuing to invest in our services to our customers”
18
Source: Skipton Building Society *M&S division only.Funding
Funding Profile (%) The Group’s wholesale funding ratio increased to 20.3%
(HY 2019: 18.9%), this growth is in line with our balance
sheet strategy
10%
Our savings balances increased to £17.6bn compared with
15% 18% £17.4bn at FY 2019 (HY 2019: £16.7bn)
20% 20%
The Government’s Term Funding Scheme (TFS) was
closed to new lending in February 2018. In February 2020,
the Society repaid £400m of funding, as at HY 2020 the
Society had £1,250m of TFS outstanding (HY 2019:
£1,650m)
90% The Society has been accepted as a participant in the new
85%
82% Term Funding Scheme with additional incentives for SMEs
80% 80% (TFSME) but had not made any drawings by HY 2020
The Society’s wholesale funding strategy is to develop a
more diversified funding base across a range of maturities
and instrument type
As a result, in February 2020 the Society returned to the
securitisation markets for the first time in four years with
the Darrowby 5 transaction placing £500m of Class A
2016 2017 2018 2019 HY 2020 notes and retaining £100m of the AAA rated bonds for
collateral purposes
Retail Funding Wholesale Funding
19Estate agency
Estate Agency – Connells Group
The Society holds a 99.8% share holding in a real estate business called Connells
Connells has grown into the most profitable corporate High Street estate agency in
the UK which focuses on property sales, surveys and valuations, conveyancing,
lettings, asset management and mortgage and insurance broking
Connells also provides the Society with a unique insight into the housing market
through its circa 590 branches. This provides invaluable input into the Society’s
lending plans
The Society’s strong capital position is further reinforced by dividends from the
Connells group, which are invested back into the Society for the benefit of our
members and bolstering our capital position.
COVID-19 has presented an unforeseen challenging environment for Connells, which saw all of its UK branches close for two
months in line with Government guidelines to help efforts in preventing the spread of coronavirus. This has undoubtedly
impacted profits, with virtually no transactional business during lockdown. Consequently the Connells group reported a PBT of
£17.2m (HY 2019: £26.2m)
Connells moved effectively to home working and took swift and decisive action to manage its cost base and liquidity position; it
utilised the Government’s Coronavirus Job Retention Scheme (‘CJRS’) and placed almost 5,300 (76%) of its colleagues on
furlough, the majority of whom have now returned to work.
Connells supported its people during the furlough period by paying them 100% of basic pay throughout March to July, well
above the Government’s support of 80%.
In total Connells received £18.1m of CJRS support from the Government in the period, benefited £1.3m from business rates
relief and received £0.8m from the Retail Cash Grant Scheme. The Connells group also deferred £11.5m of its May 2020 VAT
liability.
“Connells will continue to generate strong profits and provides a dividend stream to the Society”
21
Source: Skipton Building SocietyEstate Agency – Connells Group
Positive future outlook
Despite the closure of the branches for two months the business will generate strong profits in 2020 but we recognise H2 2021 could be
challenging (i.e. post the stamp duty holiday) but the same executive team that successfully steered the business through the 2008/2009
Financial crisis are still there and they will tightly manage costs to off set any reduction in income
The Connells group has seen early signs of a positive recovery since the reopening of the housing market in May. Compared with the
same period last year, the month of July has seen a higher volume of second hand reservations than that experienced in 2019 and 2018,
it is not yet clear whether this will be sustained or whether it is just due to pent up demand
Compared with the same period last year, trading in July shows new applicant registrations and mortgage appointments up 37% and 56%
respectively, and sales agreed up by 33%. Homeowners continue to show a desire to re-enter the market, with market appraisal activity
up by 23% and new instructions increasing by 25%. The Stamp Duty Land Tax holiday will provide further impetus to the market
Asset management is a natural hedge to the remainder of the business and will naturally see profits fall slightly as the market improves,
but still remain a meaningful contributor to the Connells group
Weekly second hand reservations
2018 Actual 2019 Actual 2020 Actual 22Summary Performance
Strong CET 1 capital and leverage ratios of 37.5% and 6.0% respectively
Maintained excellent asset quality with low arrears levels
The mortgage book grew by £0.9bn to £21.0bn, a growth rate of 4.7% with tighter credit risk controls.
The Society quickly supported 15% of mortgage customers by arranging mortgage payment deferrals. 97% of
mortgage customers that choose not to extend their deferral period beyond June 2020 paid the full monthly amount
due on their mortgage in July
In February 2020 the Society returned to the securitisation markets for the first time in four years with the
Darrowby 5 transaction placing £500m of Class A notes and retaining £100m of the AAA rated bonds for collateral
purposes
The Liquidity Coverage Ratio was 173% and the liquidity ratio (as a percentage of shares and deposit liabilities) was
16.9%
“Presented strong financials and balance sheet growth whilst focusing on the safety of
our members and colleagues”
23The Proposed Transaction
Proposed Transaction – Summary of Key Terms
Issuer Skipton Building Society (the “Issuer”)
Offering Senior Non-Preferred Notes (the “Notes”)
Issue Format Reg S, Bearer, NGN
Issuer Rating Baa1 (Moody’s) / A- (Fitch)
Expected Issue Rating Baa2 (Moody’s) / A- (Fitch)
Ranking Junior to Senior Claims, pari passu with any other Senior Non-Preferred Claims; and in priority to all
other Subordinated Claims
Waiver of Set-off No Noteholder or couponholder may exercise, claim or plead any right of set-off, compensation or
retention
Redemption at Maturity At par
Loss Absorption Disqualification Event Redemption: Full or Partial Applicable – as set out in Condition 7(f) in the Base Prospectus
Exclusion
Loss Absorption Disqualification Event Redemption Price 100.00%
Redemption for Tax Reasons Applicable – as set out in Condition 7(b) in the Base Prospectus
Redemption Notice Periods Minimum period 15 days, maximum period 30 days
Gross up of Principal Not applicable
Use of Proceeds General corporate purposes including contributing to the Issuer’s Minimum Requirement for own funds
and Eligible Liabilities requirements
Denominations £100,000 and integral multiples of £1,000 in excess thereof
Substitution and Variation Applicable – as set out in Condition 7(k) in the Base Prospectus
Documentation Skipton Building Society £2,000,000,000 Euro Medium Term Note Programme Base Prospectus dated
11 September 2020 (the "Base Prospectus")
Governing Law English Law
Listing Official List of the London Stock Exchange
Restricted Events of Default Applicable – as set out in Condition 10(b) of the Base Prospectus
Clearing Euroclear and Clearstream, Luxembourg
Joint Lead Managers Barclays, Lloyds, NatWest Markets and UBS Investment Bank
Advertisement The Base Prospectus and the Final Terms (when published) will be available at:
https://www.skipton.co.uk/investorrelations/wholesalefundingprogrammes/emtnprogrammes
“To help us to meet our goal of helping more
people into homes through prudent and controlled lending growth”
25Contacts
Bobby Ndawula
Group Finance Director
E-mail - bobby.ndawula@skipton.co.uk
Tel - 01756 705271
Anthony Chapman
Group Treasurer
E-mail - anthony.chapman@skipton.co.uk
Tel - 01756 694686
Jeremy Helme
Head of Capital Markets
E-mail - jeremy.helme@skipton.co.uk
Tel - 01756 705978
Useful links
Main Website:- skipton.co.uk
Financial Results:- skipton.co.uk/about-us/financial-results
26Appendix
1. Underlying Group PBT

                                                                                                                         HY 2019                    HY 2020
                                                                                                                           £m                         £m

                    Total Group profit before tax                                                                           67.0                       34.4

                    Less profit on disposal of subsidiary undertakings                                                      (0.6)                      (0.5)

                    Add back fair value losses in relation to the equity release portfolio                                  12.5                       10.4

                    Add back fair value losses on share warrants                                                              -                         0.6

                    Add back impairment of goodwill and joint ventures                                                        -                         3.0

                    Less FSCS levy                                                                                            -                          -

                    Underlying Group profit before tax                                                                      78.9                       47.9

                                                                                                                         HY 2019                    HY 2020
                                   Underlying Group Profit before tax by division
                                                                                                                           £m                         £m

                    Mortgages and Savings                                                                                    51.5                      26.0

                    Estate Agency                                                                                            26.2                      20.8

                    Investment Portfolio                                                                                     1.7                        1.2

                    Sundry incl. inter-divisional adjustments1                                                              (0.5)                      (0.1)

                    Underlying Group profit before tax                                                                      78.9                       47.9

1 Sundry including inter-divisional adjustments relates primarily to the elimination of inter-divisional trading and the cost of the Connells management incentive scheme, which in   28
HY 2020 was a credit of £0.4m (HY 2019: credit of £0.1m).
2. Forward looking economic assumptions
Economic variables
As at 30 June 2020
(annual rate)
Scenario 2020 2021 2022 2023 2024
Upside 0.1 0.3 0.5 0.8 1.0
Bank of England base rate (%) (note 1) Base 0.1 0.1 0.1 0.1 0.1
Downside 0.1 0.0 0.0 0.1 0.1
Upside 6.5 5.0 4.6 4.5 4.5
Unemployment (%) (note 1) Base 8.0 8.7 8.0 7.0 6.0
Downside 8.5 11.5 10.8 9.0 7.2
Upside 0.0 6.1 4.1 4.2 4.2
House price inflation (UK) (%) (note 2) Base (4.9) 0.5 5.3 4.1 4.1
Downside (5.9) (14.9) 8.0 5.6 5.0
Upside 0.0 0.0 2.0 2.0 2.0
Commercial property price growth (%)
Base (6.6) (6.0) 0.0 0.0 0.0
(note 2)
Downside (15.3) (12.0) 0.0 0.0 0.0
Notes
1.The Bank of England base rates and unemployment rates are the position at 31 December each year.
2. House price inflation and commercial property price growth are the annual growth rate in each year. In addition to house price inflation, the Group’s impairment calculations also include a
‘forced sale discount’ reflecting the likely reduction in property price when selling a repossessed property. The forced sale discount is calculated at account level, taking into account the
specific circumstances of each account and the property in question.
The relative weightings assigned to each scenario have also been revised during the period taking into account the severity of the
scenarios which have been significantly updated to reflect the impacts of the COVID-19 pandemic and the level of uncertainty over the
economic outlook, both domestic and global
The Group’s scenario weightings as at 30 June 2020 were 60% for the base case, 5% for the upside scenario and 35% for the
downside scenario (30 June 2019: base case 55%, upside scenario 15%, downside scenario 30%; 31 December 2019: base case
50%, upside scenario 10%, downside scenario 40%)
293. Lending Policy
In order to be accepted for a mortgage the customer has to pass each of the following:
1) Application scorecard 2) Affordability Assessment and 3) Lending policy
Criteria Lending Policy
Maximum loan size £500k (at 95% LTV)
£500k – £625k (at 85% LTV)
£625k – £750k (at 80% LTV)
£750k – £1m (at 75% LTV) - Loans greater than £1m require senior management / Board approval
Maximum Loan to Value (LTV) Capital & Interest: 95%
Part & Part: 80%
Interest only: 70%
Where there is an element of debt consolidation the LTV is limited to a maximum of 75%.
Affordability The stressed mortgage payment is calculated on a Capital & Interest basis over the mortgage term requested at the
prevailing mortgage variable interest rate plus any rate loading. Where the product term is fixed for a period of 5 years or
more the stress rate is MVR +2% and for products term that is fixed for less than 5 years MVR+3%.
Residential Interest Only Not available to First Time Buyers. Affordability assessment calculated on a Capital &Interest repayment basis. Acceptable
repayment strategies are limited to ‘Equity in another property in the UK’, sale of a main residence property (Min £400k
Lending Policy equity), ‘UK shares and bonds held as investment’, ‘Cash savings in a UK deposit account’, ‘payment through an
endowment policy’, 15% pension as long as pension pot minimum is £250k.
Lending into retirement If retirementDisclaimer
NOT FOR DISTRIBUTION TO ANY U.S. PERSON OR TO ANY PERSON OR ADDRESS IN THE U.S., AS DEFINED IN REGULATION S OF THE U.S. SECURITIES ACT 1933, AS AMENDED.
IMPORTANT: You must read the following before continuing. The following applies to the presentation materials following this page, and you are therefore advised to read this carefully before
reading, accessing or making any other use of the presentation materials. In accessing the presentation materials, you agree to be bound by the following terms and conditions, including any
modifications to them any time you receive any information from us as a result of such access.
This presentation is the property of Skipton Building Society (the “Society”) and has been prepared by the Society for information purposes only.
By receiving this presentation, each investor (i) acknowledges that any offering is being made only outside the United States to non‐U.S. persons in reliance upon Regulation S under the U.S. Securities
Act of 1933, as amended (the “Securities Act”) and (ii) is deemed to represent that it is not a U.S. person within the meaning of Regulation S and is not accessing the presentation from a location
within the United States its territories and possessions (including Puerto Rico, the U.S. Virgin Islands, Guam, America Samoa, Wake Island and the Northern Mariana Islands or the District of
Columbia). If you are unable to agree to and confirm each of the items above, then you will not be eligible to view the presentation and you must destroy all copies of the presentation immediately
and notify us forthwith of having done so. This presentation is strictly confidential and intended only for use by the recipient. By electing to receive this presentation, you represent, warrant and agree
that you will not attempt to reproduce or re‐transmit the contents of this presentation in whole or in part by any means. Failure to comply with this restriction may constitute a violation of applicable
securities laws.
This presentation is an advertisement and does not constitute a prospectus or other offering document in whole or in part for the purposes of Regulation (EU) 2017/1129. Information contained in this
presentation is a summary only. Under no circumstances shall these presentation materials constitute an offer to sell or the solicitation of an offer to buy securities by the Society or by any of Barclays
Bank PLC, Lloyds Bank Corporate Markets plc, NatWest Markets Plc or UBS Limited (together, the “Managers”) retained by the Society for the transaction described herein. In particular, nothing in
this presentation constitutes an offer of securities for sale in the United States. Recipients of these presentation materials who intend to subscribe for or purchase any securities are reminded that you
must not make any investment decision whatsoever on the basis of this presentation, and that any investment decision for subscription or purchase must only be made on the basis of the information
contained in the base prospectus dated 11 September 2020 published by the Society, as supplemented (the “Prospectus”), and in particular, each reader is directed to the section therein headed “Risk
Factors”. The Prospectus is available at https://www.skipton.co.uk/investorrelations/wholesalefundingprogrammes/emtnprogrammes.
The securities referred to herein have not been and will not be registered under the Securities Act or the laws of any state or other jurisdiction of the United States, and may not be offered or sold
within the United States or to, or for the account or benefit of, U.S. persons (as defined in Regulation S under the Securities Act), absent registration or an exemption from, or in a transaction not
subject to, the registration requirements of the Securities Act and applicable state laws.
These presentation materials may only be communicated to persons in the United Kingdom in circumstances where section 21(1) of the Financial Services and Markets Act 2000 would not, if the
Society was not an authorised person, apply or to whom this document may otherwise be lawfully communicated. As such, this communication is made only to persons in the United Kingdom who (i)
are “investment professionals” within Article 19(5) of the Financial Services and Markets Act 2000 (Financial Promotion) Order 2005, as amended (the “Order”) having professional experience in
matters relating to investments or (ii) are high net worth entities falling within Article 49(2)(a) to (d) of the Order or certified high net worth individuals within Article 48 of the Order (together,
"relevant persons"). These presentation materials are directed only at relevant persons and must not be acted on or relied on by persons who are not relevant persons. Any investment or investment
activity to which these presentation materials relate is available only to relevant persons and will be engaged in only with relevant persons.
The securities referred to herein are not intended to be offered, sold or otherwise made available to and should not be offered, sold or otherwise made available to any Retail Investor in the European
Economic Area (“EEA”). For these purposes, a “Retail Investor” means a person who is one (or both) of: (i) a retail client as defined in point (11) of Article 4(1) of Directive 2014/65/EU (“MiFID II”); or
(ii) a customer within the meaning of Directive (EU) 2016/97, where that customer would not qualify as a professional client as defined in point (10) of Article 4(1) of MiFID II; or (iii) not a qualified
investor as defined in the Prospectus Regulation. Consequently no key information document required by Regulation (EU) No. 1286/2014 (the “PRIIPs Regulation”) for offering or selling the securities,
or otherwise making them available, to Retail Investors in the EEA has been prepared and therefore offering or selling the securities or otherwise making them available to any Retail Investor in the
EEA may be unlawful under the PRIIPs Regulation.
The information given in this presentation is not intended to be relied on either as particular advice or for making investment decisions. By receiving this presentation each investor is deemed to
represent that it is a sophisticated investor and possesses sufficient investment expertise to understand the risks involved in the offering. Investors must rely solely on their own examinations of the
Prospectus in making a determination as to whether to invest in any securities offered.
31Although the statements of fact in this presentation have been obtained from and are based upon sources that the Society believes to be reliable, the Society does not guarantee their accuracy, and
any such information may be incomplete or condensed. All opinions and estimates included in this presentation constitute the Society's judgement, as of the date of this presentation and are subject to
change without notice. There has been no independent verification of the contents of this presentation. It does not constitute or contain investment advice and nothing herein should be construed as a
recommendation or advice to invest in any securities. No representation, warranty or undertaking, expressed or implied, is or will be made by the Society, any Manager or any other person as to, and
no reliance should be placed on, the truth, fairness, accuracy, completeness or correctness of the information or the opinions contained in this presentation, or whether any information has been
omitted from it. To the fullest extent permitted by law, the Society, the Managers and their respective directors, officers, employees, affiliates, advisors and representatives disclaim any and all liability
whatsoever (in negligence or otherwise) for any loss however arising, directly or indirectly, from any use of this presentation or its contents or otherwise arising in connection with this presentation.
This presentation should not be construed as legal, tax, investment, financial, accounting, regulatory or other advice and the recipient is strongly advised to seek their own independent advice in
relation to any legal, tax, investment, financial, accounting, regulatory or other matters. Neither the Society nor any Manager acts as an adviser to, or owes any fiduciary duty to, any recipient of this
presentation.
Certain statements in this presentation may constitute "forward‐looking statements". These statements reflect the Society’s expectations and are subject to risks and uncertainties that may cause
actual results to differ materially and may adversely affect the outcome and financial effects of the plans described herein. You are cautioned not to rely on such forward‐looking statements. The
Society disclaims any obligation to update their view of such risks and uncertainties or to publicly announce the result of any revisions to the forward‐looking statements made herein, except where
they would be required to do so under applicable law.
This presentation contains certain tables and other statistical analyses (the "Statistical Information") which have been prepared in reliance on information provided by the Society. Numerous
assumptions have been used in preparing the Statistical Information, which may or may not be reflected in the material. As such, no assurance can be given as to the Statistical Information's accuracy,
appropriateness or completeness in any particular context, or as to whether the Statistical Information and/or the assumptions upon which they are based reflect present market conditions or future
market performance. The Statistical Information should not be construed as either projections or predictions or as legal, tax, financial or accounting advice.
A rating is not a recommendation to buy, sell or hold securities and may be subject to revision, suspension or withdrawal at any time by the assigning rating organisation. Similar ratings for different
types of issuers and on different types of securities do not necessarily mean the same thing. The significance of any rating should be analysed independently from any other rating.
If these presentation materials have been sent to you in an electronic form, you are reminded that documents transmitted via this medium may be altered or changed during the process of electronic
transmission and consequently neither the Society nor any Manager nor any person who controls any of them nor any director, officer, employee nor agent of any such entity or affiliate or any such
person accepts any liability or responsibility whatsoever in respect of any difference between the presentation materials distributed to you in electronic format and the hard copy version available to
you on request from the Society or any Manager.
32You can also read