St Helens Borough Local Plan Examination - Matter 2 Hearing Statement on behalf of Peel L&P - St Helens Council
←
→
Page content transcription
If your browser does not render page correctly, please read the page content below
St Helens Borough Local Plan Examination
Matter 2 Hearing Statement on behalf of
Peel L&P

May 2021
Contents
1.      The Local Plan Timeframe (Issue 1)                                                2

2.      Housing Need and Requirement (Issue 2)                                            3

3.      Employment Need and Requirement (Issue 3)                                         6

4.      Alignment between Housing and Employment Requirements (Issue 4)              16

Appendix 1: Property Market Assessment: Summary Proof of Evidence, Rory Brooke director
            and Head of Savills’ Economics Team and extract from main PoE

Appendix 2: Extracts of cited documents (footnote 10)

Word count: 3,273 words excluding headings, footnotes, figures and appendices

May 2021

                                                                                          1
1. The Local Plan Timeframe (Issue 1)
Q1: Are there any comments on the alternative end dates of 2035 (submission) and 2037
(possible MM)?
1.1 We strongly support the extension of the plan period to 2037 through modification.
This would be consistent with the NPPF 1.
Q2: Are there any comments on the implications of extending the period in such a way,
particularly for the housing and employment land requirement, taking into account
the Council’s comments?
1.2 We support the Council’s rolling forward of each requirement to cover the extra two
years, but maintain that the annual averages used – calculated over the submitted plan
period – underestimate the actual level of need for both housing and employment
land. The Council must therefore identify additional land to meet this higher need over
an extended period.
Q3: Are the different base dates for employment land and housing requirements
justified?
1.3 Whilst not ideal, we understand why the Council has based its employment land and
housing requirements to different years, this reflecting the timestamp of the different
datasets that feature in each assessment of need. We consider this approach to be
logical and justified, especially where the Council consistently identifies a residual
requirement from 2020 onwards.
Q4: Would a consistent base date for the Plan of 1 April 2016 have any implications for
the Plan in relation to meeting the area’s objectively assessed needs, particularly
relating to employment?
1.4 As we explain later, the supply of employment land would not be sufficient to meet
needs if such a change were made.
1
MHCLG (2019) National Planning Policy Framework (NATP001), paragraph 22
22. Housing Need and Requirement (Issue 2)
Q5: Do the circumstances, particularly relating to economic growth, support the
requirement for housing of 486 dpa as an uplift on the LHN figure?
2.1 The Council is correct in identifying that there are circumstances which support the
uplifting of the LHN figure for St Helens. As we previously noted 2, this is consistent with
national policy and guidance, the latter emphasising that the standard method
produces a ‘minimum need’ – to be used only as a ‘starting point’ – and describing the
Government’s support for ‘ambitious authorities who want to plan for growth’ 3. This
sentiment has been frequently repeated by Ministers since the standard method was
introduced4.
2.2 That said, the proposal to uplift the LHN figure by only 52 dwellings per annum (12%)
does not respond positively to the drivers of higher housing need in St Helens,
particularly where the uplifted figure remains 15% below the adopted housing
requirement of 570 dwellings per annum that the Council initially proposed to retain 5.
The implied reduction in need has not been properly justified or explained, and starkly
contrasts with:
• A national imperative to boost supply in the context of an acknowledged and
worsening housing crisis;
• The Government’s commitment to levelling up economic growth 6; and
• St Helens’ ability, acknowledged by the Council, to benefit economically from its
location and key assets.
Q6: Should the housing requirement be further increased to take into account economic
growth aspirations, choice and competition in the housing market and affordable
housing need?
2.3 Yes, as we maintain – in accordance with the PPG – that there is an evidenced need for
in the order of 600 dwellings per annum in St Helens 7.
2.4 Such a level of need and demand has clearly existed in recent years, when
acknowledged that an average of 601 dwellings per annum have been delivered over
2
See section 2 of our ‘Paper 2: Assessment of Housing Needs’ submitted with the Peel Group’s representations in
March 2019 for a review of appropriate national policy and guidance and its applicability in section 8 of the same
report
3
PPG Reference ID 2a-010-20201216
4
See section 2 of our Assessment of Housing Needs, submitted as Paper 2 of our Regulation 19 consultation
response in March 2019
5
In its Preferred Options Local Plan
6
The Government’s Plan for Growth, titled “Build Back Better”, was published in March 2021 and describes ‘the UK
government’s most important mission’ as being ‘to unite and level up the country, improving everyday life for
communities throughout the UK and ensuring everyone can succeed regardless of where they live’. It commits to
tackling ‘geographic disparities in key services and outcomes, like health, education, and jobs’ and supporting
‘struggling towns so that they see social, economic and cultural regeneration’ (p27)
7
This is the conclusion of our Assessment of Housing Needs, submitted as Paper 2 of our Regulation 19 consultation
response in March 2019
3the past five years 8 (2015-20). This has actually been broadly sustained since adoption
of the Core Strategy (CS) in 2012, with an average of 550 dwellings per annum
completed since that point. The proposed housing requirement is regressive in this
context and risks constraining the market, unjustifiably forcing a 19% reduction in
housing delivery relative to the last five years.
Figure 2.1: Proposed Housing Requirement Relative to Past Delivery
900
800
601
700 550
Dwellings per annum
+24%
+13%
600
486
500
400
300
200
100
0
Net completions Average in current plan period
Average over past five years Proposed requirement
Source: St Helens Council; Turley analysis
2.5 The Council’s evidence implies that reduced housing delivery would not obstruct its
economic growth aspirations, but – as explained in our previous submissions – we
remain seriously concerned that the approach taken in the evidence underestimates
the housing growth that will be needed to support future job growth in a sustainable
manner. This is because:
• The Council is implicitly and unusually relying on workers living elsewhere to fill
most of the jobs created on its employment sites. It entirely ignores a need for
around 110 homes each year by doing so, i.e. the difference between the
Council’s modelling and comparable analysis that takes a more cautious
approach to commuting and suggests a need for nearly 600 dwellings per
annum 9. There appear to be no plans to meet the residual need in surrounding
areas, nor is there any agreement from affected authorities that St Helens ought
to be entitled to rely on their resident labour force to the extent assumed. This is
an obvious failure of the Duty to Co-operate. Furthermore this adjustment in the
evidence base, which suppresses the need for housing in relation to employment
8
St Helens Council (2020) Local Plan: Authority Monitoring Report 2020
9
Based on modelling by Edge Analytics, summarised at Table 4.2 of our earlier Paper 2, which applies the ratio
recorded by the 2011 Census but also cautiously allows for a reduced outflow of residents from St Helens
4growth, appears to conflict with the Council’s firm desire for new logistics
schemes to create employment opportunities for local residents 10; and
• The Council’s calculations incorporate estimates of the jobs yielded by the
borough’s employment sites, but there are worrying inconsistencies for certain
sites – with some omitted altogether – and a general deviation from best
practice. Correcting these errors and applying more appropriate assumptions
would increase the Council’s estimates by nearly half, essentially returning to the
level of job growth envisaged in St Helens by the SHELMA 11 and generating an
associated need for more than 800 dwellings per annum 12.
2.6 Drawing together these concerns and the clear trends in past delivery, it is evident that
the proposed requirement for 486 dwellings per annum would not meet the housing
needs of St Helens. It must be increased towards 600 dwellings per annum as a
minimum.
Q7: Is the change in the housing requirement during the Plan preparation process
justified?
2.7 While it is not unreasonable for the Council to keep its housing requirement under
review, we are concerned by the unexplained suggestion that housing need has fallen
so markedly.
2.8 This plainly contrasts with evidence on the ground, where significant job growth is
planned and the scale of demand is already resulting in the highest delivery rates for
around 15 years. Such a boosting of supply is without doubt the goal of national policy,
including the standard method which the Council perversely references in attempting
to justify a lower housing requirement that would actually constrain the market in St
Helens.
10
This is exemplified, for example, in the Planning Committee Report (17/12/19) for the site of the former Parkside
Colliery. Here the Council emphasises the importance of the newly created jobs providing local employment
opportunities for people living nearby in some of the most deprived areas of the country. It stated in its assessment
of the associated economic benefits that ‘there is no guarantee that the development would give jobs to those in the
highest areas of deprivation but jobs will be created, the site will be accessible and a planning condition will require
that recruitment is directed towards local people in deprived areas’ (paragraph 7.78). This recognises that the
applicant proposes to implement a local employment strategy directly aimed at maximising local recruitment. Peel
has proposed a similar strategy as part of the signed S106 for the Haydock Point application. It is also noted that the
witness appearing on behalf of the Council at the public inquiry expressed a view, in the context of the weight given
to this factor, that ‘greater weight is appropriate because the development will provide employment opportunities in
an area of the highest need.’ (Alyn Nicholls, Proof of Evidence on behalf of St Helens Borough Council for the
proposed employment development and link road Parkside Colliery, paragraph 6.6, December 2020). Extracts of
these documents including these references are included at Appendix 2.
11
The Council assumes that its employment sites could yield a total of 11,697 jobs between 2016 and 2033, but
analysis by AMION Consulting (in Paper 2) suggested that this could be reasonably increased to 16,849 jobs or
17,872 jobs when extended to 2035. The SHELMA envisaged 17,100 jobs in St Helens under its “Growth Scenario”
12
Based on modelling by Edge Analytics, summarised at Table 4.2 of our earlier Paper 2
53. Employment Need and Requirement (Issue 3)
Q8: Is the employment land requirement justified and supported by the evidence?
3.1 No. Our responses to the questions below demonstrate that the proposed requirement
underestimates the full scale of need, as expressed in our technical submissions to the
Regulation 19 consultation reinforced by up-to-date evidence and market insight.
Q9: How does the figure compare with trends in the past take-up of employment land?
3.2 The Council’s requirement is fundamentally based on past take-up trends, assuming
that future need will be sustained at the rate of 5.8ha per annum recorded before
adoption of the CS in 2012.
3.3 We are strongly of the view that the true scale of demand for employment land
considerably exceeds this benchmark, as set out in our previous technical submissions
and subsequently reinforced by more recent property market evidence prepared by
Savills 13.
3.4 On the basis of available historic take-up data, the more positive period from 1998 to
2008 – in which an average of 7.5ha was taken up annually – appears to more
accurately reflect market sentiment now.
Figure 3.1: Employment Land Take-up in St Helens (1997-2020)
60
Employment land take-up (ha)
50
40
30
20
10
0
1997/98
1998/99
1999/00
2000/01
2001/02
2002/03
2003/04
2004/05
2005/06
2006/07
2007/08
2008/09
2009/10
2010/11
2011/12
2012/13
2013/14
2014/15
2015/16
2016/17
2017/18
2018/19
2019/20
Trend period used by Council Shorter period advocated Subsequent period
Source: St Helens Council; Turley analysis
3.5 Importantly, a past trend approach masks the fact that the take-up of B8 space even in
the shorter period advocated was constrained by an absence of larger strategic sites
13
Savills provided market evidence as part of the Haydock Point Inquiry held in early 2021, a summary of which is
provided at Appendix 1
6within the borough, and a diminished supply of sites suitable specifically for B8
distribution. This was conceded in the Council’s evidence at the time 14.
Q10: Is the Council’s position that past take up is primarily due to a lack of supply of sites
attractive to the market or are there other relevant considerations?
3.6 Insufficient provision for employment land in the CS has undoubtedly detrimentally
constrained take-up. In contrast to the Council’s newfound acknowledgement of the
importance of providing for a much greater need, Policy CE1 of the CS provided for
only 37ha of employment land to 2027 – equivalent to only 2.5ha per annum –
including only 15.45ha suitable for large scale B2/B8 15.
3.7 The failure of the CS to accurately forecast the growing need for such land, despite the
submissions of Peel and other parties at the time 16, has hampered the market’s ability
to satisfy demand and artificially suppressed take-up rates.
3.8 This issue also predates the CS, as shown in evidence prepared before its adoption 17.
This found there to be no employment land suitable for B8 use as of 2010, with only
around 6ha of such land taken up to that point from 2003 – a period of sustained
positive market growth nationally. In contrast, when there was land to be developed
between 1998 and 2003, the average annual take-up rate was some 6.6ha for B8 uses
only (8.8ha across all B-uses).
3.9 The Council’s evidence is therefore right to accept the limitations of viewing take-up
trends since the adoption of the CS as representative of future needs, as to do
otherwise would likely repeat the failures of the CS. However, in looking to present the
period prior to its adoption as being representative of future needs, it is also necessary
to acknowledge the longer-term nature of the constraints and equally importantly the
unprecedented strength of market demand from the sector now and for the
foreseeable future.
14
The St Helens Employment Land and Premises Study (EMP008) (May 2011) observes at paragraph 3.1.7 in
reflecting on past take-up evidence between 1998 – 2009 (noting that B8 take-up was 3.2ha of the 7.5ha) that there
appeared to be a lack of more modern B2 and B8 products which can compete with other commercial areas in the
North West with this particularly true with regard to the provision of larger strategic sites which can house large
operations. Similarly at paragraph 6.4.3 the report observes that there is no land specifically identified for B8 use
with this the main shortcoming in supply terms. Table 6.2 confirms this, showing that as at 2010/11 there was no
land classified as suitable specifically for B8 distribution in St Helens, where Table 3.1 shows that only around 6ha of
land was taken up by B8 uses since 2003/04 this would strongly indicate that the shortage of available land existed
for much of this ‘growth period’
15
Table 3, page 16 of the Employment Land Needs Study (EMP002) (October 2015), BE Group
16
St Helens Council Local Plan Core Strategy, Inspector’s Report (August 2012). The Inspector concluded at
paragraph 67 that ‘given the lack of convincing evidence at this stage that the North West’s regionally significant B8
employment needs cannot be appropriately met outside the Green Belt, it is unlikely that the exceptional
circumstances necessary to alter St Helen’s Green Belt boundaries to provide additional employment land could be
demonstrated.’ This conclusion was based on an acceptance of an evidence-based assessment of the need for only
37ha of additional land required for B1/B2/B8 uses (paragraph 66) where alternative higher estimates of need were
argued for (paragraph 60). The Council’s subsequent development of its evidence base has clearly affirmed that this
assessment of need has been proven to be a significant under-estimate, noting that it is understood to have been
based on a ‘labour supply’ approach (i.e. related to the projected growth in the population) where much higher
demand/ need has arisen as a result of behavioural changes/requirements in logistics which have had implications
for the take-up of land across the City Region as well as in St Helens.
17
St Helens Employment Land and Premises Study (EMP008) (May 2011)
7Q11: Does comparing the situation in St Helens with neighbouring authorities indicate that
there was a lack of suitably attractive sites?
3.10 Yes, as clearly explained in the Council’s evidence base 18.
3.11 Taking Warrington as a nearby and similarly-connected example, its published evidence
confirms that some 293ha of employment land was developed between 1996 and 2016
(14.7ha per annum). This was positively enabled through the allocation of circa 440ha
of employment land in the 2006 Warrington UDP. The 2014 Core Strategy retained this
positive approach.
Q12: If a lack of suitable sites was a factor, is it realistic to assume that once the supply of
sites is increased there will be a spur on development that will be above the forecast
average rate to 2037?
3.12 Yes. Where it is acknowledged that policy has historically constrained delivery, it is
notable that the early consents given to three sites proposed for allocation – the
Council here responding to ‘the urgency of addressing…need’ 19 – immediately led to a
surge in take-up. This transformed a situation, to 2018, where less than 0.5ha of
employment land had been taken up annually on average since the CS was adopted in
2012, to one where circa 7.3ha had been taken up annually over the extended period
to 2020 20. This essentially represents a return to the trend recorded in what the
Council’s evidence describes as the last ‘growth period’ 21 (1998-2008) when circa 7.5ha
of employment land was taken up annually on average. This return was indeed
foreseen by the Council’s evidence, which in 2017 described the market as being ‘on
the cusp of a growth period, driven by warehousing development’ 22.
3.13 This is particularly evident given the significant upturn in the need for additional
logistics land nationally and regionally.
Q13: More recent evidence post 2018 has shown an upturn in the take up of employment
land. Can this be primarily attributed to an increase in the availability of employment
sites or are there other relevant factors?
3.14 The Council’s belated appreciation of the urgency of the situation, in permitting three
separate developments, has naturally contributed to the reported upturn in take-up
since 2018.
3.15 The upturn could have conceivably been still more pronounced if further supply had
been available and its development supported through policy, given the sheer scale of
demand for logistics space. This has led to record levels of take-up in the North West in
2018 and again in 2020, the latter also being the ‘strongest year ever recorded’ for the
UK as a whole beating the previous record – set in 2016 – by a full third as shown by
18
See paragraphs 2.11 and 2.12 as well as Figure 1 in the Council’s Employment Land Needs Study Amended
Addendum (EMP001) (January 2019), BE Group
19
Paragraph 4.7 of the Employment Land Need and Supply Background Paper, October 2020 (SD022)
20
Based on data presented at Table 4.1 of the Council’s Employment Land Need and Supply Background Paper,
October 2020 (SD022)
21
BE Group (2019) Employment Land Needs Study Addendum Report (EMP001) paragraph 1.3
22
Ibid, paragraph 2.18(4). While contained in a document that was ‘amended’ in January 2019, the same statement
was included in the original draft produced in October 2017
8Figure 3.2 23. It is notable that nationally take-up over the last seven years has far
exceeded that seen prior to 2008, illustrating a distinction in the more pronounced role
that warehouse demand has played in this recent period.
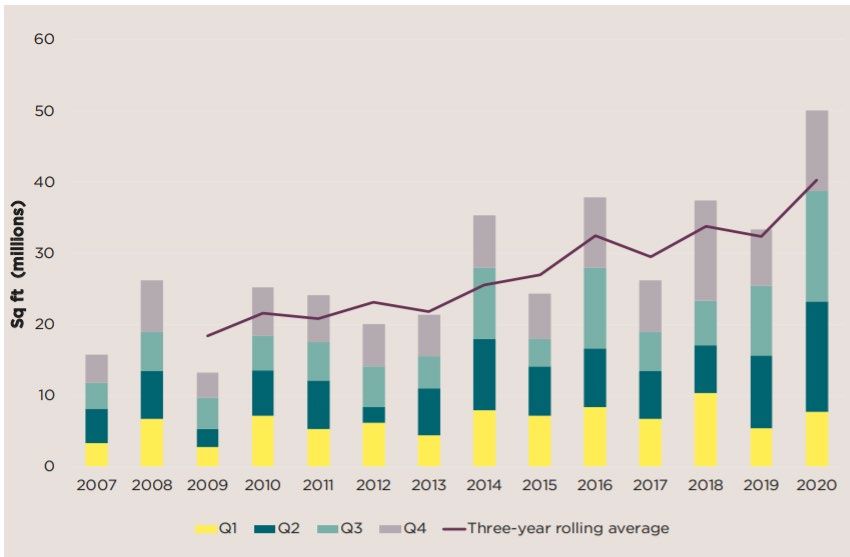
Figure 3.2: Take-up of Warehouse Space in the UK (2007-20)
Source: Savills, 2021
3.16 This has been driven by a combination of factors, not least the pandemic in the last
year and its acceleration of the long-term and significant shift to online shopping.
Figure 3.3 shows that around one in every three pounds spent on retail in the UK is
now spent online, and the long-term implications for logistics are shown by a recent
survey which found that a majority of people expect to keep ordering the same
number of home deliveries as they have over the past year, or actually expect a further
increase 24.
23
Savills (January 2021) UK Logistics; Big Shed Briefing
24
Barclaycard (March 2021) Lockdown legacies: the 10 shifts in consumer behaviour for retailers to be aware of
9Figure 3.3: Internet Sales as Proportion of Total Retail Sales (2006 – 2021)
40%
35%
Internet sales as % of total retail sales
30%
25%
20%
15%
10%
5%
0%
Jan
Jan
Jan
May
Mar
Mar
Sep
Feb
Dec
Mar
Sep
Feb
Dec
May
Sep
Feb
Dec
May
Jul
Oct
Jul
Nov
Apr
Oct
Jul
Aug
Jun
Nov
Apr
Aug
Jun
Oct
Nov
Apr
Aug
20062007 2008 2009 2010 2011 2012 2013 2014 2015 2016 2017 2018 2019 20202021
Pre-pandemic Since March 2020 Linear (Pre-pandemic)
Source: ONS
3.17 Where the scale of evidenced demand in the last year can be judged as being driven by
unique circumstances, there is no evidence from the market that the demand for space
will deviate from the growing trend seen previously and certainly for the purposes of
ensuring an adequately flexible supply of land now. As we reference below, the LCR’s
designation as a Freeport will further drive demand in this area for the foreseeable
future.
Q14: The employment land requirement historic take-up methodology used to calculate
the OAN has a base date of 2012. This is because the evidence suggests that take-up
rates since then have been low. Is this approach justified?
3.18 We do not contest the use of 2012 as a base date for the assessment, where such an
approach assists in retrospectively compensating for the inadequacies of a CS adopted
in that year. We nonetheless urge caution before assuming that take-up has only been
constrained since 2012, as our earlier responses demonstrate this is a long-term issue
which has undoubtedly affected the rates of take-up that the Council relies upon to
calculate future requirements.
3.19 Accounting for this and recognising the strength of demand for logistics space in
particular necessitates that future need is aligned with more positive trends, recorded
in the ‘growth period’ (1998-2008) and again more recently (2012-20), rather than
being necessarily limited to periods abutting the chosen base date.
10Q15: Would the inclusion of post-2012 take-up rates affect the historic baseline for
predicting needs? If so how?
3.20 Yes, extending the period used as the baseline (1997-2012) to incorporate post-2012
data would elevate the average by 9% to 6.3ha per annum 25, largely due to a single
strong year (2019/20) – shown at the earlier Figure 3.1 – that arguably begins to offset
the effect of historic constraints.
3.21 Significantly, and as already noted, the average annual take-up rate recorded since
2012 closely aligns with the trend in the ‘growth period’ (1998-2008) that we
previously endorsed as a more reliable basis for the employment land requirement 26.
The recent trend reinforces this conclusion.
Figure 3.4: Average Annual Take-up over Various Periods
1997-2012 5.8
1997-2020 6.3
2012-2020 7.3
1998-2008 7.5
0.0 1.0 2.0 3.0 4.0 5.0 6.0 7.0 8.0
Average annual take-up (ha)
Source: St Helens Council; Turley analysis
Q16: What would be the implications for the Plan if the OAN requirement were reduced
by 4 (or 2) years?
3.22 For the reasons set out above we believe it would be incorrect and a failure to plan
positively to reduce the OAN by rebasing to 2016. We maintain that any decision to
rebase the requirement would require a proper reassessment of need to compensate
for undersupply in the years removed and more recent evidence of higher take-up.
Q17: How would these implications be addressed?
3.23 We do not believe that it is necessary to rebase the OAN.
25
Based on data presented at Table 4.1 of the Council’s Employment Land Need and Supply Background Paper,
October 2020 (SD022)
26
In our Review of St Helens’ Objectively Assessed Employment Needs, submitted as Appendix 2 of our main
response to the Regulation 19 consultation
11Q18: If changing the baseline date to 2016 affected the residual employment land
requirement, what implications would there be for the Plan?
3.24 For the reasons set out above, we do not consider it necessary or justified to rebase
the employment land requirement to 2016. A reasonable interpretation of the
evidence affirms that there is a higher residual need for employment land over the
plan period (2020-37) than presented in the submission version of the Plan.
Q19: How would these implications be addressed?
3.25 The Council will need to respond positively by identifying additional land allocations
and safeguarded land now in order to address the resultant shortfall.
Q20: Does the recent data demonstrate that there is a strong demand for large-scale
warehousing to serve the logistics sector?
3.26 Yes. Our previous technical evidence included a logistics market report prepared by
CBRE in February 2019, which highlighted the scale of demand then for such uses in St
Helens. In support of Peel’s case to the Haydock Point Inquiry, CBRE and Savills both
provided updated market evidence. The summary PoE of Mr Rory Brooke of Savills is
included as Appendix 1 to this statement. This affirms an expectation of increased
future demand.
Q21: Is the demand likely to be sustained during the Plan period on the scale envisaged by
the land allocated for this type of development?
3.27 Yes. There is clear evidence that there is an increasing demand for land to
accommodate large-scale warehousing in St Helens. The evidence provided by Savills 27
compellingly demonstrates this. This recognises the continuing growth in e-commerce,
necessitating further logistics capacity and driving demand for occupiers to be located
close to their consumer markets. It also recognises St Helens’ locational advantages in
capturing this demand, being midway between Manchester and Liverpool and the
access to significant sized markets north and south via junctions on the M6.
3.28 Furthermore, the close proximity and connectivity of St Helens to the Port of Liverpool
will serve to sustain demand, where since the opening of Liverpool2 represents an
increasingly important point of entry for goods coming into the UK. This has been
further enhanced through the recent designation of the Liverpool City Region as a
Freeport, which is expected to generate a further need for logistics infrastructure in
nearby locations.
Q22: An additional 55 – 65 hectares of employment land has been added to the baseline
demand to support additional need deriving from major projects and demand from
the logistics sector. Is this justified and consistent with national policy?
3.29 Yes. We support the Council’s positive response to this additional need associated with
the delivery of strategically significant major projects in the borough and the sub-
regional unmet need for large-scale logistics land.
3.30 The LCR’s draft Industrial Strategy states that ‘a central enabler to the delivery of LCR’s
growth ambitions is to provide the right mix of sites, buildings and facilities across the
City Region which are attractive to the market, facilitate investment and are essential
27
Referenced in previous responses and summarised at Appendix 1
12to both employment and productivity’ 28. This responds to the SHELMA and its
conclusion that 512ha of land should be identified throughout the LCR to meet large-
scale B8 warehousing and distribution needs over the period to 2043 29.
3.31 There is little evidence that other plans in the LCR have proactively sought to provide
for this strategic residual need to date, and it is therefore imperative that St Helens
responds positively in this regard.
Q23: Is the amount of land identified in addition to land that has already been identified
to meet the needs of large-scale warehousing from the logistics sector (such as at
Haydock and Parkside) justified?
3.32 It is clear that St Helens has a significant role to play in accommodating strategic and
growing demands for large-scale warehousing, requiring provision for a greater share
of commercial floorspace than is currently represented proportionally in the borough.
3.33 There is a proven unmet need for such land within the City Region but also more
widely in the region 30. In this context it is absolutely correct and necessary for St
Helens to make a separate additional allowance to contribute positively to meeting this
need in this plan period.
3.34 Furthermore, it has been consistently recognised that the timescales for the delivery of
Parkside remain uncertain 31 due to its dependency on resolving the provision of
complex rail and road infrastructure and securing associated public funding. Where this
constitutes a large proportion of the proposed supply, it is necessary to identify a
further supply of land which is suitably responsive should its delivery be delayed –
either wholly or in part – beyond the plan period. This is addressed in more detail in
subsequent matter statements.
3.35 In accordance with evidence submitted during the Regulation 19 consultation, we
conclude that the level of provision (65ha) is not justified or sufficient in this context.
This is understood to be broadly justified on the basis of the current share of such
floorspace 32 (16%) and evidently belies both the scale of ambition and the demand for
28
Draft Liverpool City Region Industrial Strategy (March 2020)
29
Paragraph 2.14(4) Employment Land Needs Study Amended Addendum (EMP001) (January 2019), BE Group
30
A point acknowledged in the Council’s evidence base at paragraph 2.3 of the Employment Land Needs Study
Amended Addendum (EMP001) (January 2019), BE Group. This is further evidenced within the evidence prepared
by Savills and summarised at Appendix 1.
31
The Inspector examining the adopted Core Strategy observed that ‘there could be no certainty that the Parkside
SRFI, which in any case would cater only for primarily rail-based B8 uses, would proceed’. (St Helens Council Local
Plan Core Strategy, Inspector’s Report, August 2012, paragraph 59). More recently the Council observes in SHBC001
under Q35 (page 27) that: ‘The employment land trajectory set out in the Employment Land Background Paper
(SD022) estimates that the Parkside East SRFI site is likely to be operational during the Plan period but may not be
fully operational until beyond the Plan period (by 2045)’. Further to this it is understood at the current point in time
that a business case for the required rail infrastructure has not been prepared adding to uncertainties as to the
delivery of this aspect of the required infrastructure, where the Council’s trajectory notes that it assumes a rail
terminal opening in 2026-2028.
32
The Employment Land Needs Study Amended Addendum (EMP001) (January 2019) paragraph 2.14 references
the fact that the SHELMA (SUB001) identifies a land requirement for large B8 floorspace by 2033 of 321ha and
512ha by 2043. The 16%, also referenced in the same paragraph, is based on Table 63 of the SHELMA (Page 159)
and represents the distribution of large scale warehouse floorspace in the LCR in 2014. Paragraph 4.12.11 of the
Local Plan 2020-2035 Submission Draft (January 2011) confirms the application of this share using the LCR need of
397ha for the period 2012 – 2037 (64ha).
13land in the borough relative to other authorities in the LCR. We maintain that providing
for 20% of sub-regional demand would be more reasonable, with the Council’s
evidence conceding that basing the proportion on the current share (as of 2014) again
risks embedding the effects of a constrained supply where St Helens historically
accommodated much more than 16% of the LCR share of large-scale warehouse
floorspace when it did not have severe land supply constraints 33. An increase to at least
20% would be more representative of the suggestion that St Helens ‘is well positioned
to take a significant share’ 34 and would justify a greater allowance of circa 80ha.
3.36 It is separately observed that the subsequent Areas of Search Assessment 35 added a
10% buffer, resulting in a higher need of 437ha under the “do something” scenario
against which a shortfall of circa 90ha was identified (allowing for the assumed
inclusion of over 190ha of land in St Helens 36). This further challenges the sufficiency of
the separate additional provision to meet a strategic need.
Q24: Is there a risk that the potential for future growth in this sector may have been over
estimated?
3.37 No. As set out above, there is no evidence to suggest that demand from this sector will
abate and indeed there is clear evidence that its future growth will far exceed the past
trend in the borough.
Q25: Is an additional 5-year buffer necessary, justified and consistent with national policy?
3.38 Yes, as this will provide choice and indeed is standard practice as noted by the
Council 37.
Q26: How was the extent and nature of the buffer required identified?
3.39 This is for the Council to clarify.
Q27: Warrington Borough Council indicate in the SOCG (SD012) a need for 362
ha of employment land. However, that need has not been tested through
an examination. The Warrington LP will not be submitted for examination
until later in 2021 at the earliest. Does the above likely timeline have any
consequences for the Plan?
3.40 We do not believe so, as plans inevitably progress to different timescales and the
Council is ultimately here acting in a positive and co-operative manner.
33
This is clearly acknowledged at paragraph 2.14(4) of the Employment Land Needs Study Amended Addendum
(EMP001) (January 2019), BE Group. It is noted that Figure 34 of the SHELMA (SUB001) which is replicated as Figure
1 of the ELNS Addendum shows that in contrast to a number of other authorities St Helens saw very little land
taken-up between 2008 and 2014 where its share following the period of stronger growth and prior to the CS would
have been much greater
34
Paragraph 2.15 Employment Land Needs Study Amended Addendum (EMP001) (January 2019), BE Group
35
Liverpool City Region Areas of Search Assessment (SUB003) (August 2019) GL Hearn
36
Ibid Addendum Sheet (SUB004) (November 2019). This identifies sites in St Helens suggested as providing for just
over 190ha Strategic B8 supply. It is noted that the refusal of Land to West of Haydock Industrial Estate is factored
into the total generating a shortfall of just over 94ha.
37
Response to PQ39, SHBC001 (January 2021)
14Q28: Is the provision of 31 ha of employment land to meet some of Warrington’s needs
justified?
3.41 This is for the Council to clarify, in the absence of a Statement of Common Ground
from Warrington.
154. Alignment between Housing and Employment
Requirements (Issue 4)
Q29: Is there sufficient evidence to indicate a clear alignment between housing and
employment land requirements, particularly given the different base dates referred
to above?
4.1 We do not believe that the different base dates cause misalignment between housing
and employment land requirements, particularly where residual requirements are
consistently calculated from 2020 onwards.
4.2 We are far more concerned by the unconventional assumptions made by the Council in
claiming that there is indeed alignment between its housing and employment land
requirements, covered under Issue 2. As explained in those responses, these
assumptions lack justification and serve to understate the housing needed to service
even the existing portfolio of employment sites, which should be augmented through
additional supply to meet needs in full.
16Appendix 1: Property Market Assessment:
Summary Proof of Evidence, Rory
Brooke director and Head of Savills’
Economics Team and extract from
main PoE
Property market evidence was submitted as part of the Haydock Point appeal
(APP/H4315/W/20/03256871), the inquiry for which sat in January 2021, on behalf of the
applicants Peel L&P Developments Ltd. This was captured within the Proof of Evidence (PoE) of
Rory Brooke from Savills, which was written in the context of the five appeal sites which were
subject to the co-joined inquiry. Peel has requested that this PoE be included within the
examination library alongside other relevant appeal documents. The Summary PoE of Mr
Brookes is included in this appendix with pertinent points noted below:
• Mr Brooke identifies a number of reasons which suggest that it is appropriate to
assume that future average demand for large scale logistics uses will be higher than
historic rates. He notes these as including:
(i) the continuing shift to on-line retail
(ii) the Liverpool SuperPort and the shift towards port oriented national logistics
clusters; and
(iii) the current in-balance in the market with significant under-supply
• Mr Brooke concludes that the consequence of taking these factors into account is to
assume that future average annual demand will be around 30% higher than historic
annual average demand.
• With reference to the five appeal sites, Mr Brooke concludes that if all of these were
not allowed then there would be a deficit of around one to four years worth of supply
for the 500k+ sq.ft market and a deficit of around one year of supply in the 100K+ sq.ft
market. This suggests that if all five appeal sites were refused demand and need would
not be met and the market would remain significantly below its equilibrium vacancy
rate. In addition what alternative supply there is has a significant reliance on just one
site, Land at Bradley Hall Farm, Cliff Road (within Warrington Garden Suburb) which is
in the Green Belt and is not certain to come forward in the timescale.
• He concludes that this would mean that the North West economy would not be able to
grow as it would otherwise with consequent negative impacts on GVA and jobs.
Within his full PoE Mr Brookes gives more detailed consideration to the drivers of future
demand including consideration of the impact of the Covid-19 Crisis and Brexit on current and
future demand. An extract of section 8.4 of his PoE is also included within this appendix.
17Peel L&P Development Limited January 2021
Haydock Point Appeal
Property Market Assessment
Summary Proof of Evidence
Rory Brooke
Appeal by Peel L&P Development Limited
Haydock Point
PINS REFERENCE: APP/H4315/W/20/3256871
savills.co.ukHaydock Point Appeal
Property Market Assessment, Rory Brooke Summary Proof of Evidence
Contents
Summary and Conclusions 2
Personal Details .................................................................................................................................... 2
Scope of Evidence ................................................................................................................................ 2
Haydock Point and the Co-Joined Appeal Schemes ............................................................................ 2
Approach to Assessment of Market Need ............................................................................................ 3
Demand................................................................................................................................................. 3
Supply ................................................................................................................................................... 4
Supply and Demand Balance ............................................................................................................... 4
Economic Benefits ................................................................................................................................ 5
Peel L&P Developments Ltd January 2021 1Property Market Assessment: Summary Proof of Evidence
Haydock Point, St Helens
Summary and Conclusions
Personal Details
My name is Rory Brooke. I have a bachelors in Mathematics and Economics from the University of York
and a Masters in Town Planning from Cardiff University and am a member of the Royal Town Planning
Institute (RTPI) and the Institute of Economic Development (IED). I have 30 years experience working in
the fields of economics and planning. I have been at Savills close to five years, am a director and head of
the Savills Economics team.
I have worked on a wide range of employment land reviews for local authorities and market demand studies
for the public and private sector. These include work for Manchester City Council assessing the markets
for development around Manchester Airport and Manchester Piccadilly stations and work for Highways
England looking at the employment and housing property markets around the M60.
Scope of Evidence
This proof of evidence covers my analysis of overall demand for and supply of space for logistics and
industry in appropriate property market areas in the North West of England, with attention on the market
for larger units and in particular for units above 100,000 sq.ft (9,300 m2) and 500,000 sq.ft (46,500 m2). I
consider the context of the North West region and the property market area broadly following the M6
corridor between Manchester and Liverpool. I consider the potential role the Haydock Point site would play
in addressing demand/need and how it compares to alternative sources of supply.
Haydock Point and the Co-Joined Appeal Schemes
Haydock Point is a particularly attractive scheme for large scale logistics occupiers. It is a highly
advantageous position on junction 23 of the M6 where it intersects the A580 and A49, can accommodate up
to around 1.8 million sq.ft (167,000 m2) and is particularly rare in being able to accommodate a single unit
of almost 1 million sq.ft. If the appeal is allowed it will be able to come forward in the next five years.
In total the five co-joined appeal schemes propose around 6.1 million sq.ft (570,000 sq.m) of logistics and
industrial space. Around 50% of this is proposed for units of over 500k sq.ft and 47% for units between
100k sq.ft and 500k sq.ft. Haydock Point makes up 31% of the units over 500k sq.ft and it and Omega
South West are the only schemes that offers units of around 1 million sq.ft.
Peel L&P Developments Limited January 2021 2Property Market Assessment: Summary Proof of Evidence
Haydock Point, St Helens
Approach to Assessment of Market Need
My approach focuses on estimating future demand for greenfield and long term brownfield land for logistics
and industry by reviewing historic data on completions of such space, assessing how this could change in
future, and projecting the adjusted trends forward. This approach is similar to the approaches used by
relevant local authorities in the region.
The relevant property market area (PMA) for Haydock Point and the other appeal sites is locations with
easy access to the national motorway network in the M6 corridor between Liverpool and Manchester. Exact
boundaries will vary between occupiers and I have considered a Core M6 PMA of St Helens, Warrington
and Wigan local authorities and a relatively wide PMA covering 11 local authorities as reference points.
These PMAs partly overlap with the Liverpool City Region and partly overlap with the Greater Manchester
Spatial Framework (GMSF) authorities. Neither of these city areas fully capture the M6 corridor market and
so a synthesised approach is relevant.
Demand
My review of historic market demand concludes that historic average demand for units over 100k.sq.ft on
greenfield and longer term brownfield land has been around 690k sq.ft p.a in the Core M6 PMA and around
1,150k sq.ft p.a. in the Wider M6 PMA. In terms of land I estimate this equates to a take-up rate of 18 ha
and 31 ha p.a. respectively.
I consider that there are a number of underlying factors that suggest that future average demand will be
higher than historic rates. Relevant matters include:
the continuing shift to on-line retail
the Liverpool SuperPort and the shift towards port orientated national logistics clusters, and
the current in-balance in the market with significant under-supply.
Taking these factors in to account, and drawing on the work for the Liverpool City Region and GMSF, I use
a similar uplift factor to these two major local plan evidence research exercises of an uplift of around 30% on
historic growth. This gives an annual average demand for floorspace over 100k sq.ft of around 890k sq.ft p.a
in the Core M6 PMA and around 1,490k sq.ft p.a in the Wider M6 PMA . Converting this in to land gives a
requirement for 24 ha and 39 ha p.a. of greenfield/longer term brownfield land respectively.
Peel L&P Developments Limited January 2021 3Property Market Assessment: Summary Proof of Evidence
Haydock Point, St Helens
Supply
I have reviewed information on potential sites to meet this estimated demand. I have focused on sites that
could come forward in the next five years to meet the immediate pressing needs for large logistics space.
I estimate that in total, including land brought forward on the five appeal sites, there is around 242 ha of
land potentially available in the short term (1-5 years) and another 100 ha in the medium term (6-10 years)
in the Core PMA.
Supply and Demand Balance
I have compared this supply with my estimate of demand. Given the current market is below an assessed
equilibrium vacancy rate/buffer allowance for buildings of 8% I have made an allowance for extra land and
development required to bring the market back to equilibrium. My analysis concludes that if the five appeal
sites are allowed there is around seven years worth of supply for the 500k+ sq.ft market and around eight
years worth of supply in the 100k+ sq.ft market to meet short-term (up to five years) of demand. This
suggests that if all five appeal sites were permitted and came forward in the short term then the market
would be roughly in equilibrium.
If the five appeal sites and are not allowed then I estimate that there is a deficit of around one to four years
worth of supply for the 500k+ sq.ft+ market and a deficit of around one year of supply in the 100k+ sq.ft
market. This suggests that if all five appeal sites were refused demand and need would not be met and the
market would remain significantly below its equilibrium vacancy rate. In addition what alternative supply
there is has a significant reliance on just one site, Land at Bradley Hall Farm, Cliff Road (within Warrington
Garden Suburb) which is in the Green Belt and is not certain to come forward in the timescale.
This would mean that the North West economy would not be able to grow as much as it would otherwise
with consequent negative impacts on GVA and jobs.
There are a number of reasons to conclude that my estimate of future demand may be an underestimate.
These include: the PMA area covers local authorities and so includes land that is too far away from motorway
junctions and not suitable for the market; the analysis does not take account of employment land lost to
other land uses with consequent reduction in total land; and does not taking full account of: non B2/B8 uses
that are appropriate uses on industrial land.
The Haydock Point site in particular is well placed to meet the pressing need for schemes. It offers the
Peel L&P Developments Limited January 2021 4Property Market Assessment: Summary Proof of Evidence
Haydock Point, St Helens
potential to accommodate a unit of almost 1 million sq.ft. While the market for such large units is lumpy and
so not easy to quantify there is likely to be periodic requirements for such space and very little alternative
to the Haydock Point scheme to accommodate this. In addition Haydock Point is ideally placed in the
M6 corridor to meet user requirements.
Economic Benefits
I have reviewed work estimating the economic and social benefits of the scheme for St Helens and the UK
more widely. The information and analysis is largely taken from the ‘Economic Statement - Update,
Haydock Point, PLP, May 2020’ document.
In summary the scheme is anticipated to generate benefits including:
• Up to 265 jobs per year for the five year construction programme
• 2,290 to 2,760 on-site full time equivalent (FTE) jobs in the completed development
• Significant wider multiplier effects resulting in a total net additional jobs of around 3,000
• Likely further significant jobs and economic benefits in terms of the role users of the park can
play in improving the overall efficiency of the North West and UK economies
• Apprentice opportunities for local people during the construction and operational phases.
• Peel have prepared a draft Local Employment Strategy (LES) that ensures that the benefits
for local people and businesses are optimised during each phase of the development.
The above estimates relate to a conventional economic impact assessment which limits itself to the on-site
jobs and the supply chains associated with these jobs. However in the case of strategic logistics and
manufacturing activities I anticipate that there will be wider benefits in terms of increased efficiencies across
a broad range of economic activities that benefit from cheaper and more timely delivery of goods. The value
of such logistics operations probably extends well beyond their immediate employment. I anticipate that
development on sites such as Haydock Point will play a valuable role in enhancing the economics of the
Manchester and Liverpool conurbations.
In conclusion the Haydock scheme is located in a borough with one of the most pressing needs for new
economic opportunities in the North West and it is expected to create significant new jobs, training
opportunities and wider social benefits for St Helens’ residents.
Peel L&P Developments Limited January 2021 5Haydock Point Appeal
Rory Brooke Property Market Assessment Proof of Evidence
Drivers of Future Demand in the PMA
Relevant positive factors that could affect future average annual demand include:
· Changes in the logistics and retail sectors including growth in internet shopping and consequent
warehousing requirements
· The impact of the Liverpool Port proposals
· Brexit, in potentially generating more need for warehouse space to hold goods.
Relevant negative factors that could affect future average annual demand include:
· Brexit, in potentially reducing economic growth
· Covid19 recession impact on overall economic health and performance.
The Haydock Point Total Logistics report 24 is one particularly detailed example of work looking at the
characteristics of and future trends in the logistics sector. Overall it concludes that there are a number of
reasons to expect the logistics sector to grow strongly in future years. I summarised examples of relevant
points in Section 4 above. This is further emphasised by strong demand for logistics space in the Covid19
crisis and a general view that this is accelerating existing trends rather than being a temporary change.
I have given more detailed consideration to the potential impact of the Liverpool Port proposals and my
analysis is presented in Appendix B. I conclude that the continuing development of the port is likely to
enhance demand in the sub regional distribution and warehouse market. Table 8.1 below is the Liverpool
City Region’s estimated increased secondary demand from Liverpool’s SuperPort (based on the increased
capacity of Liverpool2) on land required for warehousing via road over the next 20 year across the wider
city region. It shows that 340 ha is estimated to be required over the next 20 years, equating to 17 ha per
annum.
Table 8.2 LCR Estimate of Increased Demand Arising from Liverpool SuperPort
ha 0-5 years 6-10 years 11-15 years 16-20 years Total
Additional land needed (ha) 85 85 83 87 340
St Helens Share (16.6%) (ha) 14.2 14.2 13.8 14.5 56.7
Source: Liverpool City Region SuperPort (2014), Savills analysis
I recognise that the economic impact of both Brexit and the current Covid19 recession could negatively
impact on demand. Nonetheless, now that the Brexit trade deal is concluded I anticipate impacts of Brexit
are likely to be more modest than previously feared. Moreover whilst the Covid crisis has created a
substantial economic shock that should not be taken to mask that the fundaments of this sector of the
economy remain robust. Thus, whilst it is appropriate to carry out sensitivity tests on these possible impacts
24 Haydock Point Economic Statement Update May 2020, Appendix 1.
Peel L&P Developments Limited January 2021 58Haydock Point Appeal
Rory Brooke Property Market Assessment Proof of Evidence
and scenarios land use planning needs to be ready to respond to positive demands and so greater weight
should be given to potentially positive factors than negative factors.
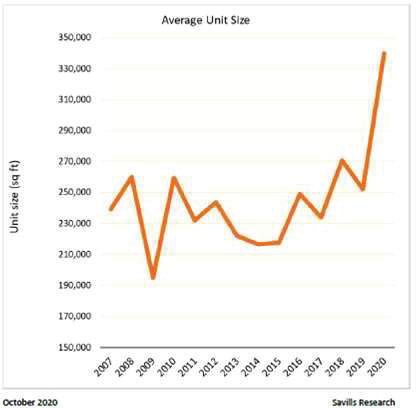
Savills research has found that the average size of new units has been increasing in recent years. Results
are shown in Figure 8.2 below.
Figure 8.2 Average Unit Size of B2/B8 Deals
LA Estimates of Adjustments to Future Demand in the PMA
The various LA studies informing their allocations and policies have considered the degree to which future
demand is expected to differ from historic demand. Relevant points include:
Peel L&P Developments Limited January 2021 59Appendix 2: Extracts of cited documents
(footnote 10)
St Helens Planning Committee Report (17/12/19)
Paragraphs 7.72 to 7.78
Whether there are significant economic benefits
Applicant’s case
7.72 As outlined in section 2, the applicant’s case of very special circumstances identifies that
the proposed development would have a significant positive economic benefit for the Borough
of St Helens. They submit that the development would result in an investment of around £77.9
million of construction related expenditure and provide 457 full time equivalent (FTE) jobs per
year across the Liverpool City Region during the three year construction period. Once the
development is operational, the applicant submits that the proposed development could
generate up to 1,327 FTE jobs based on national formulae or 1669 jobs based a similar jobs to
floorspace as Omega. The applicant also argues that the development would have a beneficial
impact on the locality in terms of expenditure and have a multiplier effect.
The Council’s assessment
7.73 The benefits set out above are reported in the applicant’s economic statement. In terms
of investment into the local economy, the applicant reports that they are based on industry
standards. It is difficult to assess the precise level of investment that would be brought about
by the proposed development, however, it is likely to be significant.
7.74 The development is speculative so there is no certainty over the level of jobs that would
be created. The figures suggested by the applicant are based upon the average number of
people employed per square metre supplied by Homes England and this is considered to be an
appropriate means of calculating the number of people that could be employed on the site,
this has also been backed up with an exercise comparing the jobs to floorspace ration at
Omega. On the basis of this evidence it is reasonable to believe that a significant number of
jobs would be created.
7.75 In summary, it is considered that the proposed development would result in a significant
investment into the local economy and would create/support a number of jobs during the
construction and operational phases. This should be given significant weight in favour of the
proposed development.
Whether there are social benefits
Applicant’s case
7.76 As outlined in Section 2, the applicant states that the Borough of St Helens has a number
of areas that are poorly ranked in the national indices of multiple deprivation with some of the
most deprived areas in the town of Newton-le-Willows and Earlestown.
7.77 The applicant submits that the proposed development will create significant skills and
jobs opportunities in Newton-le-Willows and Earlestown and the wider authority area. They
19You can also read