EU Salt Reduction Framework - Implementation of the Survey on Members States'
←
→
Page content transcription
If your browser does not render page correctly, please read the page content below
Survey on Members States’
Implementation of the
EU Salt Reduction
Framework
              Health and
              Consumers
European Commission

     Survey on Members States’
     Implementation of the
     EU Salt Reduction
     Framework

Directorate-General Health and Consumers
The information contained in this publication does not necessarily reflect the opinion or the position of the European Commission.

Neither the European Commission nor any person acting on its behalf is responsible for any use that might be made of the following
information.
Table of contents

Preface .........................................................................................   4

Context .........................................................................................   5

Relationship between salt intake and health issues .....................                            6

Progress since the adoption of the Salt Reduction Framework ....                                    7

The current level of salt intake throughout the EU ........................                         12

Majors sources of salt in the diet .................................................                16

Working with economic operators .................................................                   17

Monitoring approaches .................................................................             20

Factors influencing implementation ................................................                 21

Conclusions ..................................................................................      23

More detailed information about individual national salt
reduction initiatives .......................................................................       24
4

    Preface

    O    n 8 June 2010, the Employment, Social Policy, Health and Consumer Affairs
         Council adopted conclusions on action to reduce population salt intake for
    better health1. The Council Conclusions set out the political commitment by Ministers
    towards the shared objectives and goals of the common European Union Framework
    on voluntary national salt2 initiatives (the ‘Framework’)3 and gave added momentum
    to implementation efforts.

    The Conclusions welcomed the work on the Framework since 2008 of the High
    Level Group on Nutrition and Physical Activity (the ‘High Level Group’) chaired by the
    European Commission and confirmed the need for a regular monitoring to measure
    progress. Following the mandate of the Council, the Commission services compiled
    this report providing an analysis of the situation and actions taken in the European
    Union (EU) and its Member States in 2012.

    This report is an overview and synthesis of responses to a questionnaire sent to
    Member States in August 20124. The questionnaire sought to capture activities at
    national level from mid-2008 until mid-2012 that had taken place within the context
    of the Framework.
    .

    1
        OJ (2010/C 305/04)
    2
        http://ec.europa.eu/health/archive/ph_determinants/life_style/nutrition/documents/salt_initative.pdf

    3
        The nutrient that should be reduced is sodium. As most sodium is consumed in the form of sodium chloride, which is salt,
        the High Level Group decided to communicate about ‘salt’ and not about ‘sodium’. Moreover, this is better understood
        by the public. Therefore, this report mostly refers to the term ‘salt’. The amount of sodium is multiplied by the
        factor 2.5 to give the equivalent amount of salt.

    4
        Responses were received from 27 of the 29 participating European countries; 25 Member States of the EU plus
        Norway and Switzerland. The Czech Republic and Estonia did not submit a completed questionnaire. However, data
        from their responses to the 2009 survey was used for drafting some sections of this report
5

    Context
EU strategy on nutrition, overweight                                        salt and it generated momentum and measurable
and obesity related health issues                                           action. Salt reduction is only one element of the
                                                                            broader efforts on reformulation designed to improve
The Strategy for Europe on Nutrition, Overweight and                        the nutritional quality of foods, such as reducing the
Obesity related Health Issues, adopted in May 2007,                         content of total fat, saturated fatty acids, trans fatty
sets out the Commission’s priorities to contribute to                       acids or sugars.
reducing ill health due to poor nutrition, overweight
and obesity. One of these priorities is ‘making the                         In order to maximise the impact of salt reformulation,
healthier option available’, which encompasses                              food manufacturers were invited to prioritise products
actions on nutrient composition of manufactured                             with the largest market share. Furthermore, efforts
foods including food reformulation initiatives such as                      were to be designed for salt reformulation to take
salt reduction campaigns. The European Commission                           place across the full range of food products from
brought together a High Level Group of Member                               premium to economy items, so that all population
States’ representatives, aimed at addressing a range                        groups could benefit.
of health topics related to nutrition and physical
activity through the exchange of good practice.                             Implementation of the Salt Reduction
On 7 December 2007, the Council of Ministers of                             Framework
the European Union welcomed the initiative of the
European Commission to propose salt reduction as                            In September 2008, the European Commission invited
a first priority for discussion within the High Level                       the High Level Group members to inform on their on-
Group.                                                                      going or planned national salt reduction initiatives.
                                                                            All EU Member States, Norway and Switzerland
European Union framework for                                                responded to the survey.
national salt initiatives
                                                                            On 21 October 2009, the European Commission
Following two salt expert workshops that were                               organised a seminar on salt reduction in bread,
chaired by the European Commission in January and                           including technical, taste and other parameters for
June 2008, Member States agreed to the creation                             healthy eating, inviting national and EU level bakery
of a common European Union Framework on                                     associations. The International Federation of Plant
voluntary national salt initiatives. The Framework set                      Bakeries (AIBI) signalled that it was willing to be a
a benchmark of a minimum of 16 % salt reduction                             partner in salt reduction initiatives.
over 4 years for all food products, also encompassing
salt consumed in restaurants and catering. The                              Within the Salt Framework, it was agreed that by
Framework was approved by the High Level Group in                           the end of 2009, participating Member States would
July 2008, with the understanding that participation                        provide a first evaluation and monitoring report to
was voluntary. Member States had the flexibility to                         the Commission. In order to gather this information,
decide on different benchmarks or timelines in order                        the Directorate-General for Health and Consumers of
to tailor their initiatives to the national situation.                      the European Commission sent out questionnaires
                                                                            early 2010 to assess such data and information.
The overall goal of the Framework on salt reduction                         The results of this survey were set out in a report
was to contribute towards meeting the World Health                          published in the beginning of 2012.5
Organization (WHO) or national recommendations on
the appropriate level of salt intake. Five key elements                     On 8 June 2010, the Employment, Social Policy, Health
of a comprehensive approach towards salt reduction                          and Consumer Affairs Council adopted Conclusions
were identified: data collection; setting of benchmarks                     on action to reduce population salt intake for better
and major food categories; reformulation by the                             health. Following the mandate of the Council to
industry; raising public awareness; monitoring and                          analyse the situation and actions taken in the EU and
evaluation.                                                                 its Member States and report the findings in 2012,
                                                                            the Commission compiled this report. By updating
The Framework aimed to support and reinforce                                the first report that covered the first one and a half
national plans, enabling comparison of progress                             years of the Framework, the present report covers
across the EU. The common approach facilitated the                          the entire time span – 4 years – of the Framework,
delivery of coherent and coordinated messages to                            from mid-2008 until mid-2012.
the food industry about the importance of reducing

5
    http://ec.europa.eu/health/nutrition_physical_activity/docs/salt_report_en.pdf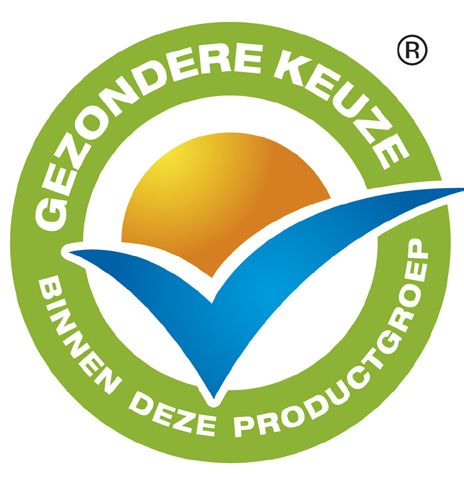
6

        Relationship between salt
        intake and health issues
    Salt and health                                                    Intake recommendations

    Evidence suggests that current levels of sodium                    The WHO recommends no more than 2 grams of
    consumption in Europe contribute to increased                      sodium (5 grams of salt) per day. Approximately
    blood pressure in the population, and a consequent                 ninety five per cent of sodium is consumed in the form
    higher risk of cardiovascular and renal disease.6                  of salt. According to Member States data collected
    There is a clear link between high sodium intake                   for the survey, the current daily salt consumption in
    and high blood pressure; likewise there is conclusive              most European countries is estimated or measured
    scientific evidence showing that reduction of sodium               to range between 8 to 12 grams per day, with few
    consumption reduces blood pressure. The greatest                   Member States above and few below this intake level.
    number of deaths attributable to cardiovascular
    disease occur in the upper range of the normal
    blood pressure, at levels which would currently not
    be treated with drugs. According to Eurobarometer
    data published in 2007, the most common cause for
    respondents to receive long-term medical treatment
    is high blood pressure (hypertension). Over a third
    (36 % EU-27) of respondents who are currently
    receiving long-term medical attention, mentioned
    this as forming part of the basis or the sole reason
    for such care.

    ©iStockphoto.com/monkeybusinessimages

    6
        European Food Safety Authority: Opinion of the Scientific
        Panel on Dietetic Products, Nutrition and Allergies related
        to the Tolerable Upper Intake Level of Sodium. The EFSA
        Journal (2005) 209, 1-26
7

Progress since the adoption of
the Salt Reduction Framework
Participating countries                                  National voluntary and legislative
                                                         approaches
Since the Framework was adopted, there has been
an increase in the number of countries with salt         The Framework describes a voluntary approach to
reduction initiatives in place. Today, a total of 29     work on salt reduction. Most countries follow such
European countries, consisting of all EU Member          a voluntary approach in their national initiatives.
States as well as Norway and Switzerland, have salt      Five countries combine a voluntary approach to salt
reduction initiatives in place.                          reduction with a voluntary labelling measure by
                                                         introducing healthy eating logos. Denmark, Norway
In a survey carried out by the European Commission       and Sweden have introduced the ‘Green Keyhole’
in 2010, many of the countries that had salt reduction   symbol, the Netherlands has the comparable ‘My
initiatives in place before the Framework was            Choice’ logo and Italy developed the ‘Smiling Heart’
adopted indicated that the Framework influenced          logo. Products that are using those logos have to
their activities. Bulgaria for instance, reported that   meet a number of nutritional criteria; maximum
whilst they had existing national activities on salt     levels of salt content exist for a number of product
reduction, the Framework had provided a model            categories.
for the national program and helped to support
action. Finland and Ireland said that the Framework      Thirteen countries (Belgium, Bulgaria, Finland,
had strengthened their approaches. Five countries        Greece, Hungary, Latvia, Lithuania, Netherlands,
(Belgium, Italy, Portugal, Spain and Switzerland)        Portugal, Romania, Slovak Republic, Slovenia and UK :
reported that the Framework served their national        Wales) combine a voluntary approach with legislative
frameworks to define and support the strategy            measures, about half of which were in place before
and to empower actions towards the different             the Framework was introduced. After the Framework
food sectors. Seven countries (Denmark, Germany,         was agreed in 2008, some of the existing laws were
Latvia, Luxembourg, Romania, Spain and Sweden)           tightened or new legislation was introduced.
said that it helped to trigger or increase dialogue
with stakeholders, especially the food industry.         With regard to legislative measures, laws limiting the
Eight countries (Austria, Cyprus, Greece, Hungary,       maximum salt content in bread or nutritional criteria
Malta, Norway, Poland and Slovenia) noted that           for mass caterers were most frequently reported.
the Framework initiated the strategic planning or        Seven countries (Bulgaria, Greece, Latvia, Lithuania,
national action on salt reduction. Portugal reported     Romania, Slovenia and UK: Wales) indicated
that national legislation on the salt content of bread   standards for mass caterers and foods allowed to
was triggered, as well as an increase of the value       be sold in schools involving criteria on salt levels,
added tax rate for salty products.                       covering kindergartens, schools or hospitals. Hungary
                                                         was in the process of drafting a law on nutritional
A number of countries highlighted the importance of      criteria for mass caterers, which had not yet been
the added European dimension that was introduced         adopted. Seven countries (Bulgaria, Belgium, Greece,
by the Framework to their national activities on salt    Hungary, Netherlands, Portugal and Slovak Republic)
reduction. The Netherlands and the United Kingdom        referred to maximum levels of salt for some food
(UK) noted that the EU Framework underlined the          categories, mostly for bread. While laws on maximum
shared European focus on the issue, even though          levels of salt in bread existed in Belgium, Greece
national activities had already started by the time      and the Netherlands before the Framework started
the Framework was adopted. France also stated            in 2008, the level in the Netherlands was tightened
that while their national policy on salt reduction was   in 2009 at the request of the bakery sector and
initiated in 2001, the European initiative confirmed     another tightening will take place per their request
and consolidated this national policy and referred to    in 2013. Finland reported their national legislation
the fact that different Member States act together,      on products entitled to EU subsidies, as well as
reinforces the activities. Furthermore, as Luxembourg    compulsory ‘warning labels’ for highly salty foods in
is widely dependant on the international marketplace     some food categories. Hungary and Portugal have
for food, they highlighted the importance and the        introduced taxes for some salted product categories.
need of EU-wide efforts and objectives for food          Detailed information about the different legislative
reformulation.                                           approaches in the EU is given in Table 1.
8

Table 1
Legislative approaches to salt reduction

                                                                                                     Year of introduction of
      Country            Approach                         Legal requirement
                                                                                                        law/modification
                                           Royal decree: bread max. 2% salt on dry matter
      Belgium            Max. level        (1.7% at flour or 1.2-1.4% salt on final product);                  1985
                                           not applied to imported bread

                                           Special Ordinance for healthy nutrition at schools:
                                           all school buffets and canteens and Special                         2009
      Bulgaria           Max. level        Ordinance for healthy nutrition at kindergarten:
                                           all kindergarten canteens: there are special                        2011
                                           requirements for salt reduction.

                                           Standards for flour and bread - 3 type of flour
                                           and 3 typical national type of bread (≤ 1,2 g
                                           salt/100 g bread); Bulgarian State Standards for
                                           milk products (Bulgarian white cheese - white
                                           cheese in brine – 3,5 ± 0,5% salt , Bulgarian
                                           yellow cheese - yellow cheese “Kashkaval” – 1,8
                                           – 3,0% salt); Approved standards “Stara planina”
                         Max. level                                                                          2011-’12
                                           for meat and poultry products (≤2 g salt/100
                                           g; for durable boiled smoked sausage – ≤ 3,5 g
                                           salt/100 g, Approved Branch Standard for lutenica
                                           (product from processed tomato and vegetable
                                           mixture - ≤1,7 g salt/100 g). Products produced
                                           according to Bulgarian State Standards should be
                                           with lower quantities of salt

                                           National legislation on compulsory ‘warning                   From the 1980’s
      Finland           Warning label
                                           labelling’ of high salt foods                                 Tightened 2009

                                           National legislation on products entitled to EU’s
                         Max. level        subsidies (School Milk Scheme): upper limit to salt                 2009
                                           content of eligible products (cheese in 1,3%)

                                           Quality criteria for meals to get subsidies for
                                           meals at university restaurants, have to pass;                      2011
                                           were renewed and now contain limits for salt in
                                           main meals and all meal components

                                           Food and Drinks Code of Greece:
                                           bread < 1.5% added salt
                                           Tomato juice: max. 1% salt
                                           Tomato concentrates:
                                                                                                               1971
                                           single concentration (i.e. tomato solids min. 22%)
                                           and semi-concentration (i.e. tomato solids at
      Greece             Max. level        least 16%) max. 2% salt; double-concentration
                                                                                                  Processed tomato products under
                                           (i.e. tomato solids at least 28%) and triple
                                                                                                              revision
                                           concentration (i.e. tomato solids at least 36%)
                                            – packages of up to 10 Kg net weight max. 3% salt
                                           – packages of more than 10 Kg net weight max.
                                           5% salt
                                           Concentrated Tomato puree paste: max. 4% salt

                                           Nutrient profiles that serve as the scientific basis
                                           for legislation regarding the list of foods allowed
                                           to be sold in school canteens include sodium level                  2006
                         Max. level
                                           requirements                                                 Revision in progress
                                           max. level of sodium in biscuits: 0.5 g/100g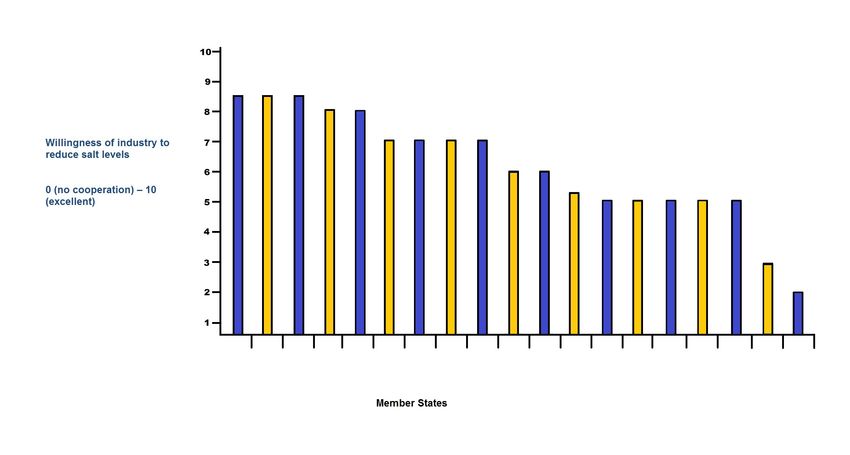
9

                               Codex Alimentarius Hungaricus modified salt
                               content for bread and some other bakery products
                               (on dry matter):
                               Certain bakery products (1-3/81-1): White bread:
   Hungary        Max. level   from 1.1.2015 >1.3%, < 2.5%                                           2012
                               from 1.1.2018 >1.3%, 1.3%, < 2.5%
                               from 1.1.2018 >1.3%,
10
Benchmarks and major food category with the food industry. Three countries
categories reported on general national reduction benchmarks;
Cyprus aims at a reduction of 10 % in 5 years, Malta
The Framework sets a benchmark of a minimum by 10 % by 2020 and Spain by 16 % in 4 years. Five
of 16 % salt reduction over 4 years for all food countries (France, Malta, Norway, Switzerland and
products, also encompassing salt consumed in UK: England and Wales) indicated population intake
restaurants and catering. Products should be reduced levels as targets for their national salt reduction
by 4% per year in order to allow consumers to adapt strategies.
to the slightly decreasing salty taste and in order
to ensure continuous progress. Member States The food categories identified in the Framework as
may set individual benchmarks as the Framework priority for activities match the food categories that
acknowledges the need for flexibility for Member most countries chose to focus on in their national
States to shape their approaches to salt reduction salt reduction initiative. Bread was most frequently
according to national specificities. Thirteen Member identified by countries, followed by meat products,
States (Austria, Belgium, Denmark, Finland, France, cheeses and ready meals. The number of food
Germany, Hungary, Lithuania, Portugal, Slovenia, categories which were in focus of national action
Spain, Sweden and UK: England and Wales) developed varied from one (Austria, Germany, Greece, Malta
or are in the process of developing specified national and Slovenia, all of them choosing bread) to all
benchmarks for salt reduction, covering between 1 to food categories containing salt (Belgium, France and
80 food categories. Switzerland noted that they are Spain) or to all those food categories which contribute
in the process of agreeing on target levels per food the most salt in the diet (UK: England and Wales).
Examples of specific reduction benchmarks or benchmarks that are under discussion for bread:
Austria: reduction by 15 % in 4 years
Denmark: reduction to a maximum of 1.1 to 1.2 g salt in 100g bread, depending on the kind of bread
Germany: working on a reduction to a maximum of 1.6 % salt in 100g fresh bread, depending on the kind of
bread (wheat, rye, etc.), timeline not yet defined
Ireland: reduction by 16 % starting from 2004
Italy: reduction by 15 % in 4 years
Lithuania: reduction by 5 % until 2013
Portugal: reduction to a maximum of 1.4 g salt in 100g bread
Spain: 18 % reduction starting in 2004; this was over-achieved
Slovenia: reduction to a maximum of 1.0 g salt in 100g bread over 10 years, reduction by 4% per year
UK (England and Wales): 2010 targets:
reduction to a sales weighted average of 1.1 g salt in 100g bread and rolls without additions
reduction to a sales weighted average of 1.3 g salt in 100g bread and rolls with additions
2012 targets:
reduction to a sales weighted average of 1.0 g salt in 100g bread and rolls without additions
reduction to a sales weighted average of 1.2 g salt in 100g bread and rolls with additions
Changes in salt intake Lithuania measured a decrease in salt intake by 26
%, 5.2 % and 27 % respectively for periods preceding
Ten out of the twenty-four countries reporting on the Framework. Four countries (Netherlands, Slovak
changes in the national salt intake stated that no data Republic, Sweden and Switzerland) could not detect
was available; about half of them reported that this a change in salt consumption for a period that was
lack of data was due to a lack of financial resources. partly covered by the Framework. Five countries
While one country estimated that salt intake had (Belgium, Finland, France, Hungary and Slovenia)
decreased (Cyprus), three countries indicated a reported that monitoring was planned over the
measured decline in salt consumption. England and next three years, and three countries (Germany,
Wales reporting from the UK, stated a continued Luxembourg and Portugal) plan to evaluate their
decline in salt consumption since they started their national salt intake levels in the next two years using
national initiative in 2000/2001; for the period of improved data collection methods. It is expected that
the Framework the average salt intake decreased by in the coming years, new data on intake and intake
around 0.5 grams per person, from 8.6 grams to 8.1 trends will be available, at least for some EU Member
grams between 2008 and 2011. Finland, France and States.11
Public Awarness Campaigns England) reported that their consumer education on
salt issues takes place as part of broader campaigns
Sixteen countries have developed public awareness and general nutrition education about a healthy
campaigns on salt in their country since the adoption diet. Finland noted that raising public awareness
of the Framework. For example, Cyprus developed a on salt is for them a much broader issue than
public awareness campaign on salt with a number having campaigns. They work on structural changes
of publications and initiatives; it was decided that to improve public awareness such as improving
one week per year in November is attributed to information via the educational system, labelling and
the prevention of hypertension and salt reduction. the health care system, viewing such an approach
Thirteen countries (Austria, Bulgaria, Czech Republic, as a more sustainable way of improving public
Denmark, Finland, France, Germany, Latvia, awareness. Such a holistic approach is also followed
Netherlands, Norway, Poland, Slovenia and UK: by other countries.
R
.
Denmark, Norway and Sweden are all promoting the ‘Green Keyhole’ labelling scheme and Denmark is running
a parallel public awareness campaign to highlight the benefits of the scheme in stores. In the Netherlands a
healthy choice logo called ‘My Choice’ has been introduced. Food products must respect specific maximum
salt levels for different product categories in order to bear those logos. Lithuania plans to introduce the’ Green
Keyhole’ labelling scheme at the end of 2012. In Italy a ‘Smiling Heart’ logo was developed for a program
on prevention of non-communicable diseases which appears on the packaging of reformulated, lower salt
products if authorized by the Ministry of Health. In the UK (England) a voluntary front-of-pack nutrition
labelling scheme was introduced with the aim to provide easy access to nutritional information per serving
for salt and other nutrients. Such a labelling scheme can support public awareness raising activities in the
UK (England) that aim at increasing the motivation of consumers to include the salt content of foods in their
decision making process when purchasing food.
Evaluation consumer behaviour. Ireland has run a series of
public information campaigns in partnership with
Only a few countries have undertaken definitive the Irish Heart Foundation. France has evaluated the
evaluations of their public awareness raising impact of healthy eating messages that included
activities, among them Portugal, Slovenia and information about salt.
the UK. Portugal ran campaigns for several years
with different intervals and target audiences. At the European level, awareness about the
Slovenia reported the results of their evaluation importance of avoiding eating too much salt
with computer-assisted telephone interviews in has increased since 2005. Data about the public
February 2011 as compared to baseline levels of perception of a healthy diet was gathered in October
public awareness about salt measured in April 2010 2009 as part of a special Eurobarometer survey on
before the campaigns started. The UK has a wide- health determinants7. Respondents were asked about
ranging campaign and referred to the information their perception of a healthy diet. In 2009, 24 % of
on its web-site. Bulgaria reported plans to evaluate the EU 27 mentioned ‘avoid/ do not eat too much
their campaigns in 2013. Denmark reported public salt’ as one of the issues involved, whereas in 2005,
awareness raising campaigns about the ‘Green 19 % (of EU25) mentioned the same issue.
Keyhole’ label in the fall of 2012 and their plan
to measure its effect in general as well as with
specific link to consumer knowledge on salt and
7
http://ec.europa.eu/public_opinion/archives/ebs/ebs_329_sum_en.pdf12
The current level of salt intake
throughout the EU
Salt intake of adults
Estimates of salt consumption since the 1990s in
nearly all countries show that intakes are too high
with the majority ranging between 8 and 12 grams Salt intake of children
of salt per day (Table 2, on page 14). Germany,
Cyprus, Bulgaria and Latvia reported the lowest Seventeen countries provided information on salt
estimates of salt intakes – 6.3 grams, 6.5 grams, intake in children, this information is summarised in
7.1 grams and 7.3 grams respectively. The Czech Table 3, on page 15. The different age ranges used
Republic reported the highest estimate of salt for the assessments hamper the comparability of
intakes at 13.6 grams per day, followed by Slovenia, the data. For the oldest age group of adolescents
Hungary and Portugal – 12.7 grams, 12.5 grams and (here defined as the age range between 14 or 15
12.3 grams respectively. Salt intakes are generally and 17 or 19) estimates of salt consumption are
higher in men than in women. For adult men, the salt available from five countries; Austria, Bulgaria,
intake range is from 6.5 to 16.6 grams per day, with Germany, Netherlands and Slovenia. Intake levels
data being currently unavailable in two countries. For range between 6.8 and 10.5 grams per day. The
adult women, the salt intake range is from 5.4 to intake levels in this age group were lower than the
12.3 grams per day, and data is again unavailable intake levels of adults in the same countries except
in two countries. The most striking examples of the for Bulgaria and Germany, where adolescents aged
gender difference in salt intake are in Latvia, the 14 to 19 had an intake level of 7.4 grams per day
Czech Republic and Lithuania where men’s salt intake (Bulgaria) or adolescents aged 15 to 17 had an
(9 grams, 16.6 grams and 10.9 grams respectively) intake level of 8.5 grams per day (Germany), which
is reported to be more than one third higher than for both countries was well above the average intake
women’s salt intake (5.6 grams, 10.5 grams and 7.1 level for the adult population at 7.1 grams or 6.3
grams respectively). grams respectively per day. In Romania an evaluation
for salt intake in children is in progress.
The regions with the highest reported salt intake
levels are East and South Europe, as demonstrated in
the map in Figure 1 on page 16, illustrating salt intake
levels of adults in European countries participating in
the Framework.8
8
Hungary, Norway and Sweden indicated salt intake levels for Figure 1 that differ from the average intake levels noted in Table 2.13
Data collection and accuracy of data The reported salt intake levels of different countries
in Tables 2 and 3 provide only a limited comparability
The data reported by Member States has been due to a number of factors, such as different data
collected from the 1990s through to 2012. collection methods, inclusion or exclusion of salt added
during cooking or at the table and different age ranges
The main collection methods used are: 24 hour covered. However, the reported data can serve as
dietary recall, collection of 24 hour urine samples orientation ranges describing the problem of excessive
and dietary records. The collection of 24 hour urine salt intake in the EU. When data from different studies
samples provides accurate information on salt intake was reported or ranges were given, the average was
at population level, but neither the origin of the calculated for comparisons.
salt nor the means to reduce it can be identified.9
In order to identify the dietary sources of the salt
being consumed, several other tools need to be
used, including evaluation of dietary intake (foods
consumed, amounts and frequency of consumption),
measurement of salt content in foods and assessment
of salt added during cooking or at table. The 24 hour
recall is an in-depth interview that collects detailed
information on all foods and beverages consumed
by a participant during the previous 24 hours and
is understood to be less accurate than 24 hour
urinary collection, because it usually underestimates
salt intakes. Also, dietary records are understood
to provide less accurate information about the salt
intake of populations.
©iStockphoto.com
For adults, only four countries had average estimates
of around 7 grams or less (Bulgaria, Cyprus, Germany
and Latvia) and all of these were estimated with
dietary studies and not with 24 hour urinary sodium
collections. All of the countries with the highest
estimates of salt intakes used 24 hour urinary sodium
collections to estimate salt intake, either alone
(Slovenia and Portugal) or in combination with the
24 hour dietary recall method that was repeated for
several days (Czech Republic and Hungary). Most of the
countries that had average estimates of between 8 and
12 grams of salt, used 24 hour urinary collections as
the method of assessment. Countries most frequently
used 24 hour urinary collections and a 24 hour dietary
recall method to assess salt intake.
For children, countries most frequently used dietary
records to estimate salt intake, followed by 24
hour recalls and, less frequently, food frequency
questionnaires and 24 hour urinary collections.
Sample sizes for studies with the collection of 24 hour
urine samples and dietary studies ranged from 143 to
4580 study participants.
9
World Health Organization: Strategies to monitor and evaluate population sodium consumption and sources of sodium in
the diet, report of a joint technical meeting convened by WHO and the Government of Canada, October 201114
Table 2
Estimates of salt intakes od adults and measurement method
Country Adult men Adult women Year Collection method(s) Sample size
3 day dietary record, 24 hour dietary
Austria 9 g/day 8 g/day 2000-7 3000
recall
Belgium 11.8-11.5 g/day 8.6-9.9 g/day 2009 urinary sodium for 24 hour collections 280
Bulgaria 6.8-8.9 g/day 5.9-6.8 g/day 2004 24 hour dietary recall 1022
Cyprus 5-8 g/day 5-8g/day 2005-8 24 hour dietary recall food frequency 1000
questionnaire
Czech Republic 16.6 g/day 10.5 g/day 2003/4 Repeated 24 hour dietary recall urinary 2590
sodium for 24 hour collections
Denmark 9.8 g/day 7.3 g/day 2003-8 7 day dietary record (salt added at 3354
dinner not included)
Estonia Approx. 10 g /day Approx. 10 g/day 1997 self reported data Ca. 1000
24 hour dietary recall (underreporters 2039
Finland 9.3 g/day 6.8 g/day 2007 excluded), 1518
2x3 day dietary records
7 day dietary record* 1920*
France 9.7*-9.9° g/day 7.4*-7.2° g/day 2006/7 3x24 hour dietary recall (including an 3115°
estimation of 1g table salt)°
Germany 7.1 g/day 5.4 g/day 2010/11 24 hour dietary recall 2000
Greece currently unavailable currently unavailable - - -
163*
Hungary 11.2*-17.2° g/day 9.6*-12.0° g/day 2009/10 urinary sodium for 24 hour 1165°
collections* 3x24 hour dietary recall°
Ireland 11.1 g/day 8.5 g/day 2007-10 urinary sodium for 24 hour collections 559
National sample
Italy 10.8 g/day 8.3 g/day 2008 urinary sodium for 24 hour collections of 1196 men and
1231 women
Latvia 9 g/day 5.6 g/day 2007-9 24 hour dietary recall, food frequency 2000
questionnaire
Lithuania 10.9 g/day 7.1 g/day 2007 24 hour dietary recall 3000
Luxembourg 9.1 g/day 9.1 g/day 2007/8 food frequency questionnaire 1432
Malta Currently unavailable Currently unavailable - - -
9.3–10.2* g/day 7.3–7.5* g/day 2x24h dietary recall*, urinary sodium 3819 incl children*
Netherlands 2007-10
10.1° g/day 7.5° g/day for 24 hour collections° 342°
Somewhat lower than food frequency questionnaire, 2x24 2672
Norway 10 g/day estimate 1997; 2010/11 hour dietary recall (including an
males 1787
estimation for table salt)
Poland 11.5 g/day 11.5 g/day 2009 household budget survey (whole 37 302
population)
426,
Portugal 12.3 g/day estimate 12.3 g/day estimate 2006 urinary sodium for 24 hour collections probably not
representative
Romania 12.26 g/day 10 g/day since 2010 7 day dietary record in national survey 1457
Slovak Republic 9.6-9.6 g/day 6.4 –6.8 g/day 2009 24 hour dietary recall and food 720
frequency questionnaire
Slovenia 14.3 g/day 11.0 g/day 2007 urinary sodium for 24 hour collections 143
Spain 11.5 g/day 8.4 g/day 2009 urinary sodium for 24 hour collections 406
Sweden 9 g/day 7 g/day 2011 4 day dietary record in national survey 1797
urinary sodium for 24 hour collections
Switzerland 10.6 g/day 7.3 g/day 2010/11 1448
and questionnaire
The United Kingdom: urinary sodium for 24 hour collections,
9.3 g/day 6.8 g/day 2011 547
England food consumption survey
The United Kingdom: 9.7 g/day
7.7 g/day 2008 (UK) urinary sodium for 24 hour collections 700 (UK)
Wales15
Table 3
Estimates of salt intakes of infants, children and adolescents and measurement method
Country Adult men Adult women Year Collection method(s) Sample size
3-6 y: 4.5 g/day 3-6 y: 4.5 g/day
Austria 7-14 y: 5.8 g/day 7-14 y: 6.9 g/day 2000-2 3 and 7 day weighted dietary record 989
15-18 y: 6.4 g/day 15-18 y: 7.1 g/day16
Major sources of salt in the diet
Bread Other food categories
Most of the countries which participated in the survey Most countries reported that apart from bread, meat
(23) reported on the food categories that were the major and meat products and dairy products (including cheese)
salt contributors in their national diet. Bread, cereals and were the most important sources of salt in their national
bakery products were reported to be the most important diet. In Spain and Norway, meat products accounted for
sources of salt in most national diets, except for the around one fourth of the total salt intake – 26 % and 24
Czech Republic, Poland and Romania where salt added % respectively. Among the 13 countries that quantified
during cooking is the most significant source of salt in the contribution of the different food sources to total salt
the national diet, and Norway and Spain, where meat intake, meat and meat products ranged between 8 % in
products were reported to be more significant sources of Switzerland to 26 % in Spain. However, in Switzerland
salt in comparison to bread. Among the 13 countries that this category was the third most important contributing
quantified the contribution of the different food sources food category to the overall salt intake. Many countries
to the total salt intake, bread ranged between 19.1 % that quantified the contribution of the different food
in Spain to 28 % in France. Nearly all countries that sources to the total salt intake, reported that meat and
quantified the contribution of the different food sources meat products contributed to around 10 to 20% of the
to total salt intake, reported that bread contributed with total salt intake.
around 20% or more of the total salt intake.
‘Cheese’ or ‘cheese and other dairy products’ contributed
to around 10 % of salt intake among most of the 13
countries that quantified the contribution of the different
food sources. Other product categories that were
frequently mentioned among the five most important
sources of salt intake were ready meals and soups.
Figure 1
Map with estimates of daily salt intakes (in g) of adults in European countries participating in the Framework
Cyprus
6-7
7-8
8-9
9-10
10-11
11-12
12-13
13 -14
14-15
n/a17
Working with economic
operators
Negociations with industry Industry engagement
Most of the countries (26) reported that they have There was a mixed, but overall positive response
had negotiations with food business operators or about the willingness of food business operators
associations representing their sectors. One country to engage. For example, the UK (England) reported
did not respond, and Sweden indicated that they that 71 % of the retail market and 48 % of the
were working only in the area of the ‘Green Keyhole’ catering market of the 80 largest high street caterers
labelling. While most countries had negotiations with committed to salt reduction and signed up to achieve
a range of industry sectors or their representing the national salt targets stated in the ‘Responsibility
associations, two countries (Germany and Malta) Deal’. Most countries reported that food producers
said that their negotiations were limited to the were willing to engage.
bakery sector so far. Luxembourg explained that
their activities were modest because the production Nineteen countries evaluated the willingness of food
business operators or their associations to reduce salt
levels in their products by giving a rating on a scale
©iStockphoto.com/AdShooter
from ‘0’ for ‘no cooperation’ to ‘10’ for ‘excellent’, as
illustrated in Figure 2. The average rating achieved
across the eighteen countries was ‘6’ wich asslightly
above the average value of the scale. Seventeen
countries evaluated the willingness of food business
operators or their associations to reduce salt levels
as average, here ‘5’, or better. Denmark reported
that in their country industry works hard with salt
of foods in their country is only marginal and that reduction.
they rely on efforts from the international food
market. Norway stated that they have previously had
negotiations as part of their general nutrition work,
but that they are planning new negotiations as part
of the implementation of their new strategy. One
country (Poland) said it had issued a questionnaire
to food companies to find out more about issues
relating to salt use in foods.
Figure 2
Member States’ evaluation of the willingness of food business operators or their associations to reduce salt
levels in their products on a scale from 0 (no cooperation) to 10 (excellent)
Portugal**:
Portugal gave a separate score for
small business related tio the lower industrial and
economic capacity (2.5) and big business (8)
Germany*:
Germany gave a range of 4 - 8 for the different
Willingness of industry to
associations involved
reduce salt levels
0 (no cooperation) to
10 (excellent)
Cyprus
Spain
Norway
Romania
Ireland
Bulgaria
Belgium
Switzerland
Netherlands
Germany*
Sweden
Portugal**
Hungary
Austria
Slovenia
Greece
Poland
Lativia
Malta
Member States18
Barriers for engagement ● Gradual reduction of sodium levels in dried
soups and sauces to 50 % of the Guideline Daily
Most countries reported that food producers were willing to Amounts i.e. 1.2 grams of sodium or less (Czech
engage. However, a few cited a range of potential barriers Republic)
including: ● Work towards specified benchmarks for salt
reduction in 77 product categories by November
● Not a lot of room for further reductions, 2013 (Denmark)
bakery sector with mainly small and medium
- sized businesses (Greece)
● Among the 31 charters that have been signed
● If imported products do not change, national in the food industry, 23 cover salt with concrete
producers are not willing to reformulate for reduction targets ranging between 5 to 22 %
financial, taste and technical reasons (Luxembourg) (France)
● 3 stakeholders out of the 25 that reject the national ● An agreement with the Hungarian Bakery
strategy are salt manufactures (Switzerland) Association was signed in January 2012 in which
the significant representatives of the Hungarian
● Smaller companies are less engaged than bigger bakers (1300 bakeries in the country) committed
companies; wililingness for engagement is high in to reduce the salt content of bread by 10.7 % by
general but currently reduced due to the economic
the end of 2014, and another 5.3 % by the end of
crisis (Portugal)
2017; a number of companies reported voluntary
● Food producers consider that reformulation salt reduction programs to the government
is linked to financial, taste and technological (Hungary)
aspects; mass caterers are less engaged than the
food industry (Poland) ● Work towards 16 % reduction as specified in the
Framework by 2012, starting with levels in 2004,
One country (Latvia) reported some reluctance by economic when the salt reduction initiative commenced
operators to engage; no experience of self-regulation was (Ireland)
named as a reason for the lack of interest, however, Latvia
reported that some food business operators cooperated ● A food industry taskforce on salt reduction had
by creating some products with lower levels of salt as a
committed to an average : 12 % reduction across
healthier option. Hungary specified that while there was only
all product categories between 2008 and 2010;
light willingness for active cooperation in the beginning, this
has been improved to a certain extent by the end of 2011. the bakery sector, both craft and industry, asked
the government to lower the maximum salt
The most frequently voiced doubts and constraints of food level in bread legislation from 2.5 % to 2.1 % on
business operators and their associations were lack of dry matter (or 1.8 % on flour base), which was
consumer acceptance for less tasty products, food safety introduced on 1 June 2009; as of January 2013
and technological problems, financial implications, and the a second reduction of the maximum salt level in
anticipated loss of sales. Other factors were named less bread legislation will apply, the maximum salt
frequently, such as a loss of food varieties and traditional level will be set at 1.8 % on dry matter (1.5 % on
products, already salt reduced products, issues related to flour base) (Netherlands).
the use of sodium replacers or legal problems.
● Salt in bakery products to be reduced by 4 % a
Concrete Agreements year, reduction to a maximum of 1.0 g salt in
100g bread over 10 years (Slovenia)
Out of the countries that have had negotiations with food
companies, 18 reported that they had reached concrete ● Signed agreements in 2004 with bakeries to
agreements whilst 4 had not. Cyprus and Germany stated reduce 18 % of salt in bread and bread products;
that they were working on reaching concrete agreements the objective was achieved; a new agreement with
with the food industry. It is unknown whether the remaining meat product producers has been signed, with a
countries have reached agreements with their food sectors benchmark of 10 % of salt reduction in 2 years
or not. (Spain)
Twelve countries had specific quantifiable commitments on ● A total of 10 commitments on salt reduction
salt reductions in any product categories: have been signed by food companies and
retailers within the initiative ‘Actionsanté’; the
● A 15 % reduction of salt levels in bread in 4 years targets are fixed on a case by case basis and the
(Austria). companies report annually; the corresponding
sectors are: bread and bakeries, meat products
● A 10 % reduction of salt intake in our population and convenience food (fresh and frozen); also in
by 2012 (reformulation and change in food habits) the catering sector companies are engaged in salt
(Belgium) reduction (Switzerland)19
● Businesses are working towards,on ● At the end of 2009, 26 of the major food
a cases by case basis, the Food industries in Portugal took the commitment
Standard Agency’s or the Public Health to reformulate the composition of their
Responsibility Deal salt targets for products and be evaluated until the end
2012; these targets will potentially of 2011; there are at present agreements
deliver a further 15 % reduction on the to reduce salt, but not in a quantifiable
salt targets set for 2010 (UK: England) manner (Portugal)
Six countries reported that they had achieved formal ● In November 2010 the Ministry of Health
agreements to collaborate but these were not and Romalimenta (Romanian Federation
quantifiable. These included: of Food Industry) signed an agreement
on reducing salt consumption in the
● A formal commitment for collaboration population, which involves provisions on
towards reformulation of dairy products food reformulation for salt (Romania)
was signed between the Association of
Milk Products Producers and Bulgarian Amongst the countries that responded to the survey
Federation of Dairy Products and the that there was no concrete agreement with industry,
Coordination Committee of the Food and Latvia explained that there is almost no experience
Nutrition Action Plan; some initiatives in the with industry self-regulation and voluntary measures
field of meat production (Bulgaria) in the country, which makes it difficult for the national
food processors to understand the essence of the
● Voluntary agreements with the association Framework initiative; also, national industry sees no
of craft bakers and the associations of benefit for them in the initiative. Therefore, Latvia
plant bakeries, as well as with producers of concluded that real changes could be achieved in
‘fresh pasta’ to reduce salt content in some the event that the salt content of food products is
of their products (Italy) defined by law.
● Significant progress achieved with salt free Endorsement of Framework’s Vision10
and low salt bread (Malta)
Twelve countries (Belgium, Denmark, France, Finland,
● A position paper concerning initiatives Hungary, Ireland, Italy, Portugal, Romania, Slovenia,
aimed at decreasing salt consumption in Spain and Switzerland) achieved broad endorsement
Poland was formulated by the National Food of the vision of the framework by food business
and Nutrition Institute under the patronage operators or representative sectorial associations.
of the Polish Minister of Health in 2008 Among the remarks made were:
in cooperation with representatives of
food industry organisations, governmental ● There is still room for improvement
organisations, consumer organisations, (Slovenia)
non-governmental organisations, science
representatives and others (Poland) ● Negotiations with all sectors of the
food industry are a continuous process
throughout the Agency’s work on
salt reduction which started in 2003
(Switzerland).
10
There is no data from eight countires regarding on whether they had achieved broad endorsement of the vision
framework by food business operators or representative sectorial associations, or not.
The experience in Ireland provides an example of how the food industry has supported the national
salt reduction campaign which has been running since 2004:
• A total of 63 food companies and trade associations are participating and have made written commitments to reduce salt
and report on their progress annually.
• All the major retailers and symbol groups have reported that salt is being removed from their own brand products.
• The catering trade and their representative bodies continue to promote salt reduction initiatives
• The Irish Hotels Federation launched a ‘Food for Kids’ initiative in July 2008. Some 250 hotels joined this initiative and
committed to not adding salt to children’s food at preparation, cooking or serving stages.
• The Irish Dairy Industries Association has undertaken to reduce salt in spread and butter by 2010 by 10% and 5% respectively.
• Major high street restaurant chains have all reported removal of more salt from products.20
Indications from other countries demonstrate Five countries (Bulgaria, Estonia, Latvia, Malta and
that there is still work in progress regarding the Sweden) indicated that they did not achieve broad
Framework’s endorsement. Austria reported that the endorsement of the vision of the framework by
Framework is endorsed to some extent while in the economic operators or representative federations;
Netherlands and the UK (England) the framework has however some progress was reported by Latvia
supplemented activities that they report as already where some food business operators agreed to work
on-going before the Framework was agreed. Norway on this issue.
indicated that there was willingness to contribute
to salt reduction among food producers since the
1980s, which increased since 2005 following the
international focus on salt.
Monitoring approaches
Most countries (24) indicated that they had a monitoring approach in place or planned, but four countries
(Cyprus, Estonia, Latvia and Sweden) indicated that they did not. One country did not provide any information
on this point. Sixteen countries analysed or planned to analyse the salt content of products. For example,
France monitors the evolution of the salt content of almost 400 main products every 3 years since 2003 and
since 2009 the evolution of the salt content of all products by category, sub category as well as per segment
of the market. Population salt intake was assessed for monitoring the initiative by fifteen countries. Four
countries (Denmark, Greece, Slovenia and UK) included evaluations of their awareness raising activities in
their monitoring approach. Two countries did not specify their monitoring approach in detail.
Results of the described monitoring were either generated at a regular interval, such as a yearly evaluation,
already available, or were frequently expected for the end of 2012, in 2013 or 2014.
©iStockphoto.com/Mableen21
Factors influencing implementation
©iStockphoto.com/duncan1890
Supporting factors
Sixteen countries reported on the major supporting factors in reaching results in their national salt reduction
initiatives between mid-2008 and mid-2012:
Stakeholders – the cooperation with stakeholders Industry support – industry support was mentioned
or media was noted by seven countries (Denmark, by four countries (Cyprus, Portugal, Romania and UK:
Hungary, Latvia, Poland, Portugal, Switzerland and England) as a major enhancing factor in reaching
UK: England) as a major enhancing factor in reaching results.
results. Switzerland noted that health concerns
everybody, stakeholders such as the medical Legislation – three countries (Hungary, Latvia and
profession, research, industry, non-governmental Portugal) identified new national legislation in relation
organisations as well as individuals. to salt content in foods as a support factor.
Government, governmental institutions – six Raising public awareness and reformulation
countries indicated governmental support, such as the – noted by Spain; Germany indicated that a higher
increased awareness and willingness to act among awareness in the public and in food producers
politicians (Greece, Romania) or the commitment of about the health implications of a high salt intake
the National Institute for Food and Nutrition Science is important, apart from less conflicting messages
(Hungary) as a major supporting factor. Slovenia and concerning the benefit of salt reduction in this context.
Cyprus mentioned the financial support as another In Ireland, state and voluntary bodies provided support
key factor. In Poland the Ministry of Health financed to increase public awareness.
the salt reduction programme for the period 2009 to
2011. Focus on biggest selling products in the market
– the UK (England) indicated that their focus on those
EU initiative – four countries mentioned the products was the major supporting factor for the
European dimension of the initiative as enhancing biggest salt reduction at population level.
their national actions. While Austria indicated that
the European-wide approach was a major supporting
factor, Belgium added that the existence of the EU
Framework maintained the pressure on food operators.
In Ireland, signing up to the Framework provided an
additional stimulus by the Department of Health who
brought key stakeholders together for workshops. It
also supported the drive for urinary sodium excretion
measurements. Bulgaria highlighted EU financial
support for the realisation on the national information
campaign for salt reduction in 2011 to 2012.22
Major challenges
Eighteen countries elaborated on the major challenges for the implementation of their national salt reduction
initiative from mid-2008 until mid-2012:
Working with industry: Ten countries said that Economic crisis – three countries (Hungary, Latvia
working with industry posed a major challenge, either and Portugal) considered it a major challenge to
to raise their awareness (Austria), to convince and implement the national initiative in a moment of
motivate them or to overcome their resistance to economic crisis.
act sufficiently (Belgium, Denmark, Latvia, Lithuania,
Slovenia and Switzerland) or to build a partnership with Raising public awareness about salt and health
them (Hungary). Romania specified the involvement – raising public awareness about salt and health
of medium and small food business operators as a was indicated by Spain as a major challenge. Ireland
major obstacle for progress while Poland identified stated that while industry targets are being achieved,
the lack of appropriate action of mass caterers as a especially among the major Irish exporters to the UK
major problem. who implement the UK target goals; a need was seen
for further salt reduction behaviours such as reducing
Lack of resources – overall eight countries referred added salt in cooking and at the table especially by
to a lack of different resource. Six countries (Bulgaria, Irish males.
Cyprus, Greece, Hungary, Malta and Sweden) indicated
the lack of financial or human resources as major Deciding on national targets – Denmark considered
challenges. A lack of expertise and baseline nutritional the completion of a target list with benchmarks for
information on foods in the local market was reported salt reduction in 77 product categories as a major
(Malta). Switzerland referred to the difficulty of challenge of their initiative.
obtaining precise data for convincing arguments for
salt reduction. Long legislative process – Hungary specified the
prolonged legislative process as a major challenge.
Future plans
Member States plan to continue their national initiatives on salt reduction beyond mid-2012. Fifteen countries
reported on their plans to raise awareness among consumers (Austria, Bulgaria, Cyprus, Spain, France, Greece,
Denmark, Hungary, Latvia, Poland, Romania, Slovenia and UK: England), health professionals (Bulgaria and
Denmark), or school health teams (Bulgaria and Portugal). Twelve countries (Belgium, Bulgaria, Malta, Slovenia,
Spain, Germany, France, Greece, Italy, Latvia, Lithuania and UK: England) envisage starting or continuing to work
with food business operators in order to achieve further decreases in salt content of foods or meals. Four of
those countries plan to involve the catering sector with different measures (France, Greece, Hungary and UK:
England). Furthermore, some countries (Belgium, Denmark, Spain, Malta, Netherlands, Slovenia, Slovak Republic
and UK: England) explained their plans to continue monitoring and evaluation activities. Other plans involved
revising nutritional guidelines (Finland), elaborating on the national initiative for the period 2013 to 2016
(Switzerland) or organising a regional meeting regarding salt reduction with neighbouring countries (Norway).
Ireland noted their plan to continue the national salt reduction initiative.23
Conclusions
The reduction of salt intake in populations is a step food business operators or representative sectorial
by step process as technological barriers and food associations were reached. Many countries have
safety concerns need to be addressed. Ensuring started awareness raising actions. Most countries
consumer acceptance by allowing for the necessary have a monitoring approach in place or planned, and
taste adaptation over time is a significant factor results are already published or are expected during
which also determines the speed of the relevant the coming two years.
measures’ implementation. This report illustrates the
first steps taken towards reducing the excessive salt Work in the coming years should focus on further
intake across the EU, one element for improving the increasing the number of quantifiable commitments
diet and promoting the health of Europeans. to reduction from the food industry and on evaluating
the results obtained from monitoring programs
While the economic crisis in Europe may have in Member States. The European Commission will
an impact on the funding available for public continue, through the supporting mechanisms of
health programmes, European as well as global the High Level Group on Nutrition and Physical
developments since the adoption of the framework Activity11 and the EU Platform for Action on Diet,
are expected to increase the momentum for salt Physical Activity and Health12, to secure quantifiable
reduction initiatives. commitments from the food industry and ensure that
effective mechanisms for monitoring salt reduction
This report shows that the EU salt framework has programmes are in place.
been a catalyst for action for a number of Member
States with new initiatives introduced across the This work should be further enhanced by the political
EU. Countries reported that the Framework provided momentum created in September 2011, when
a model for a national programme, it supported the United Nation’s General Assembly adopted by
pre-existing action, strengthened or broadened consensus the resolution on a Political Declaration
the approach or helped to increase dialogue with of the High-level Meeting of the General Assembly
industry. Furthermore, the added European dimension on the Prevention and Control of Non-communicable
introduced by the Framework to national activities on Diseases. Heads of State and Government and
salt reduction was highlighted as an asset. representatives of States and Governments,
assembled at this United Nations meeting committed
to work towards reducing the use of salt in the food
Most countries have had negotiations with food industry in order to lower sodium consumption.
business operators or representative sectorial The European Commission will continue its work to
associations. The overall willingness of food ensure the EU’s contribution in this respect.
business operators to engage was positive. Many
concrete agreements between Member States and
11
http://ec.europa.eu/health/nutrition_physical_activity/high_level_group/index_en.htm
12
http://ec.europa.eu/health/nutrition_physical_activity/platform/index_en.htmYou can also read


