PEST CONTROL SUB-SECTOR SKILLS PLAN - 2018-2019 Prepared on behalf of the Sector by AgriSETA
←
→
Page content transcription
If your browser does not render page correctly, please read the page content below

PEST CONTROL SUB-SECTOR SKILLS PLAN
            2018-2019
  Prepared on behalf of the Sector by AgriSETA

                    April 2018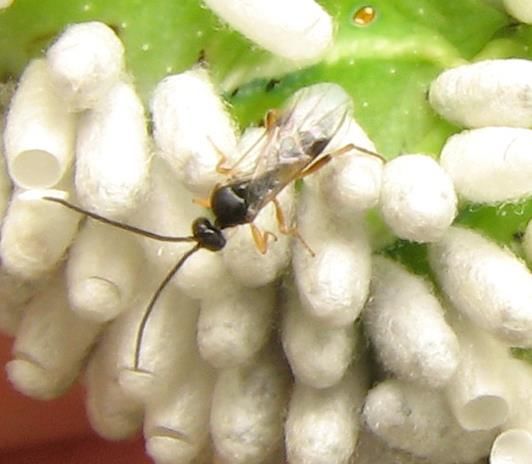
ABBREVIATIONS AND ACRONYMS
  ABBREVIATION/ACRONYM                                 DESCRIPTION
AFASA                    African Farmers Association of South Africa
AGOA                     African Growth and Opportunity Act
AGRISETA                 Agricultural Sector Education and Training Authority
APAP                     Agricultural Policy Action Plan
ARC                      Agriculture Research Council
ATI                      Agricultural Training Institute
ATR                      Annual Training Report
BMI                      Business Monitor International
CoS                      Centres of Specialization
DAFF                     Department of Agriculture, Fisheries and Forestry
DEA                      Department of Environmental Affairs
DHET                     Department of Higher Education and Training
DRDLR                    Department of Rural Development and Land Reform
DTI                      Department of Trade and Industry
FETMIS                   Further Education and Training Management Information System
GDP                      Gross Domestic Product
HEMIS                    Higher Education Management Information System
HSRC                     Human Sciences Research Council
HTFV                     Hard To Fill Vacancies
IGDP                     Integrated Growth Development Plan
IDP                      Integrated Development Plan
IPAP                     Industrial Policy Action Plan
IRR                      Institute of Race relations
KZN                      KwaZulu-Natal
NAFU                     National African Farmers Union
NAMC                     National Agricultural Marketing Council
NDP                      National Development Plan

NERPO      National Emergent Red Meat Producers Organization
NGP        New Growth Path
NEETS      Not in Employment, Education or Training
NPO        Non-Profit Organization
NQF        National Qualifications Framework
NSDS III   National Skills Development Strategy III
NSFAS      National Students Financial Aid Scheme
PCITA      Pest Control Industry Training Academy
PCO        Pest Control Officer/Operator
QLFS       Quarterly Labour Force Survey
QCTO       Quality Council for Trade and Occupations
RPL        Recognition of Prior Learning
SACAU      Southern African Confederation of African Unions
SADC       Southern African Development Community
SAIVCET    South African Institute for Vocational Continuing Education and
           Training
SAPCA      South African Pest Control Association
SAQA       South African Qualifications Authority
SARS       South African Revenue Service
SDA        Skills Development Act
SDL        Skills development levy
SIC        Standard Industrial Classification
SIP        Strategic Infrastructure Project
SSP        Sector Skills Plan
SIZA       Sustainability Initiative of South Africa
STATSSA    Statistics South Africa
TLUSA      Farmers Union
TVET       Technical Vocational Education and Training
WSP        Workplace Skills Plan
WTO        World Trade Organization

                                                                             ii
TABLE OF CONTENTS
ABBREVIATIONS AND ACRONYMS ..................................................................................................................................................... i
TABLE OF CONTENTS ....................................................................................................................................................................... iii
EXECUTIVE SUMMARY ...................................................................................................................................................................... v
CHAPTER 1: SECTOR PROFILE............................................................................................................................................................ 1
    1.       INTRODUCTION .................................................................................................................................................................. 1
    1.1           SCOPE OF COVERAGE .................................................................................................................................................... 1
    1.2           KEY ROLE PLAYERS ......................................................................................................................................................... 4
    1.3           ECONOMIC PERFORMANCE........................................................................................................................................... 7
    1.4           EMPLOYER PROFILE ....................................................................................................................................................... 7
    1.5           LABOUR MARKET PROFILE............................................................................................................................................. 8
    1.6           CONCLUSION ............................................................................................................................................................... 11
CHAPTER 2: KEY SKILLS ISSUES ........................................................................................................................................................ 12
    2.1           INTRODUCTION ........................................................................................................................................................... 12
    2.2           ALIGNMENT OF SKILLS PLANNING TO SUB-SECTORAL STRATEGIES AND PLANS ......................................................... 12
    2.3           CHANGE DRIVERS ........................................................................................................................................................ 14
    2.4           IMPLICATIONS FOR SKILLS PLANNING ......................................................................................................................... 15
    2.5           CONCLUSION ............................................................................................................................................................... 16
CHAPTER 3: OCCUPATIONAL SHORTAGES AND SKILLS GAPS .......................................................................................................... 17
    3.1           INTRODUCTION ........................................................................................................................................................... 17
    3.2           EXTENT AND NATURE OF SKILLS DEMAND .................................................................................................................. 18
    3.2           SCARCE AND TOP-UP SKILLS ........................................................................................................................................ 18
    3.3           EXTENT AND NATURE OF SUPPLY ................................................................................................................................ 19
    3.4           CONCLUSION AND PIVOTAL LIST ................................................................................................................................. 20
CHAPTER 4: PARTNERSHIPS ............................................................................................................................................................ 23
    4.1           EXISITNG PARTNERSHIPS ............................................................................................................................................. 23
    4.2           EXISITNG PARTNERSHIPS ............................................................................................................................................. 23
    4.3           NEW PARTNERSHIPS.................................................................................................................................................... 24
    4.4           CONCLUSION ............................................................................................................................................................... 24
CHAPTER 5: SKILLS PRIORITY ACTIONS ........................................................................................................................................... 26
    5.1           INTRODUCTION ........................................................................................................................................................... 26
    5.2           KEY FINDINGS .............................................................................................................................................................. 26
    5.3           PRIORITY ACTIONS ....................................................................................................................................................... 27
BIBLIOGRAPHY ................................................................................................................................................................................ 29
TABLES:

Table 1: RESEARCH PROCESS AND METHODS ............................................................................................. vi
Table 2: ACTIVITIES WITHIN THE PEST CONTROL SUBSECTOR BY SIC CODE ................................................ 1
Table 3: PEST CONTROL LIST OF DEFINITIONS .............................................................................................. 2
Table 4: KEY AGRICULTURAL ROLE-PLAYERS ................................................................................................ 4
Table 5: KEY PEST CONTROL ROLE-PLAYERS ................................................................................................. 5
Table 6: DISTRIBUTION OF PCOs BY PROVINCE ............................................................................................ 9
Table 7: KEY PEST CONTROL OCCUPATIONS ............................................................................................... 10
Table 8: GENERAL PRIORITY SKILLS FOR THE PEST CONTROL INDUSTRY ................................................... 18
Table 9: PIVOTAL PROGRAMMES ............................................................................................................... 21
Table 10: PROPOSED PRIORITY ACTIONS .................................................................................................... 28

FIGURES:

Figure 1: DISTRIBUTION OF AGRICULTURAL ENTITIES BY SUBSECTOR ......................................................... 3
Figure 2: PROVINCIAL DISTRIBUTION OF PEST CONTROL ENTITIES .............................................................. 8
Figure 3: DEMOGRAPHIC BREAKDOWN OF EMPLOYEES ............................................................................ 10

                                                                                                                                           iv
EXECUTIVE SUMMARY
1. INTRODUCTION AND OVERVIEW
Whist the Pest Control Industry resorts under one SIC code “Pest Control”, there are other operations
that should be classified as pest control but falls outside the scope of Act 36 of 1947 which governs the
industry. For purposes of this sector skills plan, three components of pest control are discussed:
Pest Control: where formal operators perform pest control services mainly in the structured
environment of office buildings, warehouses, factories and private households.
“Working for Water”. This government project aims at eradicating alien plants, and whilst it
includes the application of pesticides, it is not formally part of the organized industry.
Farming sector. Farm workers are applying pesticides to plants and animals. Whilst the Pesticide
Management Policy for South Africa (Government Notice 1120 of 2010) promotes awareness and
proper training of those working with toxic substances, the registration of such operators on farms
are not formalized.
Within the context of its formal definition, the pest control industry is small. The SARS database lists 236
pest control companies, whilst the South African Pest Control Association (SAPCA) has 309 enterprises
registered with it. However, there are more enterprises as there are 4 000 registered Pest Control
Operators (CPOs) and a further estimated 1 150 non-registered operators, many of whom run small
businesses.
The pest control industry is in essence a small business industry. This is evidenced by the fact that only
58 enterprises are paying the levy (implying that the remainder are so small that they are exempt from
paying the levy.
No clear economic data is available on the industry as it is not treated as a separate industry in official
statistics (such as StatsSA). Using conservative figures on business turnover and relative usage of
chemicals the value of the sector can be estimated at R3, 3 billion per annum. (This cannot be relied
upon and at best is indicative).
Direct permanent employment in the sector is estimated at 10 000 employees (for formal recognized
businesses). Unfortunately AgriSETA information cannot be relied upon as only 7 enterprises submit the
WSP/ATR.
Pest control is a male dominated sector with more than 50% of its employees over the age of 35.
It is foreseen that over the next five years there will be an escalation of training activities in the pest
control industry. This can be ascribed to four reasons:
The Pest Control industry is moving in a planned manner towards e-learning. It is seen as a
solution to small operators who cannot always attend or afford formal training courses, but
have access to the internet via laptops and especially smart phones giving them immediate
vaccess at the worksite to advice and learning. E-Learning will be implemented as soon as January
2018.
It is expected that DAFF’s intervention with unregistered operators will result in an increase in
formalized training to prepare such operators to meet requirements for registration.
It is expected that more “Working for Water” projects will be released by government which
again will result in the need for training.
Finally, it is expected that more pressure will be applied to ensure that farm workers who work
with toxic substances are properly trained and certificated to do so. This can become a very
large training need as there are approximately 35 – 40 000 commercial farming enterprises in
South Africa. If only two workers per farm are trained, on average there will be a need to train
as much as 70 000 – 80 000 commercial farm workers. This excludes the myriad of small scale
and non-formal farming enterprises.
2. RESEARCH
A document review was conducted to establish the economic performance and trends of the Pest
Control subsector, geographic concentration and employers. Government policy and strategy
documents, as well as the key statistical and industry publications were reviewed and these are
included in the bibliography. A thematic analysis was conducted to synthesize the key economic,
policy and training issues affecting the Pest Control subsector, and to identify key skills issues.
The following summarizes the research process and methods used to develop this sub-sector skills plan:
Table 1: RESEARCH PROCESS AND METHODS
DATA TIMEFRAME RESEARCH
RESEARCH OBJECTIVES RESEARCH NATURE OF SAMPLE
COLLECTION OF THE OUTPUTS
TOPICS OF THE STUDY METHODS THE STUDY SIZE
TOOLS STUDY
Sector Understanding Desktop Analyze N/A Internet data October – Chapter 1:
Profile the economy, research most recent research December Sector Profile
enterprises Key information Semi- 2017
and labour informant available on structured
within the interviews the sector interviews
sector
Occupational Establish Qualitative Non- 400 Key September – Chapter 2:
shortages & occupational method probability registered & informant November Key Skills
emerging shortages & sampling unregistered interviews 2017 Issues
skills needs emerging skills method was Pest Control (primary) &
needs of the employed to industry desktop data Chapter 4:
Pest Control identify stakeholders analysis Sector
subsector stakeholders (secondary) Partnerships
from whom
specific Chapter 5:
information Skills Priority
was Actions
required
Skills issues Identify key Quantitative Gathering 25% were The September – Chapter 2:
vi& demands occupational method empirical small and quantitative November Key Skills
shortages, evidence emerging survey 2017 Issues
demands & using farmers and gathered
supply with primary data 75% were data on the Chapter 3:
regard to sources, as commercial unskilled, Occupational
unskilled, well as farmers skilled and Shortages
skilled, generic undertaking generic and Skills
Pest Control theoretical, occupational Gaps
subsector desktop shortages &
occupations research skills gaps
and emerging using
skills needs in secondary
the data sources
agricultural
sector
Sector Identify key Desktop Identify N/A Internet data October – Chapter 1:
Partnerships AgriSETA research AgriSETA research November Sector Profile
partnerships Interviews aligned Semi- 2017
partnerships structured
but also interview
intra sub- Previous
sector SSPs
partnerships
3. SCARCE AND PIVOTAL LIST FORMULATION
The scarce skills, skills gaps and pivotal skills lists were arrived at through both secondary data
analysis and the numbers made available in previous Sector Skills Plans. Unfortunately WSPs and
ATRs could not be used as the number submitting are too small and there are incorrect enterprise
allocations. Primary data analysis obtained at the two-day AgriSETA stakeholder conference (30-31
August 2017), interviews and data collection forms the basis of the formulation of the PIVOTAL list.
4. SUMMARY OF KEY FINDINGS
Priority skills in the Pest Control industry are:
Business Acumen.
o It is firstly proposed that the sector work closely with AgriSETA and interrogate the NVC
2 and NVC 4 curricula. If relevant, these qualifications must be tailored to meet the
needs of the Pest Control Industry and become a foundation programme to develop
new entrants covering aspects such as identifying and starting a new business, basic
business plan such as setting targets, resource planning, financial and operational plans.
Consideration should be given to the need to implement the full NVC programme or
only elements thereof as a part qualification.
o Tailored short skills programmes focusing on financial planning, production planning,
etc. These are foreseen as one to three day programmes.
vii Technical Skills. Technical skills programmes are largely in place, however efforts must be made
to engage with those who are operating illegally, those working in the Working for Water
programme and especially the thousands of farm workers who engage on a daily basis with
pesticides, who manage chemical stores and who are involved in the transportation and
application processes. The Act 36 of 1947 is quite clear that all persons applying herbicide,
pesticide or any Agricultural remedy must be registered. This registration can only be obtained
by doing a course and to qualify. Chemicals can have a disastrous effect on the lives of people
and the environment if not managed correctly.
Mentoring. It is necessary to develop a pool of mentors who can assist PCOs in their
development as professional operators and to create sustainable businesses. There is a practical
element that has to be addressed during the training program to finally obtain the qualification.
The PCO needs to do on average 6 months’ work-place practical under a registered PCO.
CPD. Short programmes which focus on disseminating new product information and ensure that
existing operators are trained to correctly use and apply new products. The fundamental intent
of CPD is to implement continuous training programs that will educate and uplift the Pest
Control Operator in all aspects of the line of his work.
The following are critical issues to be address:
1. New developments in the industry and technology.
2. New methods of application of pesticides.
3. Bring PCOs up to speed with new developments, technology and practices in the industry.
4. Obtain the necessary points needed for the re-registration on a 3 year cycle of all registered
Pest Control Officers (PCO’s). They will need to have a minimum 90 points over the 3 year
cycle to retain their registered status.
viiiCHAPTER 1: SECTOR PROFILE
1. INTRODUCTION
Chapter 1 of this report provides an overview of the agricultural sector, paying particular attention to
the Pest Control subsector in South Africa. The first section of this chapter looks at the scope of the Pest
Control subsector’s coverage. Followed by the second section, which outlines AgriSETA stakeholders and
key role-players in the Pest Control sector. The third section looks at the economic performance of the
overall agricultural sector, zooming into the contribution of Pest Control to the South African economy.
The fourth section explores the employer profile, based on the AgriSETA WSP/ATR data submitted for
2017. Finally, the last section provides a labour market profile where the number and demographics of
people employed in the sector is explored. Essentially, chapter one of this document is intended to set
the scene for the skills issues delved into in the subsequent chapters.
1.1 SCOPE OF COVERAGE
The scope of AgriSETA covers the agricultural sector, from input services to the farm, activities on the
farm and first level processing activities from the farm. The Pest Control subsector is classified into a
single economic activity. The table below outlines the formal demarcation of the Pest Control sub-
sector.
Table 2: ACTIVITIES WITHIN THE PEST CONTROL SUBSECTOR BY SIC CODE
SUBSECTOR SIC CODE SIC DESCRIPTION
Pest
99003 Pest Control
Control
Source: AgriSETA, 2017
1Even though all pest control activities are clustered into one SIC code, the table below illustrates that
the subsector is comprised of three 3 major sections;
Pest Control where formal operators perform pest control services mainly in the structured
environment of office buildings, warehouses, factories and private households.
“Working for Water”. This government project aims at eradicating alien plants and whist it
include the application of pesticides, it is not formally part of the organized industry.
Farming sector. Farm workers are applying pesticides to produce and animals. Whilst the
Pesticide Management Policy for South Africa (Government Notice 1120 of 2010) promotes
awareness and proper training of those working with toxic substances, the registration of such
operators on farms are not formalized.
The following table assigns formal definitions to each of the 3 major sections of the pest control industry
in South Africa.
Table 3: PEST CONTROL LIST OF DEFINITIONS
PEST CONTROL DEFINITION
Pest control Servicing the commercial, industrial and domestic sectors of the economy
and is governed by Act 36 of 1947.
“Working for This, a project of the Department of Environmental Affairs (DEA) with two
Water” main aims namely to eradicate invasive alien plants (especially in river beds
and dams) and it also serves as a job creation project for youth. The problem
is that it does not allow for any job creation after the project these projects
have a very short lifespan and is limited to a relatively small geographical
zone.
Farming sector In the farming sector farm workers apply pesticides, fertilizers and
herbicides, very frequently without any restriction whatsoever, no
qualifications and no accreditation. Workers use highly toxic products and
often unskilled labour are used to do this work. This does have an effect on
the food chain and the quality that is put on the table.
Source: Feedback from Pest Control SSC members
Overall, the agricultural sector comprises of 11 sub-sectors, each organized into a Sub-sector committee
tasked to represent their industry’s interest to AgriSETA. These are: Red Meat; Horticulture; Pest
Control; Fibre; Poultry; Milling, Pet food and Animal feed; Seed; Sugar; Tobacco; Grains and Cereals, and
Aquaculture. The Pest Control subsector constitutes 0, 9% of the overall number of levy paying entities
to the AgriSETA. The graph below outlines the relative size of membership number by subsectors, as
captured in the AgriSETA member database of 2016.
2Figure 1: DISTRIBUTION OF AGRICULTURAL ENTITIES BY SUBSECTOR
Red meat (45%)
Horticulture (24%)
Grains and Cereals
(10%)
Fibre (9%)
Aquaculture (5%)
Poultry (2%)
Milling, Petfood,
Animal Feed (2%)
Pest control (1%)
Seed (1%)
Sugar (1%)
Source: AgriSETA member database, 2016
Note: Tobacco is not reflected as it reflects “0%” (although large, the total sector consist only of a very
few enterprises)
1.1.1 Revenue from Skills Development Levies
In 2017, the value of SDL paid by the Pest Control sub-sector was R1 913 937 of which (80%)
R1 531 149 flowed to the AgriSETA. This levy was collected from 58 levy payers of whom only 7
submitted the WSP/ATR – this is understandable as this is largely a SMME sector and relatively
very few small companies submit the WSP/ATR as the effort does not justify the mandatory
grant to be received from the SETA.
In summary, the Pest Control industry represents less than 1% of levy paying enterprises in
AgriSETA and contributes even less than 0, 5% of levy income. This, however, does not mean
that the sector is not important and can be ignored or sidelined. To the contrary, whilst very
small and consisting mainly of SMMEs, it has a very important role to play and its role in the
primary agriculture sector could be dramatically expanded once the notion of having properly
certificated farm workers applying toxic substances is established and enacted.
It is important for AgriSETA to look into the splitting of the Cleaning Sector (currently demarcated to the
Services SETA) as many companies are registered with that SETA. Therefore the contribution to the
AgriSETA is not a true reflection of the industry.
31.2 KEY ROLE PLAYERS
There are a number of public and private key role-players in the agricultural sector which
contribute towards its functioning, including: national government departments, sector
representatives and industry bodies. For the sake of brevity, the table below groups these role-
players according to their strategic contribution to the sector. Please note that while as
comprehensive as possible, this list is not exhaustive.
Table 4: KEY AGRICULTURAL ROLE-PLAYERS
Department or Relevance to agricultural skills
Strategic contribution
organisation development
Quality of education of entrants to labour
Department of Basic market,
Education career awareness programmes to expose
agriculture as a possible career choice
Responsible for TVETs, HETs, agricultural
Skills Development and Department of Higher colleges and skills development. Sets the
Research Education and Training national skills development agenda through
regulation of SETAs.
Provision of updated statistics on agricultural
Statistics SA
sector economics & labour force.
Scientific research on agricultural production
Agricultural Research Council
issues.
Department of Trade and
Industrial strategy, international trade
Industry & Provincial
agreements, agricultural sector strategy and
Departments of Economic
policy implementation desk.
Development
Sector regulatory framework, strategy and
Strategy and
leadership, provision of extension services,
Policy Department of Agriculture
Broad Economic Empowerment funding of
Forestry and Fisheries
development interventions including
provision of bursaries for scarce skills.
Financial planning, incentives, accountability
National Treasury & SARS
of Land Bank, skills levies.
Labour legislation, wage determinations,
Department of Labour
employment equity
Department of Economic
Sector economic strategies
Development
Identification of inter-departmental overlaps
Planning National Planning Commission
and gaps
Policy and guidelines on environment
Department of Environmental
protection and natural resource management,
Affairs
partner in environmental education
Department of Transport Planning for transport needs in rural areas
Rural Development and Department of Rural Partnering with AgriSETA in mobilising funds
4Department or Relevance to agricultural skills
Strategic contribution
organisation development
Land Reform Development and Land for capacity building of claimants.
Reform
Department of Cooperative Linking agricultural and rural development to
Governance and Traditional IDPs and LED, infrastructure and services to
Affairs & Municipalities agricultural enterprises
Department of Water Affairs Water Boards manage local irrigation schemes
Department of Energy Strategy to supply electricity to rural areas
Services Collaboration with agricultural community to
South African Police Service address issues of farm security, including
attacks, stock and property theft
Land and Agricultural
Financial services to commercial farming
Development Bank of South
sector, agribusiness, and emerging farmers.
Africa
Credit and assistance
Micro-Agricultural Financial
Institutions of South Africa Production loans to smallholder operators
(MAFISA)
Agricultural Union serving some 32 000 large
Agri South Africa (AgriSA)
and small commercial farmers.
National African Farmers’ Represents black farmers to level the field in
Union of South Africa (NAFU) all agricultural matters.
The African Farmers’ Represents commercial African farmers to
Union and Sector
Association of South Africa bring black commercial farmers into
representatives (AFASA) mainstream agribusiness.
Transvaal Agricultural Union A national agricultural union serving
South Africa (TAU SA) commercial farmers
Food and Allied Workers Representing unionized farm and food
Union (FAWU) processing workers
Agricultural Business Chamber Fosters a favorable agribusiness environment
Conglomerate organization providing
Agribusiness commodity strategic support and services to
Grain SA
South African grain producers to support
sustainability.
Source: 2015 GCIS Handbook, Agriculture and AgriSETA SSP 2011-2016
Whilst the above is relevant to the agricultural sector at large, certain key role players need special
mentioning when considering the Pest Control sub-sector:
Table 5: KEY PEST CONTROL ROLE-PLAYERS
Department or Relevance to agricultural skills
Strategic contribution
organisation development
Registering Pest Control officers
Department of Agriculture, Identifying non-compliant PCOs and assist in
Compliance and Skills Forestry and Fisheries – Act becoming compliant
Development 36 of 1947 Take a leading role in making farm workers
working with pesticides compliant
Department of Environmental Ensuring that participants in the Working for
5Department or Relevance to agricultural skills
Strategic contribution
organisation development
Affairs Water Project are properly trained, equipped
and compliant.
Engage with farmers, create awareness of the
SAPCA, AgriSA, TLUSA, AFASA, importance of compliance, promotion of
Advocacy
NAFU, Crop Life dedicated skills development interventions
relating to pest control on farms
61.3 ECONOMIC PERFORMANCE
1.3.1 Overview
Overall, agriculture contributes 2, 4% to South Africa’s gross domestic product (GDP) and 4, 4% of total
employment (IRR, 2016). Notwithstanding the relatively small share of the total GDP, primary
agriculture is an important sector in the South African economy; the value of primary agricultural
production in South Africa was R263, 2 billion in 2016, while its contribution to the GDP was estimated
at R72. 2 billion in 2015 (DAFF, 2016). In addition, the sector plays an important role in job creation,
especially in the more rural parts of the country.
The Pest Control Sub-sector, although being very important, is in economic terms a very small element
of the agricultural contribution to GDP and minute in the context of the National GDP.
1.3.2 Economic Outlook of the Sub-sector
No organized, official data is available on the size of the pest control industry – it is not treated as a
separate, identifiable sub-sector within the economy. However using the available information it is
possible to create some indication of the industry in economic terms.
If it is assumed that 4 000 of the estimated 4 600 PCOs are active and generate a turnover of only
R60 000 per month, the monthly turnover of the industry can be estimated at R240 million or
approximately R2, 8 billion per annum.
Should one estimate that the cost of chemicals is about 15% of turnover, it means that the value of
chemicals consumption is in the region of R36 million per month or R432 million per annum.
These figures combined means that the value of the sector is approximately R3, 3 billion per annum.
Not much reliance should be placed on the above figures as:
They represent very crude calculations.
They exclude very large components of the industry (such as pest control on farms, commercial
and under resourced, and any special projects such as Working for Water.
It does, however, indicate that the pest control industry is miniscule in the context of the South African
economy.
1.4 EMPLOYER PROFILE
Different to other sub-sectors, it is not possible to draw reliable information from the WSP/ATRs
received by AgriSETA from the industry. According to SAPCA there are a total of 309 enterprises
registered with them, the SARS database identifies 236 enterprises and the AgriSETA has knowledge of
58 levy payers. Of the levy payers, only 7 submit WSP/ATRs. It is also estimated that SAPCA represents
only one-third of official employers. It can therefore be assumed that there are most likely more than
1 000 formal enterprises and many more non-registered or informal operators.
7For planning purposes, it is clear that the above sample (3%) of whom detailed information is available
(via WSP/ATRs) is too small to draw reliable deductions from. Due to the small nature of the industry
good information is also not available from sources such as StatsSA or Quantec.
Using the membership of SAPCA as a proxy for provincial distribution of enterprises, it is clear that 75%
of enterprises are located in three provinces namely Gauteng (35%), KwaZulu-Natal (21%) and Western
Cape (19%).
Figure 2: PROVINCIAL DISTRIBUTION OF PEST CONTROL ENTITIES
WC
21% 19% NW
NC
4% MP
2% Lim
4%
EC
5%
FS
35% 5% Gau
5%
KZN
Source: SAPCA membership register, 2017
The above does not include the Working for Water operators nor those applying pesticides on farms.
1.5 LABOUR MARKET PROFILE
Given that the Pest Control economy is represented by approximately 300 enterprises, it is estimated
that they are employing an estimated 4 600 registered PCOs (Pest Control Officers). It is also estimated
that a further 20% or 1 150 PCOs are not registered and operate as one-man businesses which can be
regarded as illegal. The DAFF is actively trying to “catch up” with these operators and either close them
down or assist them to become legally registered.
It should be noted that due to the very low rate of submission of WSP/ATRs, information on the labour
market profile is tentative and vague in nature.
In general the sector employs males in the age category 25 – 40 years and education levels are low – the
average education of a Pest Control Officer is Grade 10 and for other workers it is generally less than
Grade 6.
The average pest control technician salary in 2017 is R113 605 per annum (payscale.com) and it ranges
between R55 000 to R151 000 per annum.
81.5.1 Provincial Distribution of Employees
SAPCA’s provincial membership distribution is illustrated in Figure 2 above. According to SAPCA there
are 4 600 PCOs formally registered in the industry whilst the AgriSETA information reflects 747
employees. (AgriSETA information is limited to those submitting the WSP/ATR – only 7 enterprises.)
Furthermore it should be realized that the industry employs more workers than just PCOs. However,
PCOs are at the core of the business of Pest Control Companies. The SAPCA membership was again used
as a proxy to allocate PCOs provincially.
Table 6: DISTRIBUTION OF PCOs BY PROVINCE
NOT- ESTIMATED
PROVINCE % REGISTERED
REGISTERED TOTAL
Western Cape 19% 874 218 1 092
Eastern Cape 5% 230 58 288
Northern Cape 2% 92 23 115
Free State 5% 230 58 288
KwaZulu-Natal 21% 966 241 1 207
North West 4% 184 46 230
Gauteng 35% 1 610 402 2 012
Mpumalanga 4% 184 46 230
Limpopo 5% 230 58 288
TOTAL 100% 4 600 1 150 5 750
Source: SAPCA membership used as a basis to construct this table
Naturally, using the same proxy (SAPCA membership) the distribution of employees is the same as for
enterprises, meaning 75% are employed in the three provinces of Gauteng, KZN and Western Cape.
It is also noted that one can assume that generally each PCO work with a laborer.
91.5.2 Gender, Race and Age
The following section is based on the 7 WSP/ATRs received. It cannot be relied upon, but at least it
provides some insight into labour in the sector.
Figure 3: DEMOGRAPHIC BREAKDOWN OF EMPLOYEES
90.00%
80.00%
70.00%
60.00%
50.00%
40.00% Large & Medium
30.00% Small
20.00%
10.00%
0.00%
AgriSETA WSPs, 2017
It is noted that the pest control sector:
Is male-dominated.
Is employing mainly blacks (62% African and 20% coloureds).
Slightly more (51% of employees) are in the middle age group of 35 – 35 and 44% are young
people (below the age of 35).
1.5.3 Occupational categories
No official information on key occupational categories are available. However, the industry lists the
following five occupations (in order of priority):
Table 7: KEY PEST CONTROL OCCUPATIONS
PRIORITY OCCPATION CODE OCCUPATION
1 2017-684401 Pest Control Operator/Officer
2 2017-335904 Pest Management Officer
3 2017-821401 General worker/garden worker/trainee PCO
4 2017-243301 Sales representative (industrial products)
5 2017-134903 Small business manager
101.6 CONCLUSION
Pest control is the smallest sub-sector demarcated to AgriSETA. There are in the region of 300 formally
registered pest control enterprises employing approximately 4 600 PCOs, which is the key occupation in
the sector. There are a further (estimated) 1 150 unregistered PCOs. However, whilst small it is a
critically important industry and whilst the vast majority of persons working with pesticides are not (and
do not have to be) registered, farm workers, it is a matter that needs attention.
11CHAPTER 2: KEY SKILLS ISSUES
2.1 INTRODUCTION
This chapter focuses on the alignment of skills planning to national strategies insofar as it has relevance
to Pest Control and it will also focus on factors driving change in the sector, thus influencing particular
skills needs.
2.2 ALIGNMENT OF SKILLS PLANNING TO SUB-SECTORAL STRATEGIES AND PLANS
The following section draws attention to the national strategy and planning documents that frame
AgriSETA’s mandate for skills development. All of these legislative and policy frameworks speak to
12AgriSETA’s Constitutional mandate, as a Public Institution governed by the Public Finance Management
Act, to develop and facilitate the implementation of learning interventions in accordance with the Skills
Development Act, (1998), the Skills Development Levies Act (1999), and the National Qualifications
Framework Act (2008).
There are two seminal strategic documents that underpin AgriSETA’s mandate for skills planning,
namely: the White Paper on Post School Education & Training (2013) and the National Skills
Development Strategy III (NSDS III) (2011 – 2016). Both of these documents highlight the SETAs roles in
developing clear, sector specific linkages between education and the workplace through an analysis of
the demand and supply of skills in their sector. These documents call for credible institutional
mechanisms for skills planning, programmes that are occupationally oriented, and responsive higher and
further education and training institutions. Furthermore, attention should be given to the needs of local,
community enterprises, co-operatives and the like, with a focus on developing their skills capacities to
meet the needs of their particular environments, thereby closing the gap between the rural and urban
South African economies.
Within the pest control industry there is a requirement for those applying pesticides to be registered.
This requirement exists to, firstly, protect the individual him/herself as they are working with highly
toxic substances but secondly to ensure that pesticides are applied correctly so that it has a minimal
effect on other living organisms, animals and humans other than that targeted by the application.
Registration is a legal requirement in terms of Act 36 of 1947. Registrations are categorized under the
following main categories:
Weed control.
Fumigation.
Structural pest control.
Plant pests.
Aerial application.
Wood preservation.
Termite control.
All of these seven categories are equally important for skills development purposes.
From an alignment perspective it is foreseen that over the next five years there will be an escalation of
training activities in the Pest Control industry for four reasons (across all 7 categories listed above);
The Pest Control industry is moving in a planned manner towards e-learning. It is seen as a
solution to small operators who cannot always attend or afford formal training courses, but
have access to the internet via laptops and especially smart phones giving them immediate
access at the worksite to advice and learning. E-Learning will be implemented as soon as January
2018.
It is expected that DAFF’s intervention with unregistered operators will result in an increase in
formalized training to prepare such operators to meet requirements for registration.
It is expected that more “Working for Water” projects will be released by government which
again will result in the need for training.
13 Finally, it is expected that more pressure will be applied to ensure that farm workers who work
with toxic substances are properly trained and certificated to do so. This can become a very
large training need as there are approximately 35 – 40 000 commercial farming enterprises in
South Africa. If only two workers per farm is trained, on average there will be a need to train as
much as 70 000 – 80 000 commercial farm workers. This excludes the myriad of small scale and
non-formal farming enterprises.
Top on the priority list of skills needs in the sector is to enable – especially new and small operators – to
run successful and sustainable businesses. Many of these small businesses start up but fail within a
relatively short period of time. The focus should be on:
Business start-ups,
Planning, and
Financial management.
The second focus area is that of technical skills. Operators are working with highly toxic material and
need to understand not only how to use it, but also the impact it has on humans, animals and the
environment. Coupled with this is the fact that pesticides are evolving constantly and new products
enter the market. With the growth of the concept of “the Green Economy” there is pressure on the
industry to migrate more and more towards environmentally friendly products which will not be harmful
at primary level (where and when applied) but also at a secondary level (those that are affected whilst
not the original aim, e.g. birds coming in contact with pesticides). Thus, whist this is not a highly complex
sector, there is a high requirement to upgrade skills on a continuous basis and the need for practical
training. Well planned, industry wide CPD programmes are essential.
Thirdly, it is important to note that PCOs must renew their P-certificates every three years – in many
cases this renewal will be preceded by a refresher course. This forms part of CPD of PCOs.
2.3 CHANGE DRIVERS
In this section key themes and issues driving change and influencing skills demand and supply in the pest
control sector are addressed. These change drivers were identified through a thematic synthesis of
internal stakeholders’ views, policy documents, existing research and stakeholder engagement. It was
ensured that sufficient engagement, via focus groups, were placed on the needs of the under-resourced
sector.
2.2.1 Land and Agrarian Reform
As land reform progresses so does the need to develop new entrants into the primary agricultural
production arena. However, a relatively small SETA such as the AgriSETA has, by no means, sufficient
funding to address the needs of the under-resourced sector. Each and every focus group (irrespective of
them farming with animals or plants or both) raised the matter of pest control knowledge and
management as one of their priority skills needs.
142.2.2 Agricultural Structures
It was reported by BMI that 80% of farmers in sub-Saharan Africa are smallholders. It is argued that, in
the long term, African farming will have to move away from subsistence agriculture to be competitive
and profitable in the genetically modified farming sector (BMI, 2016). For this reason, “partnerships with
food companies, the development of co-operatives and greater access to credit” are needed to develop
the sector more generally (BMI, 2016).
However, one of the major drivers of change is the formation of new agricultural farming structures.
These range from CPAs, to trusts, private companies and co-operatives. All these structures have one
common denominator: farming collectively. If not well managed it creates tension and conflict. Thus,
whilst this SSSP focus on the Pest Control sector, initiatives cannot be implemented without addressing
governance matters first.
2.2.3 Commercial Agriculture
Good Agricultural Practices (GAP), Hazard Analysis Critical Control Points (HACCP) and many other
protocols as enforced by large food retailers (locally such as Pick ‘n Pay and Woolworths and
internationally such as Waitrose and Marks & Spencer’s) require from farmers to be compliant and
responsible across many areas of operation – this includes working with, storing and applying toxic
substances.
Thus from a pest control perspective, commercial agriculture will have to progress from the current non-
registered and minimally trained farm workers to properly trained and certificated PCOs.
2.2.4 The Green Economy
There is an increasing emphasis on the “green economy” in government policy documents (see, NDP,
NGP). In the agricultural sector, this refers to the use of environmentally sustainable farming practices.
These sustainable practices require new knowledge and skills that cut across farming enterprises of all
sizes. The need for green knowledge is conveyed through industry specific training interventions across
different subsectors. Whilst there is a tendency to limit discussion on the Green economy to renewable
and efficient energy, the Green economy has also embraced the progression to environmentally friendly
pesticides which are less harmful to man and its environment.
2.4 IMPLICATIONS FOR SKILLS PLANNING
In this chapter we have seen that the legislative and policy frameworks established by government,
coupled with the contextual change drivers and industry specific perspectives on skills development
point to the following 5 skills implications that need to be addressed in the Pest Control Sub-Sector Skills
Plan.
5 Skills Implications:
1. Develop a pool of experienced pest control practitioners to assist new entrants into the industry
(including those that were traced and legalized by DAFF) in establishing sustainable small
businesses.
152. Focus on entrepreneurship and enterprise development programmes in conjunction with
mentoring services.
3. Expand pest control officer training to Working for Water Project participants and farm workers.
4. Focus specifically on the training of under resourced farmers in the application and
management of pest and disease control.
5. Develop specific CPD programmes to ensure that the industry (and specifically PCOs) are moving
with developments in the industry and become more sensitive towards the Green economy.
CPD is embedded in the requirement that each PCO must renew his/her registration every three
years.
2.5 CONCLUSION
The fact that such large elements of pest control are unregulated is a matter of concern. It is necessary
that other initiatives such as “Working for Water” (where large numbers of young people work with
pesticides) and the plethora of farm workers in South Africa (commercial and under-resourced) be
exposed in a structured and regulated manner to pest control. It may not be necessary that each and
every person working with pesticides are formally qualified as PCOs, but elements thereof must become
non-negotiable.
It is necessary that the industry develops mechanisms to ensure continuous CPD and engage mentors to
assist new entrants to the industry. Much has already been done of which the new e-learning platform
is innovative and will make access to training so much easier.
16CHAPTER 3: OCCUPATIONAL SHORTAGES AND SKILLS GAPS
3.1 INTRODUCTION
Chapter 3 reflects skills demand and supply in the Pest Control Industry. Contrary to other Sub Sectors,
using WSP and ATR information was not possible as very few (7) have been submitted – this is too small
to draw any reliable conclusions from it. Furthermore, the Pest Control industry is not recognized as an
economic sector within formal statistics – it is seen as an integral part of other economic sectors,
therefore no reliable quantitative information on skills demand and supply is available. Therefore much
of the information reflected in this chapter is qualitative and indicative in nature.
The key themes emerging from this chapter corroborate the skills implications identified at the end of
Chapter 2.
The pest control industry is relatively easy to enter and unfortunately there are quite a number of
unregistered operators whose actions and practices are not governed. DAFF is in a process to enforce
compliance.
173.2 EXTENT AND NATURE OF SKILLS DEMAND
In general it is not difficult to fill vacancies in the Pest control industry. However, whilst a vacancy can
be filled, the quality and skills levels are frequently questionable. This is especially true for PCOs. In
order to fill the gap between a qualified and a highly competent PCO, the need exists for a period of
professional mentorship – professional mentors are scarce and as a result the practical training and
mentoring become costly. There is a need to invest in a pool of professional mentors in the sector,
spread across the country.
Table 8: GENERAL PRIORITY SKILLS FOR THE PEST CONTROL INDUSTRY
Constituency General priority skills for the Pest Control Sub-sector
Training PCOs to comply with registration requirements
Existing Formal Pest
Control Businesses CPD short courses focussing on new technologies and environmentally
friendly products.
Business acumen
New Formal Pest Control
Mentorship
Businesses
Technical PCO skills
Working for Water Safe handling of toxic substances
Project Apply effective weed control
Safe handling of toxic substances
Farm Workers Application of pesticides in different contexts
Chemical store keeping – good practices
3.2 SCARCE AND TOP-UP SKILLS
As mentioned earlier, it is generally not difficult to fill vacant posts, however the quality thereof is
frequently questionable. It therefore implies that there is a need for to-up skills – those skills which will
enable the incumbent to perform better and be more productive.
Pest Control Officers
Pest control officers are at the core of the Pest Control Sub-sector. Once recruited they are trained as
PCOs and registered with DAFF. This implies that effectively one cannot apply pesticides without being
registered and in turn this implies one has to be trained to meet the legal requirements of a PCO.
The training is not limited to compliance only. The pest control industry evolves and there are
continually new products on the market. This happens mainly for two reasons. Pests become immune
to existing pesticides and secondly, as elsewhere in the economy, the sector is becoming more and more
sensitive towards the Green economy.
This training need is relevant to all 4 600 formally registered PCOs and over time will also include the
1 150 non-registered operators.
CPD is important. The pest control industry has developed a points system whereby every PCO must
accumulate 90 points over a three year period prior to applying for renewal of his/her registration.
These points must be accumulated at a rate of maximum 30 per annum. Various important courses as
18identified by the industry in conjunction with the Registrar (at DAFF) and will carry different weights
(points). As such a PCO will have to engage with a number of learning opportunities annually to
accumulate the required 30 points and (over 3 years) 90 points. This therefore becomes a regulated top-
up skills.
New Business Owners/Managers
Many new pest control businesses are not sustainable – the main reason being the inability to manage a
business. There is a lack of business acumen with newly registered enterprises. It is therefore important
to train new business operators in related skills such as planning and scheduling, financial management
and control and the management of labour/personnel.
As a minimum those that are currently operating without the necessary registration and being tracked
by DAFF and are the priority group to be focused on and could roughly be estimated at 1 150 people in
need of business acumen related training.
Workers
The final category are those who work with pesticides but are not “covered” by legal requirements, i.e.
those that are currently exempted. Although exempted, farm workers and those participating in the
Working for Water project handle the same toxic substances and are exposed to the same dangers (and
are exposing others) as those who have to be formally recognized by being registered as PCOs.
The need is to engage Working for Water participants and farm workers with short skills programmes to
train them in the use and management of pesticides and chemical stores.
3.3 EXTENT AND NATURE OF SUPPLY
Young people are trained at Universities, Universities of Technology and more specifically at Agricultural
Colleges and through privately accredited training providers at AgriSETA in matters relating to pest
control.
At the higher levels (Universities, Universities of Technology and TVET Colleges) pest control training
forms part of other, broader qualifications. In the case of private providers accredited with AgriSETA
most will present the Unit Standard on Pest Control which is aimed at farm workers – this is very
valuable for reasons discussed above (where it is stated that farm workers need to be exposed to
appropriate training).
However the vast majority of training aimed at Pest Control beyond the agricultural sector is driven by
the employer’s body SAPCA and the work done by the training provider PCITA, which is also accredited
by AgriSETA. The key courses provided are:
Practical field training
DAFF P-registration, Act 37 of 1947
Structural pest control
Food safety (HACCP)
19 Application of Termiticides
Technician/Client service
Fumigation
Weed control
Termites
Full WDO and Termite Management Course (NQF4)
A second established training provider in the industry is the Pest Management Academy providing
services to the industry and focus on:
e-Learning
Various skills programmes such as bag, bulk and structural fumigation, weed control, structural
pest management, termites
FET Certificate in Pest Control Operations – NQF4 and NQF5
Aerial application course – NQF4
Field pest biologist – NQF5
A third notable provider is the Grain Training Institute (GTI) focusing on combating contamination in
grain and deliver training in this regard to silos and grain mills.
Finally, AgriSETA has in access of 800 accredited training providers. Many of them are accredited to
deliver on Unit Standards in the pest control environment.
3.4 CONCLUSION AND PIVOTAL LIST
Section 3.2 above lists the occupations with a need for to-up skills. The following table summarizes the
occupations and the PIVOTAL programmes. Due to the nature of the industry most of the PIVOTAL
programmes are skills programmes and short courses. However all these programmes are unit standard
based and can be defined as “part qualifications”.
As there is no reliable statistical information available from the WSP/ATRs, the sector representatives
were asked to estimate number of PIVOTAL programmes and participants to be supported by the
AgriSETA. The figures reflected in this table summarizes the need for training – it is understood that it
exceeds the capacity of the AgriSETA to support – especially in the light of the small contribution of the
Pest Control sub-sector to the levy income of the SETA.
Pest control operators/officers is the key occupation in the industry – without this occupation the
industry cannot exist and if legally operated, PCOs must renew their registration to operate every three
years. There are approximately 4 600 registered PCOs in the country. Each year one-third should be
supported in their CPD endeavors or to be registered for the first time.
Pest management officer is a post that will appear in medium to large enterprises where a number of
PCOs are managed by a manager. Whilst official figures are not available it is estimated that there are
approximately 60 medium to large firms in South Africa (this include those whom are incorrectly
registered with the Services SETA). For purposes of this planning exercise it is assumed that across the
20You can also read