Production flow improvement and value stream mapping in a lean manufacturing world
←
→
Page content transcription
If your browser does not render page correctly, please read the page content below

Production flow improvement and value stream mapping in a lean manufacturing
world
Muhammad Adib Uz Zaman * and Emad Rabiei Hosseinabad
Department of Industrial and Systems Engineering, Northern Illinois University
Global Journal of Engineering and Technology Advances, 2021, 06(01), 036–050
Publication history: Received on 22 December 2020; revised on 01 January 2021; accepted on 03 January 2021
Article DOI: https://doi.org/10.30574/gjeta.2021.6.1.0125
Abstract
The importance of lean manufacturing concepts has been discussed many times over the few decades. The most
important elements in lean manufacturing practices are value stream mapping (VSM), Kaizen events, load leveling
(heijunka), etc. In this case study, a real-world clock assembly simulation has been used to study the performance
improvement in terms of production flow and lead time after introducing lean concepts. In each round of simulation,
the lean concepts have been introduced one by one and performance metrics were recorded. After implementing the
concepts, the productivity was improved enormously. So, this simulation study emphasizes the importance of
continuous improvement of production flow through lean concepts in a real production setting.
Keywords: Lean Manufacturing; Value Stream Mapping; Load Leveling; Simulation; System performance improvement
1. Introduction
Lean is defined as “a philosophy of manufacturing that focuses on delivering the highest-quality product at the lowest
cost and on time” [1]. The purpose of lean manufacturing is to produce great quality products for customers enabling a
more prosperous society. It is important to build a company production system based on this philosophy. An operation
not only includes the interaction of operator, materials and machine, but also their interaction with information. When
studying the process, it is also essential to consider the role of information in the internal value stream. Information
comes, ultimately, from the customers; their requirements are translated into product specifications, production
schedules, pull signals, and delivery directions. Understanding the internal value stream is therefore critical both to
serving the needs of the customer, and to improving the efficiency (and profitability) of the value stream.
Value stream mapping (VSM), a means of representing the value stream with symbols and numbers, is the key to
understanding the entirety of the transformation of raw materials into finished goods [2]. Non-value added (NVA)
components tend to creep into a process over time, and by understanding the process and the specification of current
value stream, a project team is better able to design a solution that optimizes functionality of value stream mapping by
eliminating waste and rearranging the value stream into the desirable value stream which is expected to be reached in
the future. Additionally, a VSM:
Identifies opportunities for process improvement.
Identifies pinch points and helps level the workflow to optimize use of resources.
Encourages continuous improvement philosophy.
Enables cultural change by allowing people to identify and improve the process.
Provides a great mentoring tool.
Corresponding author: Muhammad Adib Uz Zaman
Department of Industrial and Systems Engineering, Northern Illinois University.
Copyright © 2021 Author(s) retain the copyright of this article. This article is published under the terms of the Creative Commons Attribution Liscense 4.0.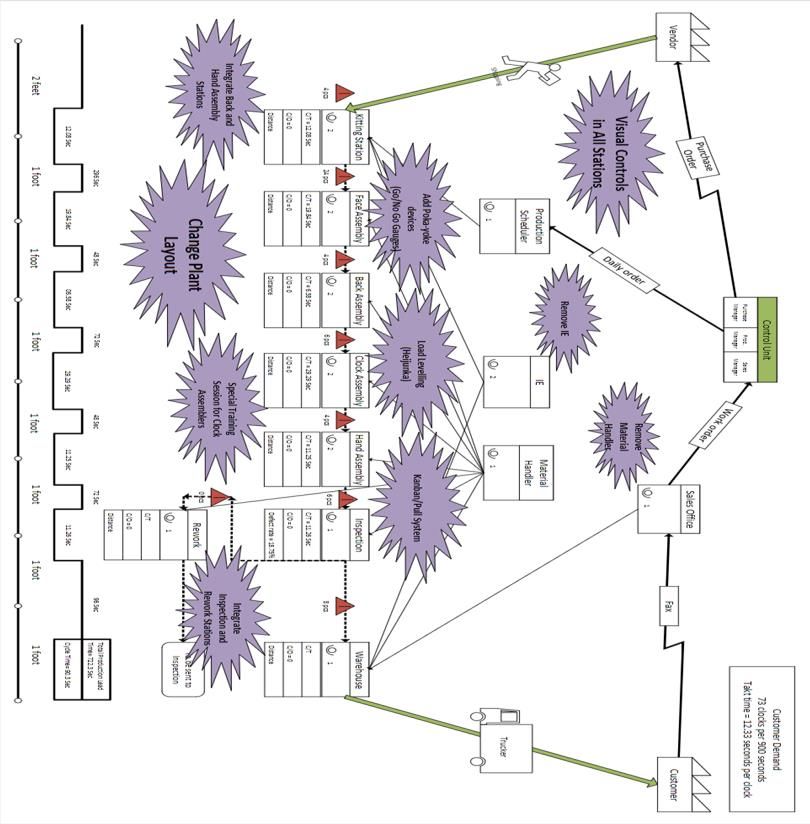
Global Journal of Engineering and Technology Advances, 2021, 06(01), 036–050
Helps drive toward a goal.
A value stream, as the name implies, flows to some specific end. This end is a set of requirements, as expressed by the
customers of the value stream. When the value stream fails to meet the requirements, it is intended to serve, it must be
improved. Customers have three simple requirements – price, quality and delivery. In today’s market, competitive price
and quality are basic requirements for staying in business. Furthermore, lean proposes that “better beats best”, again
warning us that we should not be obsessed with perfection but get on with many small improvements. With the ability
to test proposals quickly, we ensure that we move on to action, but we also ensure that everyone is on board. In many
studies, VSM has been reported to be effective in cycle-time reduction [3-5]. Recently, systems dynamics applications
have been introduced to lean thinking implementation which facilitate real life improvements in the system
performance in manufacturing environment and energy systems [6, 7]. Not only traditional manufacturing but other
advanced manufacturing areas [8] can benefit from lean concepts.
As the first important step in a VSM, it is important to accurately assess and gain consensus regarding the current state
of the process. This requires input from all who participate or use the system/process as well as accessing the completed
current value stream. Systems often are loaded with non-value-added steps; therefore, it is valuable to assess the
current state of the process. The creation of the VSM should begin with the end in mind, be customer-focused, and be
completed by someone who is close to the work.
The process for current state VSM has usually six steps:
Select the product family that will be mapped
Decide what the goal for improvement will be
Form a team to collect data and map the selected value stream
Walk the flow and collect data on the value stream
Judge the value stream from the customer’s point of view and adjust scheduling likewise
Draw a map of the value stream
When the analyses of the current state map are done, there will be many improvement ideas that can be implemented.
Before doing so, it is useful to illustrate what the processes are like after detecting the changes needed to be done in
terms of current state mapping. Mostly, this will help to avoid the same mistake multiple times and generate even more
efficient ideas about how the arrangement of value stream should be in the future comparing to the current one. When
creating the future state map, there are some useful principles and methods that can be applied beforehand to have
more accurate future state mapping. These methods come from the corrected current state map.
In the lean simulation round 2, it was understood that the current layout and the communication between workstations
and operators were not arranged in the most efficient way and must be changed. For example, since it was decided to
provide everything needed readily available in stations (parts, gauges, instructions, tooling), there was no need for the
kitting station and the material handler to remain in the value stream. This helped to reduce wasteful travel, motion and
WIP inventory and as a result, shortening the manufacturing lead time. Moreover, by calculating the cycle time in each
station, it was found that clock assembly was the pacemaker of the process and the most defective parts identified in
rework and inspection stations were initiated in clock stations. Therefore, rebalancing the process and leveling of the
production in the clock assembly station was an essential Kaizen event and it is going to be discussed thoroughly in
section 4. Also, from the current state map it was understood that in inspection and rework stations, the rearrangement
was also necessary to make these stations more efficient in detecting the defective parts and mistake proofing the
process. By doing so, it was found that both production lead time and cycle time had been changed. This point also needs
to be considered that detecting the hidden work in process throughout the lab helped to have more accurate calculation
in terms of cycle time, defect rate, and production lead time.
Furthermore, by looking at communication and information flow, it was readily understood that the type of
communication between customer and control point, supplier and control point and IEs with the stations also need to
be changed in a way indicating their true purpose in value added activities. In lean simulation round 3, further
implementation of Kaizen events was tried like changing the layout, removing the redundant station, combining the
workstations, and providing more efficient communication between the operators. This helped massively to come up
with the future state map.
37
Global Journal of Engineering and Technology Advances, 2021, 06(01), 036–050
2. Brief description of the simulation process
A brief description of the production line setting used in the simulation will give more information about the lean and
value stream mapping. Time Wise, Inc. is a “traditional” manufacturing company that manufactures specialty clocks.
They manufacture two types of clocks - black diamond and blue sapphire. There was a total of four simulation rounds.
In each round, lean manufacturing concepts were introduced and then applied in a realistic simulation.
Round 1 in the present production line is ‘Business as usual’ that means it does not consist of any lean philosophies like
5S, Kaizen, etc. In round 1 the production facility consists of the following components:
1. Sales office
2. Production Scheduler
3. Vendor
4. Rework area
5. Clock assembly
6. Back assembly
7. Kitting area
8. Tool crib
9. Inspection area
10. Hand assembly
11. Back assembly
12. Work in process
13. Sipping dock/warehouse
Six main steps followed, to manufacture and test the clocks in round 1, are described below:
Step 1: At face assembly station, quadrant markers were attached to clock face with the given pattern.
Step 2: At back assembly station, an ornamental plate was attached to the yellow clock frame.
Step 3: At clock assembly station, a motor, face, and frame were attached.
Step 4: At hand assembly station, clock hands were attached to the motor shaft.
Step 5: At inspection station, the clocks were checked for defects.
Step 6: At rework station, the identified clock defects (if any) were corrected.
There was a sales representative who processed the customer orders. The production scheduler generated the factory
orders from forecast. There were two persons in the kitting area of the production facility who organized raw materials
for the factory orders. One material handler moved products between all workstations. A face assembler fixed the
quadrants to the faces with respect to the color of the face. Back assembler attached ornamental plate to back. Clock
assembler assembled the clock i.e., he fixed the moment, retaining nut and washer. Hand assembler fixed the minutes
and hour hands to the clock. Inspector was a part of quality check. He checked all the defects (if any) and then sent it to
the rework station if he found the clock had a defect. If not, he sent the clocks to the warehouse. Rework station repaired
failed clocks. They received the defected part and rectified the defect in the part and sent it to the inspection station
again. The warehouse clerk had the customer orders from the sales representative. Warehouse clerk matched clocks to
customer orders. Tool crib attendant mostly controlled different tools. The production line had two industrial engineers
(IE’s) who monitored the production process and worked on time studies to know the cycle time of the batch
production. A trucker shipped products to the customer.
The company had some policies. The head of the Company had set some polices and he decided that all shifts were 15
minutes. The production line followed first-in, first-out (FIFO) which meant the first customer order was served first,
according to the company’s rules. The materials were to be handled only by the material handler. Everyone else had to
stay only at their workstation and was not allowed to move.
In round 2, lean foundations were introduced and so it consisted of lean philosophies like 5S, standardized work, visual
Management, and plant layout. In this round, the layout of the production line was changed by moving the kitting station
and placing it after production schedule station. Then the face assembly and the back assembly were placed after the
kitting station. The vendor station was aligned after the back station. The rework and clock assembly were placed in the
production line in between the hand assembly and back assembly as show in Figure 1. The inspection center was placed
after the hand assembly.
38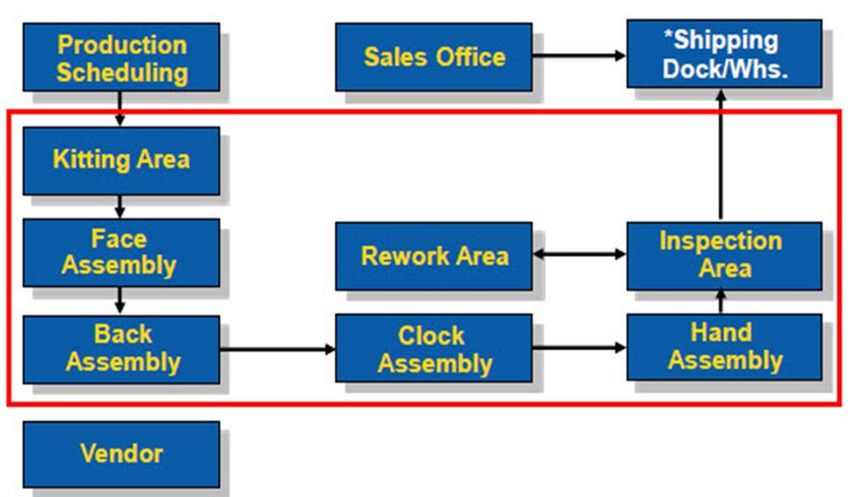
Global Journal of Engineering and Technology Advances, 2021, 06(01), 036–050

                              Figure 1 Layout of clock assembly line simulation round 2

The production started from the kitting area and then they went to the face assembly then to the back assembly. After
the clock assembly, the clocks were sent to the hand assembly. The completed clocks went to the warehouse. Defected
clocks went to the rework and once the rework is done, they were sent to the inspection and once inspection test was
passed, they were sent to warehouse. The work visuals management came into picture in round 2 where the names of
the stations on the table were placed for easy identification of the station for the material handler. This approach
reduced the material handling time. Standardization of work, combination of tables or eliminating tables like tool crib
helped to make the production line more effective in round 2 and made operations more reliable.

In round 1 and 2, the focus was more on waste elimination in each workstation. However, the simulation round 3 was
mostly involved with proposing continuous improvement methodologies. In the process of investigating in the
continuous improvement methodologies and kaizen event in lab simulation 3, it is crucial to answer the three following
HOW questions.

            •        How to meet customer demand?
            •        How to create continuous flow and a pull system for the lab factory?
            •        How to achieve load leveling (heijunka)?

This point needs to be mentioned that the ability to correctly addressing these questions will assist further in building
future state map in terms of the simulation. In the next sections, these questions have been discussed in detail.

2.1. How to meet customer demand
Meeting the customer demand in the set available time is the major goal of each manufacturing setting. The customer
requires the demand to be met without having an accumulation of units in finished goods warehouse. The best way to
reach that point is to implement methodologies that lead to cycle time reduction because when the cycle time is reduced,
meeting the customer demand becomes more accessible. This goal can be achieved in multiple ways. Based on the
improvement implemented in the lean simulation round 3, several lean methods were performed to meet customer
demands. The quick changeover of equipment, as a lean method, can be performed to reduce the setup time as a non-
value-added processing. The more the changeover tasks are performed externally, the greater the chance is to reduce
setup time. This can result in cycle time reduction and subsequently, increasing the throughput and getting close to
meeting the true costumer demand. It is worthy to indicate that this setting was assumed to be performed in the
simulation to increase the customer demand responsiveness.

Furthermore, since the simulation was performed batch-wise, the reduction of batch size was implemented to
investigate its effectiveness in meeting customer requirement. Therefore, the batch of blue clocks was reduced from 4
clocks to 2 clocks and the batch of 6 clocks was diminished to 3 clocks. This helped the production scheduler to sequence
the schedule properly and reduced excessive work-in-process inventories throughout the workspace. Subsequently, it

                                                                                                                      39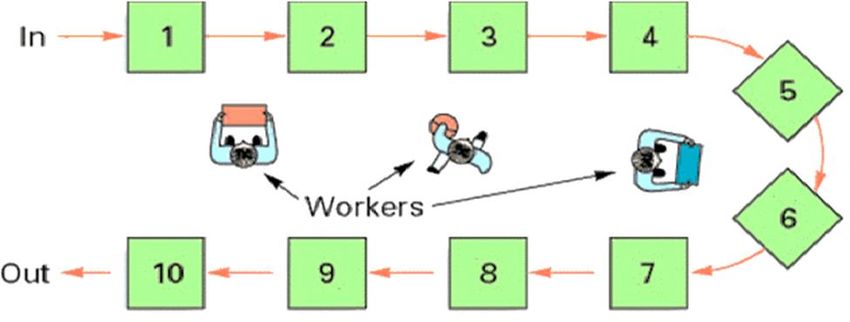
Global Journal of Engineering and Technology Advances, 2021, 06(01), 036–050

was observed that the number of units shipped on time was increased. However, it still was a bit far from the customer
demand.

In the simulation round 4, the team tried to make it even closer to the customer demand by implementing continuous
flow throughout the assembly setting. Further explanation of implementation of this method is going to be presented in
subsequent paragraphs. However, it is to be noted that the simulation round 4 was the last round after all the suggested
lean concepts were introduced.

Constantly improving the layout throughout the simulation led to better flow of work and material in the work area. By
removing the material handler and changing the layout into the U-shaped in the simulation as part of the improvement
of layout, it was observed that, as the movement of operators along with the work area was reduced, the work-in-
process (WIP) inventory was reduced, respectively. According to the Little's law as the WIP inventory reduces, the lead
time will be reduced accordingly. Therefore, the production capacity was maximized and the ability to meet customer
requirement was approximately accomplished. Moreover, it had been observed that by providing a better
communication between hand assembly station and vendor (because of ‘quality at the source’ concept) could lead to
better flow of work to the warehouse station.

Removing unnecessary stations from the layout such as kitting station and providing everything needed in the stations
readily available such as tooling, gauging, parts, and instruction as a part of point of use station (POUS) concept, helped
the workers in quick identification of quality issues which led to reducing time spent in inspection station and therefore,
sending more items to customers within the promised time.

Utilizing pull/Kanban system and providing controlled inventory as supermarkets in the workstations helped
considerably to reduce the idle time. The operators in upstream stations replenished only the items consumed by
downstream stations. By doing so, the waste of overproduction would be reduced and according to the Little's law as
the WIP inventory decreased in each station, the lead time would be reduced, respectively. Reducing the lead time will
reduce the takt time. By faster production of parts, it became more likely to meet customer demands on time. This point
is worthy to be noted that not only should the manufacturing setting keep up with the current customer demand, but it
also needs to have the capability to meet the projected consumer demands in the future.

2.2. How to create continuous flow and a pull system
Continuous flow is related to moving parts and providing service to external or internal customers exactly at the right
time with right amount with no delays or work-in-process inventory in between. Literally, achieving the continuous
flow which is resulted by passing products directly at one piece at a time from one workstation to another workstation
is rare. However, effective effort on "make one and move one" factory setting can help us to get close to the true
continuous flow.

Continuous flow should be obtained according to the takt time since it determines the speed rate of producing products
in value stream to meet customer demands. As it is mentioned before, continuous flow can be achieved when the
product is passed directly, one piece at a time from one workstation to another workstation. Therefore, the first step in
achieving this goal is to move only 1-piece product not in batches to the next process step when it is needed. Because in
batch production, we process units in batches and moving them into next step whether that next step is ready or not. In
this circumstance, the inventory tends to stack up in steps between process and takt time is not even considered. Based
on the simulation round 3, although reduction of lot size helped to get close to the customer demand in the available
time, the team still had a long way to go to meet customer demand. In round 4, however, the team tried to have buffer
inventory in each station to control the production of upstream stations called supermarket in which whenever one of
the controlled inventories was taken, it authorized the upstream station a replenishment signal to only produce what
have been consumed. This condition is performed in pull/Kanban system. In other words, one of the crucial ways to
achieve single-piece flow is through implementing pull/Kanban system in which, stations contain controlled inventory
called supermarket. Whenever a signal (using cards) arrives from downstream station to produce parts to the upstream
station, it will produce only at the rate of actual demand without considering forecasting. This setting helped to practice
continuous flow in simulated world.

As it is indicated above, continuous flow comes because of a pull system in which there is no or little queue time and
WIP inventory. In round 4, because of pull system, the clocks are only produced when a replenishment signal comes
from downstream station (a Kanban card became empty). This setting could create continuous flow and help in reducing
waste. This point needs to be mentioned that a pull system and just-in-time (JIT) manufacturing are used
interchangeably [9].

                                                                                                                        40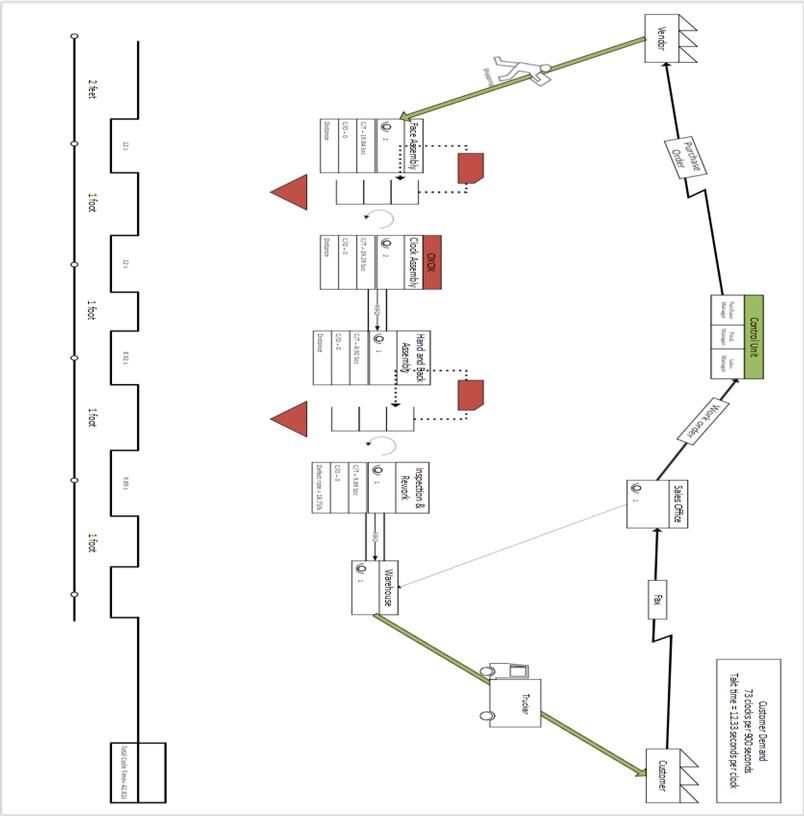
Global Journal of Engineering and Technology Advances, 2021, 06(01), 036–050

After understanding that the continuous flow can be achieved as the result of pull system, the next challenge to
implement pull system was to investigate the placement of supermarket throughout the manufacturing system.
Supermarkets are mostly placed where the cycle times between workstations are different. Also, according to the
simplified time study performed in the simulation it was determined that supermarkets should be placed in between
face assembly and clock assembly and between hand/back assembly and inspection/rework stations. Although the
supermarkets were put in all stations in lab simulation 4, it might not be a good idea to place a supermarket in the
bottleneck since it will slow down the flow of work.

One of the ways that can assist in implementing continuous flow and performing a successful pull/Kanban system is to
come up with a layout type that can have a better communication between workers to reduce movement/handling that
can lead to reducing WIP inventory and result in a better flow of work. Therefore, one of the best plant layouts that has
been introduced being able to hold these specifications is a U-shaped layout (more details are available in sub section
4.1). Also, it is to be mentioned that if setup a manufacturing cell system in the U-shaped layout is setup, the production
system will have a better flow of work since the parts manufactured in a manufacturing cell was a part family or a limited
collection of part families. By doing so, both setup time, lead time and the distance between stations will be reduced;
hence, the customer demand can be met without any late shipped products.

2.3. How to achieve load levelling or heijunka
Load leveling or heijunka is related to balancing the volume and variety of work throughout the workstations by
providing correct amount of work at a right time with almost no queue time to reach stable production of parts in each
station [10]. Load leveling will reduce the heinous effect of batches in workstation. Also, it will assist in controlling the
peaks and valleys in terms of what the production requirements were so that the resource requirement in each station
were not quite so varied. One important point that needs to be taken care of to have a successful load leveling is to
release only needed orders at a time to the next station to meet takt time demand. Therefore, it should be known how
much the takt time for the specific product (in this case, the clock assembly) is to start load leveling between
workstations. Takt time gives the notion of how long it should take to produce a single unit. Cycle time, however, is the
time that takes to produce a specific part in each station. As it is expected, cycle time in each workstation should be less
than takt time so that bottlenecks throughout the workstations can be avoided.

3. Data collection
This section includes information about data collection in the simulation study. As it was mentioned earlier, the second
round of lab simulation of clock assembly included 11 workstations in each of which different data with respect to
processes were gathered. The collected data in clock assembly was recorded at the end of the simulation for future
reference. The duration of the lab simulation in each run was 15 minutes. As it is shown in Figure 1, after changing the
layout comparing to lab simulation one as an implementation of lean tools, the number of workstations reduced to 10
workstations in clock assembly which caused better flow of work and material throughout the work area. The stations
eliminated from the work area to have a better flow of work were work in process (WIP) storage and tool crib.
Subsequently, the total number of operators involving during the simulation was reduced to 16.

In general, the performance measures during the lab simulation round 2 were units shipped on time, units shipped late,
units of ending WIP, units in finished goods warehouse, average production lead time, units passed, units failed. Each of
the performance measures was collected differently. Units shipped were collected through the schedule by the trucker
who was responsible for recording the shipment to see whether the correct number of clocks for each type were shipped
on time or late. Units of ending WIP were the total number of uncompleted blue and black clocks in each station at the
end of the simulation. The total WIP data are shown in Table 1. The data with correspondent to units in finished goods
warehouse were collected by counting the finished black and blue clocks in warehouse but were not shipped yet due to
this fact that the number of clocks could not meet the predefined batch set to be sent to the customer. The two industrial
engineers (IE’s) were responsible for tracking the average production lead time. In order to do so, the first IE write
down the starting time in a yellow sticker and put it in each container in kitting station right after the production
schedule had been made and when this container went all the way through the assembly stations to the warehouse
station, the other IE would take out the yellow sticker and write down the finishing time. This is how average lead time
is calculated which is the total of all individual cycle times in the workstations plus moving time, waiting time, and other
non-value-added time. The number of units failed and passed were recorded in inspection station in which the operator
investigated whether the black and blue clocks were assembled correctly.

                                                                                                                          41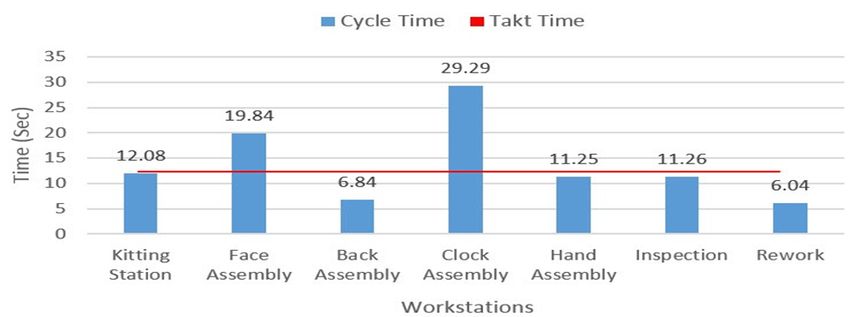
Global Journal of Engineering and Technology Advances, 2021, 06(01), 036–050

However, the focus in additional simulation rounds was to investigate the average cycle time, travel distance in each
station and total production lead time by actual observation. To obtain this information, a group of 4 members
collaborated to accomplish this mission. Two of them oversaw assembly jobs and the other two did the time study to
measure cycle times in each station. Time study was done in two sessions. In the first additional session, cycle time in
each section was calculated with respect to batch production. Three batches of blue clocks and two batches of black
clocks (12 clocks in total for each type) were selected to do the time study from the kitting station.

                                    Table 1 WIP data in second round of simulation

                                WIP data               Blue (s)       Black (d)       Total
                                Kitting                4              0               4
                                Face assembly          12             12              24
                                Back assembly          4              0               4
                                Clock assembly         0              6               6
                                Hand assembly          4              0               4
                                Inspection             0              6               6
                                Rework                 0              0               0
                                Total                  24             24              48

Then the cycle time for each clock in each station was calculated by stopwatch method while operators were doing the
assembly job. The cycle time regarding each clock was the average of cycle time of total number of clocks in that station.
In Table 2, it is shown that how the average cycle time in terms of each clock was calculated. It is worthy to mention that
the cycle time of each clock in rework station was not completely accurate since the rework time of each clock might be
different depending on how long it took for the operator to fix the problem in the assembled clock. In the second
additional simulation round, the cycle time for single clocks was collected in twelve samples to see if there was any
difference between cycle time of each station while measuring them individually or batch-wise. The tables with respect
to our measurement for single clocks (See Table A.1 and Table A.2) are put in appendix section. Based on the
observation, there was no significant difference between cycle times when measuring it batch wise and single wise.
However, the batch wise cycle time in each station was used due to this fact that the lean simulation was run in batches.

Also, the travel distance between each station was measured to investigate that how far it takes for an operator to finish
the assembly of clocks from the first station to the end. Another performance measure investigated was takt time. Takt
time is the speed rate the value stream should operate in order to meet customer demand (Nash and poling, 2011). Takt
time is calculated using the following formula.

                                              Net available time for identified time period
                                 Takt Time=
                                              Customer demand for the same time period

The numerator is the total available time that the simulation was performed in that period which was 15 minutes (900
seconds), and the denominator is the customer demand for the same period which was gained by the sales
representative through the summation of customer order schedule in 15 minutes. The total customer demand for that
period was 60. This point needs to be mentioned that the existing inventory from the previous shift in the warehouse
was not considered as the customer demand. Based on the above explanation, takt time can be calculated as follows:

                                                       900
                                          Takt Time=       =15 seconds per clock
                                                        60

The next performance measure investigated in the additional simulation round was the total production lead time.
Calculating lead time was not done through yellow stickers by IEs in additional simulation. This time, production lead
time was measured through the data gained from the lab simulation round 2. Lead time in each station was calculated
through the multiplication of existing inventory in that station and the takt time [2]. The data regarding inventory in
each station were collected through the simulation round 2 WIP data which are shown in Table 1.

                                                                                                                        42
Global Journal of Engineering and Technology Advances, 2021, 06(01), 036–050

Table 2 Average cycle time breakdown per batch in different workstation

In terms of the simulation setting, two types of clocks (blue and black) were assembled each of which had almost the
same complexity of production. According to the schedule, 60% of produced parts are blacks and the remaining 40%
are blue. It means that for each blue clock, 1.5 black clock should be produced. By considering the customer demand for
each day which is 73 and the net available time per shift the takt time was calculated as 12.33 second per clock. By
looking at Figure 2, only face assembly and clock assembly cycle times could not meet the takt time requirement.
Therefore, these stations should be leveled in a way that they will take less than takt time to stabilize the work leveling
in each station and assure meeting the customer demand.

                                                                                                                        43
Global Journal of Engineering and Technology Advances, 2021, 06(01), 036–050

                                           Figure 2 Load levelling (Heijunka)

Clock assembly and face assembly as the bottlenecks should be leveled the way that they take less than takt time to be
completed. Some reasonable ways to achieve this goal is by adding new operators to these two stations, breaking the
stations into two different stations, an efficient production schedule for the workstations or providing FIFO lines since
continuous flow might not be possible. However, providing supermarket in clock assembly and face assembly might not
be a reasonable idea since the waiting time and work-in-process inventory in these stations were substantial.

Furthermore, according to Figure 1, it can be understood that the only two clock assembly and face assembly stations
took about 50% of total cycle time of clock assembly production. These two stations can be categorized as more complex
jobs compared to other stations since they exceeded the takt time in the factory setting. Also, other stations can be
categorized as low complexity jobs that consumed less than takt time to be implemented. By looking at the proportion
of time spent on each station, it becomes clear that two stations (clock assembly and hand assembly) can be categorized
as complex jobs that take more than takt time to occur. The remaining stations take the other half of cycle time to
produce one clock. If the workload is divided throughout the stations, a release can be scheduled and even mixed of
work into the simulation proportionally based on the mentioned categories. This mix of work in each station should
match the mix of orders received from the customer demand. This would create an evenness of work in clock assembly.
Generally, there can be have high, medium, and low complexity jobs in workstations in a manufacturing setting that in
each workstation the cycle time could be more than the standard takt time. But the mix of work that would cling to the
predetermined proportions and this would create an evenness of work in the factory setting. These were some patterns
(Figure 3) that can be utilized to perform load leveling in manufacturing setting. In section 4, the exact load leveling of
simulation between workstations based on the cycle time data will be discussed.

4. Implementation of Kaizen events
The fundamental goal of any Kaizen event is change for good or improvement. The current state map (Figure 4) is the
first step towards continuous improvement. While creating the future state map, it is essential that the Kaizen events
(Figure 5) take place in a way that improves at least one (or even more) of the assessed performance matrices in the
production line and does not affect any other metrices adversely. Implementation of Kaizen events flawlessly ensures
better production flow, reduces wastes, improves throughput and minimizes cost in the long run.

4.1. Plant layout change
The plant layout change is one of the most essential Kaizen events. This affects the total production flow. The new and
improved VSM is shown in Figure 6. In this VSM, the unnecessary station from (current state) lean simulation round 2
(namely kitting station) was discarded. Some stations were integrated because of their individual low cycle time and
similarity. The material handler, industrial engineers were also removed from the layout. The workstations are
arranged close to each other for minimizing the travel distance and other delays that occur due to transportation. This
change reduced the total production lead time and improved throughput significantly. Figure 3 shows an ideal U-shaped
layout [11] which is desired.

                                                                                                                        44
Global Journal of Engineering and Technology Advances, 2021, 06(01), 036–050
Figure 3 U-shaped layout directly copied from Management and Development Center
4.2. Visual controls in all stations
Deploying visual controls in all the workstations improves the workers’ knowledge about the process. It can also work
as a memorandum of the processing sequence in that specific workstation. It is always important for the workers to
visualize the process that they are working on in the value stream. Visual control management has different types.
Written instruction is one of them. This helps reduce the cycle time significantly and improves product quality. The
future state map will have visual control in form of written specific instructions in each workstation for worker
convenience.
4.3. Removal of the material handler
In lean simulation round 1 and 2, the material handler played a vital role for transportation. In the future state, the
material handler is discarded as there is no need for him/her anymore as the workstations are placed strategically close
to each other and this ensures an uninterrupted production flow. Reduction in WIP inventory is an immediate result of
this Kaizen event.
4.4. Removal of industrial engineers
The industrial engineers reported the starting time and end time of a batch of clocks assembled through the system. The
difference between these two is the production lead time (PLT). In the future state, the production lead time will be
calculated depending upon the number of fixed inventory unit and pre-calculated takt time for that VSM (which is 12.33
seconds per clock in this case). Employing the industrial engineers in the current state map falls into one of the waste
categories and that is under-utilization of employees. They could be more efficient somewhere else. Removal of
industrial engineers reduced waste and production lead time while improved productivity and throughput.
4.5. Integration of inspection and rework stations
In lean simulation round 1 and 2, the material handler played a vital role for transportation. In the future state, the
material handler is discarded as there is no need for him/her anymore as the workstations are placed strategically close
to each other and this ensures an uninterrupted production flow.
4.6. Integration of back and hand assembly stations
In future state map, the back and hand assembly stations were combined since they have similar cycle time and standard
operating procedures.
4.7. Add poka-yoke devices
Poka-yoke devices like go/no go devices were added for a smoother and mistake-proof production flow.
4.8. Kanban/pull system
In future state map, a pull system was introduced instead of a push system. In a pull system, the production flow is
controlled by customer demand.
45Global Journal of Engineering and Technology Advances, 2021, 06(01), 036–050
4.9. Add supermarkets
In a pull system, the concept of supermarkets is vital. In the future state map, the supermarkets are being used as a
control buffer in two places- between face and clock assembly stations and between hand-back assembly and
inspection-rework stations.
4.10. Special exclusive training session for clock assemblers
The clock assembly station was identified as the bottlenecking station in the initial lean simulation rounds. A special
training session might be conducted just for the workers in that workstation to discuss the possible reasons for
bottlenecking. After extensive training sessions and fruitful discussions, the workers should be able to reduce the cycle
time in that station significantly and thereby improve the overall productivity.
4.11. Load levelling (Heinjunka)
Load levelling or heijunka in the clock assembly stations can be done in several ways. According to the future state map,
heijunka will be applied to the clock assembly station which is the potential bottlenecking station as mentioned earlier.
In lean simulation rounds, the customer demand was 73 (42 black clocks and 31 blue clocks) clocks in 15 minutes. The
ratio of black and blue clock demand is approximately 1.35:1 or roughly 1.5:1. As we expected from the batch
information (6 black clocks and 4 blue clocks), this ratio is equivalent to 3:2 and thus the sequence of production for
black and blue clock could be one of the following.
5. Results
The results contain the corrected/updated current state map and proposed future state map. The corrected current
state map from lean simulation with Kaizen bursts has been shown in the Figure 5. There are several Kaizen bursts that
affect more than one station. These are placed near one relevant station in Figure 5. Some Kaizen improvements (e.g.,
plant layout change, visual controls in all stations etc.) are applied to the whole value stream. To emphasize those, bigger
Kaizen bursts have been used. The following subsections will be used to explain the key points for both value stream
maps.
5.1. Current state map
The current state map shows different communications, main flows, parallel flows and other related processes. The
control unit at the top of the map hosts purchase manager, sales manager and production manager. The production
starts from the customer demanding a certain number of clocks (black or blue) through electronic order to sales office.
The sales office, upon receiving the customer order form, initiates work order and inspects the availability of clocks in
the warehouse. The purchase manager in control unit then dispatches work order to the supplier to ensure the supply
at the kitting station which is the first process in the main flow.
The original simulation was run based on separate batches of black (6 per batch) and blue (3 per batch) clocks. For
simplicity, we considered the total number of clocks in our VSM and likewise the takt time was calculated for each clock
regardless of its color. Besides, there was no significant change-over (C/O) time due to the color variation in the value
stream. Only the face assembly and clock assembly workstations have more cycle time than the estimated takt time in
our VSM. As the timeline shows, the clock assembly station takes the highest time to finish its operation and therefore
can be identified as a bottlenecking station in the total process. Also, any activity in terms of reducing the cycle time
should be implemented in clock assembly station first. All the stations and other components in this simulation follow
FIFO (First in First out) rule.
There are some discrete units like industrial engineer (IE) and material handler in the VSM as well. One of the industrial
engineers records the start time and the other records the end time for each batch assembly. The difference between
the times is the average lead time. The material handler is the only unit responsible for the transportation of material
from one station to another. Therefore, it is utmost important that the material handler is allowed easy access
throughout the entire space. The process layout change implemented in simulation round 2 basically focuses on the
46Global Journal of Engineering and Technology Advances, 2021, 06(01), 036–050
ease of accessibility for the material handler. When the process is finished and the warehouse receives the required
items, a trucker is used to ship the items to the customer.
The average production lead time from round 2 is around 10 minutes (600 seconds) and the estimated production lead
time is 810.3 seconds. This difference exists because the data were collected from each station one by one (unlike round
2 when all the stations were working simultaneously) and there were different workers doing the assembly.
It is to be noted that the rework and redundant inspection processes are non-value added (NVA) activities. But there
exists a bi-directional flow (feedback) between them which is difficult to interpret in VSM. To solve it, a terminator was
used after the rework station to use it to send the reworked clocks back to the main flow through the inspection station
as shown in Figure 5.
Based on the standard formula, the total production lead time shown in Figure 4 is calculated like the following:
Total production lead time=Total of all days’ worth of inventory (work) + total cycle time
= 810.3 Seconds [from Figure 4]
5.2. Corrected/updated current state map with Kaizen bursts
The corrected/updated current state map is shown in Figure 5. The Kaizen bursts show different improvement ideas
and their implementation in the value stream. There might be more scopes for improvement which cannot be explored
due to some limitations of resource. The takt time is now corrected and rework station has been placed vertically with
inspection workstation. Total production lead time is also updated accordingly. Other minor changes are reflected as
needed.
5.3. Future state map
The future state map is shown in Figure 6. After implementing the Kaizen events, significant reduction of cycle time is
noticed throughout the value stream. Some of the stations are integrated for a smoother flow of products, reduction of
WIP inventory and cycle time. Kanban/pull system and FIFO lanes are introduced properly in between different
stations. Two supermarkets have been introduced to act as a buffer between face assembly and clock assembly stations
and between integrated hand-back and integrated inspection-rework stations.
According to the data collected in simulation round 1 and 2, both the hand and back assembly stations required less
cycle times than other ones. That is why these stations are integrated in the future state map while their cycle time is
averaged and reported. As for the inspection and rework stations, the integration is implemented due to their existing
parallelism in operations. All the necessary details of these improvements will be discussed in the next paragraphs.
To avoid unnecessary movements and under-utilization of employees, both the material handler and two industrial
engineers were removed in the future state map. These were discrete entities in the current state map and adding no
market value to the product. Introducing supermarkets in between some stations ensures the smooth flow and
replenishment of the production along the production line. The material handler, whenever called upon, had to respond
to call from each station which resulted in waste of production time and piled up the inventory. All these issues were
resolved by using supermarket and strategic positions of the workstations with respect to each other.
One important issue to be addressed in the future state map is that there is no production lead time reported there. In
a Kanban/pull system with supermarkets, the production lead time can be calculated by multiplying the fixed inventory
(as shown in Figure 3) with takt time. In our clock assembly production, this fixed inventory value is intuitive. In lean
simulation round 4, two blue clocks and three black clocks were used as a fixed inventory. As there is no established
way to find out the number of fixed inventories as per our limited knowledge, the total production lead time could not
be reported in the future state map. In a sense, the push-pull system can be thought of a game theoretical problem when
both parties want to have more rewards, like customers want products and producers want profits [12].
Apart from the changes above, all other entities reported in the current state map remain same in the future state map.
The information/communication flow is similar in both states due to their minimal impacts in our clock assembly
production system. External sources like customers and vendors retain their roles and positions as well in the future
state map.
47Global Journal of Engineering and Technology Advances, 2021, 06(01), 036–050
Figure 4 Current state map
Figure 5 Corrected/updated current state map
48Global Journal of Engineering and Technology Advances, 2021, 06(01), 036–050
Figure 6 Future state map
6. Conclusion
This article discusses how to represent process and communication flows in a production floor with value stream
mapping. The simulation study presented here, reveals different wastes in a manufacturing process and how to
minimize them with lean tools like 5S, visual communication, standardized work and most importantly process layout.
The results of this study on clock assembly simulation round 4 utilized lean concepts and showed noticeable
improvement in terms of throughput, quality, and other performance matrices than round 1. The current state map that
has been presented here might be the baseline for future improvement through lean tools and concepts implementation.
Compliance with ethical standards
Acknowledgments
This case study would not have been completed without the direct supervision of Dr. Shi-Jie (Gary) Chen and the
graduate students of class 2018 from industrial and systems engineering (ISYE) department of Northern Illinois
University
Disclosure of conflict of interest
The authors of this article whose names appear above, have hereby declare that there is no conflict of interest.
References
[1] Liker JK, Wu YC. Japanese automakers, US suppliers and supply chain superiority. Supply Chains and Total
Product Systems: A Reader. 2006 Feb 10:177-196.
[2] Nash MA, Poling SR. Mapping the total value stream: a comprehensive guide for production and transactional
processes. CRC Press; 2011 Mar 23.
[3] Seth D, Seth N, Dhariwal P. Application of value stream mapping (VSM) for lean and cycle time reduction in
complex production environments: a case study. Production Planning & Control. 2017 Apr 4;28(5):398-419.
49Global Journal of Engineering and Technology Advances, 2021, 06(01), 036–050
[4] Cavdur F, Yagmahan B, Oguzcan E, Arslan N, Sahan N. Lean service system design: a simulation based VSM case
study. Business Process Management Journal. 2019 Oct 14;25(7):1802-1821.
[5] Prasetyo SA, Mauludin MM, Hutauruk PS, Pribadi S. THE STUDY OF LEAN CONCEPT USING VSM METHOD TO
IMPROVE CUSTOMER SATISFACTION IN MODERN RETAILER. Advances in Transportation and Logistics
Research. 2020 Dec 1;3: 99-104.
[6] Noto G, Cosenz F. Introducing a strategic perspective in lean thinking applications through system dynamics
modelling: the dynamic Value Stream Map. Business Process Management Journal. 2020 Sep 24.
[7] Hosseinabad ER, Moraga RJ. The evaluation of renewable energy predictive modelling in energy dependency
reduction: a system dynamics approach. International Journal of Applied Management Science. 2020;12(1):1-22.
[8] Zaman MAU, Sooriyaarachchi D, Zhou YG, Tan GZ, Du DP. Modeling the density gradient of 3D nanofiber scaffolds
fabricated by divergence electrospinning. Advances in Manufacturing. 2020 Jun 13:1-6.
[9] Johns R, Crute V, Graves A. Lean Supply: Cost Reduction or Waste Reduction? The Society of British Aerospace
Companies. 2002 Oct.
[10] Tapping D. The new Lean pocket guide XL: Tools for the elimination of waste. MCS Media, Incorporated; 2010.
[11] Hosseinabad ER, Zaman MAU. A Brief Review on Cellular Manufacturing and Group Technology. Research Journal
of Management Reviews. 2020; 5(1): 1-20.
[12] Zaman MAU. On the Reliability-Based Design Optimization (RBDO) of A Speed Reducer. International Journal of
Engineering Innovations and Research. 2019 Jan;8(1):14-22.
Author’s Short Biography
Muhammad Adib Uz Zaman is currently a Ph.D. candidate of Industrial Engineering and
research fellow at Texas Tech University. His research interests are predictive modeling, data
science and operations research. He earned a bachelor’s and a master’s degree in Industrial
Engineering from Bangladesh University of Engineering and Technology and Northern Illinois
University, respectively in 2015 and 2018. To know more about his research, kindly visit his
research webpage (https://auzipe.wixsite.com/adib)
Emad Rabiei Hosseinabad obtained a bachelor’s and a master’s degree in Industrial
Engineering from Azad University of Karaj and Northern Illinois University, respectively in 2015
and 2018. His research interests are applied System Dynamics, predictive modeling, and
decision-making analysis. He is currently in an industrial engineer role working on continuous
improvement projects in the supply chain and logistics industry.
50You can also read