The effect of process variables on the physical properties and microstructure of HOPO nanoemulsion flakes obtained by refractance window - Nature
←
→
Page content transcription
If your browser does not render page correctly, please read the page content below
www.nature.com/scientificreports
OPEN The effect of process variables
on the physical properties
and microstructure of HOPO
nanoemulsion flakes obtained
by refractance window
M. Hernández‑Carrión, M. Moyano‑Molano, L. Ricaurte, A. Clavijo‑Romero &
M. X. Quintanilla‑Carvajal*
Refractance window (RW) drying is considered an emerging technique in the food field due to its
scalability, energy efficiency, cost and end-product quality. It can be used for obtaining flakes from
high-oleic palm oil (HOPO) nanoemulsions containing a high concentration of temperature-sensitive
active compounds. This work was thus aimed at studying the effect of temperature, thickness of
the film drying, nanoemulsion process conditions, and emulsion formulation on the flakes’ physical
properties and microstructure. The results showed that HOPO flakes had good physical characteristics:
1.4% to 5.6% moisture content and 0.26 to 0.58 aw. Regarding microstructure, lower fractal dimension
(FDt) was obtained when RW drying temperature increased, which is related to more regular surfaces.
The results indicated that flakes with optimal physical properties can be obtained by RW drying of
HOPO nanoemulsions.
Nanoencapsulation involves packing substances into a miniature-sized vessel and refers to bioactive packing on
a nanoscale range. It is characterised by increasing encapsulated active compound bioavailability and protection
against environmental and processing effects1,2. Nanoencapsulation often begins with the production of nanoe-
mulsions. These are emulsions with an average droplet size of 300 nm3, containing oil, water and an emulsifier,
which is a critical factor for creating small-sized droplets as this decreases interfacial tension (i.e. surface energy
per unit area) between an emulsion’s oil and water p hases4. Nanoemulsions used in the food science and industry
fields have mainly been focused on lipid nanoparticle delivery or bioactive compound release systems due to
their minimum impact on sensory characteristics and high b ioavailability5,6.
One of the process which allows to obtain nanoemulsion is m icrofluidization7. This technique has been widely
used and represents a highly efficient method for producing nanoemulsions containing small-sized droplets
(100–500 nm)8. It uses high pressure to force fluid into specially configured m icrochannels9. Apart from inertia
regarding turbulent flow, laminar elongational flow and cavitation also contribute to droplet break-up10.
On the other hand, Refractance Window (RW) drying is a novel drying system which converts foods into
flakes or powders11. Here, thermal energy is transferred from hot water (95–97 °C), which is circulated beneath
a plastic conveyer belt (Mylar) and used to dry a thin layer of product on the belt surface12. Studies have sug-
gested that using a thin plastic belt which is transparent to infrared radiation (IR) creates a “window” for thermal
energy to become transferred from hot water to wet food material13. As a product becomes dried as a thin film
and cold air is circulated over the food layer, the heated surface is much lower (70–80 °C) compared to drum
drying (120–150 °C); this means that RW-dried products typically have excellent colour, vitamin and antioxidant
retention, compared to conventional drying m ethods14.
Image analysis represents a particularly useful tool for characterising food morphology. Many food materi-
als present highly irregular structures that elude precise quantification by conventional techniques. This meth-
odology enables measurements to be obtained from digitalised images15,16. Texture is an important characteristic
used in identifying objects or regions of interest in an image, a grey level co-occurrence matrix (GLCM) (an
image processing technique) has been widely used for measuring texture in images; image analysis can highlight
Facultad de Ingeniería, Universidad de la Sabana, Km 7 vía autopista Norte, Bogotá, Colombia. * email: maria.
quintanilla1@unisabana.edu.co
Scientific Reports | (2021) 11:9359 | https://doi.org/10.1038/s41598-021-88381-7 1
Vol.:(0123456789)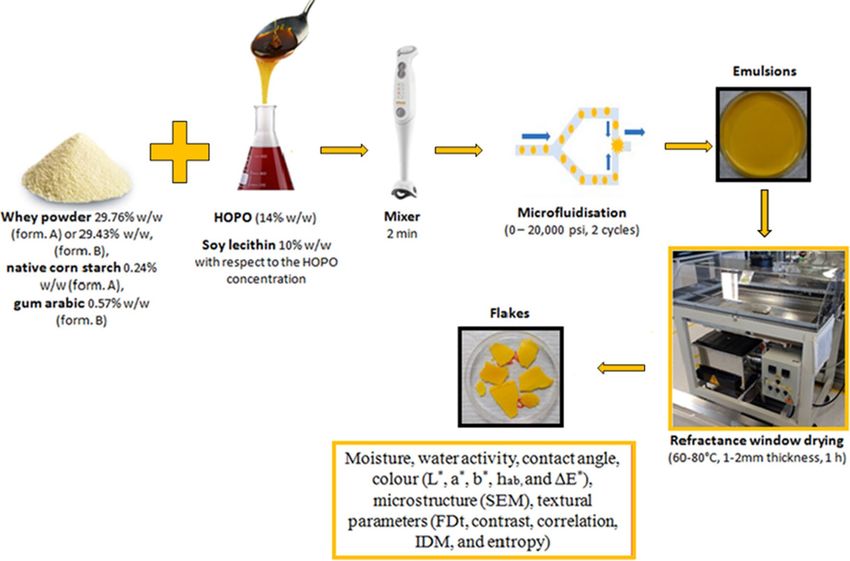
www.nature.com/scientificreports/
textural features, such as angular second moment, contrast, correlation, inverse difference moment and entropy,
which can relate to the quality state of the microstructure of the f ood17,18. Also, fractal dimension measures can
be used to describe fractured surfaces quantitatively. A greater fractal dimension DF means a more tortuous
fracture surface.
Regarding the formulation of microfluidization-obtained oil-in-water nanoemulsions, several authors have
studied the effect of the ingredients used in them on their s tability19–22. Other studies have focused on compar-
ing drying technologies’ (including RW) effect on the physicochemical properties and content of functional
compounds on vegetable m atrices14,23–27. However, the effect of the process variables of RW drying on high-oleic
palm oil (HOPO) nanoemulsions’ physical and microstructural properties are not reported in the literature.
The present work was thus aimed at studying the effect of process variables (drying temperature, sample
thickness, microfluidization pressure) and formulation on RW-dried HOPO nanoemulsions’ physical proper-
ties (moisture, water activity, contact angle and colour) and microstructure to ensure obtaining a dried product
having high oil content.
Materials and methods
Material. High-oleic palm oil was obtained from Fedepalma, Bogota, Colombia; whey powder was bought in
a local market in Bogota, Colombia; soy lecithin was obtained from Bellchem International, Medellin, Colombia;
gum Arabic powder from C. E. Roeper GmbH, Hamburg, Germany; and native corn starch from Cimpa SAS,
Bogota, Colombia.
Preparation of coarse emulsions. The coarse emulsions were homogenized in an mixer (Imusa, Bogota,
Colombia), first the aqueous phase of the emulsion was prepared incorporating whey powder (formulation A:
29.76% (w/w); formulation B 29.43% (w/w)), determined according to preliminary results28, followed by the
sequential addition of native corn starch (0.24% w/w, formulation A) or gum Arabic (0.57% w/w, formulation B).
Then it was followed by the addition of HOPO (14%, w/w) to the aqueous phase and mixed over 2 min. The soy
lecithin concentration was held constant at 10% w/w with respect to the HOPO concentration (1.4%, w/w) and
it was added to the oil phase in the preparation of the coarse emulsion. Subsequently, emulsions were processed
to obtain the nanoemulsions.
Nanoemulsion preparation. The nanoemulsions were obtained following the methodology of Quinta-
nilla-Carvajal et al.29 with some modifications. They were homogenized in an LM10 microfluidizer (Microfluid-
ics, England) variating the operation pressure between 0 and 20,000 psi following a Box-Behnken optimization
design obtained from the software Design Expert Version 10.1.0 (Stat-Ease Inc., MN, USA), in which the follow-
ing two numerical factors and one categorical were also varied accordingly to their impact on the process: drying
temperature (60–80 °C), sample thickness (1–2 mm), and the formulation (A and B), respectively. Table 1 shows
the conditions provided by the Box-Behnken optimization design for the preparation of HOPO nanoemulsions.
Figure 1 shows a graphical description of the procedure used to obtain the HOPO nanoemulsions and flakes.
Refractance window drying (RW). A pilot scale Refractance Window (RW) dryer was used for drying
nanoemulsions of HOPO. The dryer has an effective surface drying area of 0.43 m2 and length of 0.92 m. The
main components of the dryer included a belt made of “Mylar” (polyethylene terephthalate) plastic, a water
pump, a hot water tank, a heating unit, two water flumes, a suction blower, a spreader, and a scraper. The drying
was accomplished by spreading HOPO nanoemulsions on the plastic belt. Molds of 14 × 24 × 0.3 cm were used
to control the size of the samples. The thickness of the nanoemulsion on the belt was 1–2 mm and was con-
trolled using a spreader bar. The thermal energy from the circulating hot water (transferred to the nanoemulsion
through the belt) was used to remove moisture from the product30. During drying operation, the temperature
of circulating hot water was maintained at 60 °C, 70 °C and 80 °C according to the experimental design. The
temperature of the circulating hot water was continuously monitored at the flume inlet and outlet section using
pre-calibrated Type T thermocouple sensors. Water vapor removal from the samples was facilitated by using
a suction blower. The residence time to dry the HOPO nanoemulsions into flakes was set at 1 h, this time was
determined according to preliminary studies (data not shown).
Physical properties of the flakes. Moisture. The moisture content of the flakes was measured from
0.3 g of sample employing an EM 120-HR moisture analyser (Precisa Gravimetrics AG, Dietikon, Switzerland).
Measurements were performed in triplicate, results are expressed in percent wet basis.
Water activity. The water activity of the flakes was measured using an AquaLab Series 4 aw meter (Decagon
Devices, Inc., Pullman, WA) after the samples were stabilized at 25 °C for 30 min31. The measurements were
performed in triplicate.
Contact angle (CA). For contact angle (CA) measurements of the flakes a MobileDrop contact angle meter
(Kruss, Hamburg, Germany) was used, three measurements were performed with a measuring drop of 4.5 µL,
and the contact angle was measured at 1 s after the release of the droplet.
Color. The color of the fresh nanoemulsions and flakes was measured. The measurements were carried out
with a ColorQuest XE (HunterLab, U.S.A). The results were expressed in accordance with the CIELAB system
Scientific Reports | (2021) 11:9359 | https://doi.org/10.1038/s41598-021-88381-7 2
Vol:.(1234567890)www.nature.com/scientificreports/
Factor 1 Factor 2 Factor 3 Factor 4
A:
temperature B: thickness C: pressure D:
Run (°C) (mm) (psi) formulation Moisture (%) aw CA (°) hab (°) ΔE*
1 80 1.5 20,000 A 2.03 0.3440 26.78 76.06 8.53
2 70 1.5 10,000 A 1.70 0.3711 24.94 76.72 8.60
3 80 2 10,000 A 2.24 0.3435 32.00 76.15 6.71
4 80 1.5 0 B 1.80 0.3486 26.18 73.77 11.34
5 60 2 10,000 A 3.18 0.4151 21.75 76.18 7.77
6 70 1.5 10,000 B 1.40 0.3786 22.20 75.43 10.36
7 70 1.5 10,000 B 1.80 0.3457 20.26 76.47 13.29
8 70 2 20,000 A 2.77 0.3314 20.70 77.05 7.73
9 60 1.5 20,000 A 4.56 0.3396 29.10 77.61 8.05
10 60 2 10,000 B 3.44 0.4557 19.15 76.60 7.80
11 70 1 0 A 3.42 0.3013 22.99 76.52 8.87
12 60 1 10,000 B 3.46 0.3519 23.24 77.46 10.34
13 80 1.5 20,000 B 1.79 0.3177 29.42 77.65 6.49
14 70 1.5 10,000 B 2.85 0.3052 23.69 75.76 10.98
15 60 1 10,000 A 4.84 0.5806 25.57 77.70 8.71
16 70 1.5 10,000 B 4.07 0.3255 26.65 76.96 12.62
17 70 1.5 10,000 A 3.46 0.3188 24.25 78.61 3.81
18 80 1 10,000 B 3.68 0.3628 29.95 76.64 6.04
19 70 2 20,000 B 3.79 0.3579 22.92 74.75 8.76
20 60 1.5 20,000 B 5.65 0.4452 20.45 75.67 8.16
21 70 2 0 A 2.16 0.3449 21.01 73.87 9.20
22 70 2 0 B 2.79 0.3641 20.61 73.81 9.94
23 60 1.5 0 A 4.49 0.4138 22.06 73.24 10.48
24 80 1.5 0 A 2.48 0.2872 29.73 74.27 10.38
25 70 1 20,000 A 2.42 0.2816 20.69 78.17 11.05
26 70 1.5 10,000 A 2.76 0.3310 22.73 75.79 8.24
27 70 1.5 10,000 A 3.57 0.2680 17.27 78.80 8.81
28 60 1.5 0 B 3.49 0.4590 18.88 76.73 8.50
29 70 1 0 B 2.87 0.3183 21.18 76.01 8.38
30 80 2 10,000 B 2.18 0.3070 30.57 76.39 10.20
31 70 1 20,000 B 3.33 0.3675 15.72 77.04 6.03
32 70 1.5 10,000 B 2.91 0.3642 19.42 76.77 7.66
33 70 1.5 10,000 A 4.58 0.3539 21.04 77.91 11.45
34 80 1 10,000 A 2.71 0.3323 26.25 78.67 11.91
Factor 1 Factor 2 Factor 3 Factor 4
A:
temperature B: thickness C: pressure D:
Run (°C) (mm) (psi) formulation FDt Contrast Correlation IDM Entropy
1 80 1.5 20,000 A 2.5819 576.36 8.176 × 10⁻⁴ 0.052 9.142
2 70 1.5 10,000 A 2.5823 562.93 7.903 × 10⁻⁴ 0.053 9.236
3 80 2 10,000 A 2.5628 542.28 9.004 × 10⁻⁴ 0.053 9.056
4 80 1.5 0 B 2.5884 646.24 7.343 × 10⁻⁴ 0.049 9.299
5 60 2 10,000 A 2.6477 1011.11 4.805 × 10⁻⁴ 0.049 9.569
6 70 1.5 10,000 B 2.5746 570.87 8.420 × 10⁻⁴ 0.052 9.117
7 70 1.5 10,000 B 2.5661 576.00 8.605 × 10⁻⁴ 0.051 9.044
8 70 2 20,000 A 2.5577 566.45 8.716 × 10⁻⁴ 0.052 9.053
9 60 1.5 20,000 A 2.6390 980.59 5.054 × 10⁻⁴ 0.039 9.528
10 60 2 10,000 B 2.6463 947.07 5.244 × 10⁻⁴ 0.040 9.562
11 70 1 0 A 2.5763 679.40 7.206 × 10⁻⁴ 0.047 9.297
12 60 1 10,000 B 2.6632 1042.35 4.765 × 10⁻⁴ 0.038 9.670
13 80 1.5 20,000 B 2.5740 557.21 8.359 × 10⁻⁴ 0.053 9.158
14 70 1.5 10,000 B 2.6055 744.08 6.711 × 10⁻⁴ 0.045 9.295
15 60 1 10,000 A 2.6488 946.88 5.243 × 10⁻⁴ 0.041 9.558
16 70 1.5 10,000 B 2.5835 548.90 8.318 × 10⁻⁴ 0.053 9.102
17 70 1.5 10,000 A 2.5675 552.89 8.501 × 10⁻⁴ 0.052 9.129
Continued
Scientific Reports | (2021) 11:9359 | https://doi.org/10.1038/s41598-021-88381-7 3
Vol.:(0123456789)www.nature.com/scientificreports/
Factor 1 Factor 2 Factor 3 Factor 4
A:
temperature B: thickness C: pressure D:
Run (°C) (mm) (psi) formulation FDt Contrast Correlation IDM Entropy
18 80 1 10,000 B 2.5886 588.15 8.071 × 10⁻⁴ 0.051 9.175
19 70 2 20,000 B 2.5598 535.17 8.415 × 10⁻⁴ 0.053 9.186
20 60 1.5 20,000 B 2.6388 943.09 5.314 × 10⁻⁴ 0.040 9.129
21 70 2 0 A 2.5481 567.07 8.395 × 10⁻⁴ 0.052 9.166
22 70 2 0 B 2.5566 554.99 7.766 × 10⁻⁴ 0.053 9.268
23 60 1.5 0 A 2.5980 743.88 5.833 × 10⁻⁴ 0.046 9.486
24 80 1.5 0 A 2.5578 631.66 7.84Ex10–4 0.049 9.189
25 70 1 20,000 A 2.5842 574.64 8.336 × 10⁻⁴ 0.052 9.147
26 70 1.5 10,000 A 2.6073 815.98 6.028 × 10⁻⁴ 0.043 9.290
27 70 1.5 10,000 A 2.5897 593.05 7.980 × 10⁻⁴ 0.051 9.199
28 60 1.5 0 B 2.6202 845.60 5.012 × 10⁻⁴ 0.042 9.710
29 70 1 0 B 2.5400 558.19 8.504 × 10⁻⁴ 0.052 9.159
30 80 2 10,000 B 2.6010 623.01 7.503 × 10⁻⁴ 0.050 9.270
31 70 1 20,000 B 2.5645 556.09 8.927 × 10⁻⁴ 0.053 9.001
32 70 1.5 10,000 B 2.5524 524.56 9.457 × 10⁻⁴ 0.054 8.978
33 70 1.5 10,000 A 2.5475 495.47 9.894 × 10⁻⁴ 0.055 8.891
34 80 1 10,000 A 2.5988 640.00 7.444 × 10⁻⁴ 0.049 9.255
Table 1. Box Behnken experimental design methodology for preparation of emulsions and adjusted variables
to the model: moisture, water activity (aw), Contact angle (CA), Hue (hab°) and change of color (ΔE*) for
flakes of HOPO nanoemulsions. Box Behnken optimal experimental design methodology for preparation of
emulsions and adjusted variables to the model: FDt, Contrast, Correlation, IDM, and Entropy for flakes of
HOPO nanoemulsions.
with reference to illuminant C and a visual angle of 10°32. The colorimeter was calibrated with a black and white
standard patterns. Hue (hab) was determined using Eq. (1).
hab = arctan b∗ /a∗ (1)
In this case, b* is the yellow/blue coordinate, and a* the red/green coordinate. Total color difference (ΔE*)
regarding fresh nanoemulsions was calculated as f ollows33.
�E∗ = [(�L∗ )2 + [(�a∗ )2 + [(�b∗ )2 ]1/2 (2)
The ΔL*, Δa* and Δb* variables are the difference values between a reference color and the color of the sample;
ΔL* represents the difference of lightness, Δa* represents the difference of red/green coordinate, and Δb* repre-
sents the difference of yellow/blue coordinate. The values used to determine whether the total color difference
was appreciable by the human eye were the following34:
ΔE* < 1 color differences are not obvious for the human eye.
1 < ΔE* < 3 color differences are not appreciated by the human eye.
ΔE* > 3 color differences are obvious for the human eye.
Measurements were performed in triplicate in three different flakes obtained by RW drying.
Scanning electron microscopy (SEM). The analysis of microstructure of flakes was performed using a scanning
electron microscope (Phenom Pro, Cecoltec Ltda, Bogotá, Colombia) at an acceleration voltage of 5 kV. The
samples of 2 mm wide were placed on the scanning electron microscope slides with the aid of colloidal silver and
a magnification of 4000x was used for the analysis.
Image analysis. Images of the flakes of 2048 × 2176 pixels were captured using an electronic microscopy and
stored as bitmaps in a gray scale with brightness values between 0 and 255 for each pixel constituting the image.
A generalization of the box counting method was used to evaluate the fractal dimension of the images (FDt). In
this work, the shifting differential box-counting method (SDBC)35 was used to evaluate the fractal dimension of
texture of SEM images using the ImageJ 1.34 software. Four different images at the same magnification (4000×)
were evaluated for each flake HOPO nanoemulsion. The size of the crops was 67.81 μm × 67.81 μm. The texture
parameters, contrast, correlation, inverse difference moment (IDM), and entropy of SEM images were evaluated
using the GLCM and surface plot tools of ImageJ.
Scientific Reports | (2021) 11:9359 | https://doi.org/10.1038/s41598-021-88381-7 4
Vol:.(1234567890)www.nature.com/scientificreports/
Figure1. Graphical description of the process to obtain HOPO nanoemulsions and flakes.
The textural feature contrast is a measure of the intensity contrast between a pixel and its neighbour over
the whole image. It measures the local variation in the GLCM. Contrast is 0 for a constant image34. The textural
feature correlation is a measure of how correlated a pixel is to its neighbour over the whole image. Its range lies
between − 1 and + 1. Also, the correlation is 1 or − 1 for a perfectly positively or negatively correlated image.
Correlation measures the joint probability of occurrence of pixel pairs of GLCM36. The textural feature inverse
difference moment (IDM) measures the texture uniformity or orderliness of an image but normalized for distance.
As defined by Yang and collaborators, higher inverse difference moment values indicate a variation in image
contrast37, that is, greater heterogeneity of the flakes texture. The textural feature entropy is a statistical measure
of randomness that can be used to characterize the texture of the input image38.
Statistical analysis. The statistical analysis was performed using the Box-Behnken optimization experi-
mental design methodology in the Design Expert Software Version 10.1.0 (Stat-Ease Inc., MN, USA). Quadratic
models were used to express the response variables as a function of the independent factors, where A, B, C, and
D, are the coded values of the drying temperature, the sample thickness, pressure, and formulation, respectively.
A statistical significance test was used in the total error criteria with a confidence level of 95%. The significant
terms in the model were found through analysis of variance (ANOVA). The fit of the model was evaluated by
the R2 value.
The graphic and numerical optimization of the Design Expert software was used for response optimization.
Two optimisation systems (Opt A and Opt B) were formulated; one for a nanoemulsion made from formulation
A (Opt A) and the other for a nanoemulsion made with formulation B (Opt B), both having minimum moisture
and water activity (aw) after RW drying.
Results and discussion
Moisture. A sample’s moisture during drying is the ratio of a sample’s mass of water after drying to a sample’s
total mass. Table 2 gives analysis of variance (ANOVA) results for moisture response. The results were fitted to
a quadratic model, giving 0.81 R2. Table 2 shows that the model was significant (p < 0.05) and had 0.0584 lack of
fit (p > 0.005); such result indicated that the model was suitable and could thus predict the moisture content for
flakes from RW dried-nanoemulsions, prepared from a determined concentration of buttermilk, starch or gum
Arabic and oil. The flakes’ moisture content ranged from 1.8 to 5.65% (Table 1).
Drying temperature was the variable which significantly affected (p < 0.05) the resulting moisture pattern;
the higher the drying temperature, the lower the moisture content in the resulting flake. Even though the pattern
was the same for both formulations, formulation B had lower moisture content at the same temperature than that
for formulation A. The above could be due to the difference in wall material in both formulation (formulation
A was prepared with corn starch and formulation B with gum Arabic), the molecular weight of wall materials
impact its capacity of absorb water, affecting directly the moisture content of the sample. In the supplementary
file Table S1 are shown the equations describing the pattern of moisture content for both formulations.
Scientific Reports | (2021) 11:9359 | https://doi.org/10.1038/s41598-021-88381-7 5
Vol.:(0123456789)www.nature.com/scientificreports/
Moisture (%) aw CA (°) hab (°) ∆E*
SS df p-value SS df p-value SS df p-value SS df p-value SS df p-value
Model 21.691 19 0.014 0.0602 19 0.0283 44.506 19 0.0287 582.031 19 0.0047 361.620 13 0.8568
A 12.616 1 < 0.001 0.0264 1 0.0003 16.091 1 0.0007 0.1585 1 0.6504 0.2055 1 0.8408
B 1.096 1 0.099 0.0001 1 0.7707 0.0057 1 0.7991 112.341 1 0.0016 0.6546 1 0.7203
C 0.500 1 0.253 0.0001 1 0.7721 0.0034 1 0.8431 155.746 1 0.0004 94.393 1 0.1831
D 1.190 1 0.087 0.0005 1 0.5353 0.0049 1 0.8141 41.644 1 0.0325 12.809 1 0.6170
AB 0.010 1 0.872 9.59. × 10–7 1 0.9773 0.2546 1 0.1049 0.0181 1 0.8778 0.7426 1 0.7030
AC 0.907 1 0.130 0.0011 1 0.3391 0.0892 1 0.3221 0.6954 1 0.3486 19.124 1 0.5418
AD 0.064 1 0.676 0.0001 1 0.7448 0.2214 1 0.1282 0.3666 1 0.4929 0.6601 1 0.7192
BC 0.578 1 0.221 0.0002 1 0.6778 0.1505 1 0.2038 0.2613 1 0.5617 0.7783 1 0.6963
BD 0.223 1 0.439 0.0005 1 0.5182 0.0122 1 0.7100 0.3028 1 0.5325 141.568 1 0.1068
CD 1.197 1 0.086 0.0001 1 0.7738 0.0001 1 0.9696 23.871 1 0.0940 16.635 1 0.5691
A2 1.172 1 0.089 0.0116 1 0.0066 15.175 1 0.0008 0.1066 1 0.7099 0.8942 1 0.6758
B2 0.009 1 0.874 0.0005 1 0.5044 0.0170 1 0.6610 0.2300 1 0.5859 27.530 1 0.4651
C2 0.086 1 0.628 0.0009 1 0.3915 0.1142 1 0.2649 117.771 1 0.0013 0.5959 1 0.7326
ABD 0.896 1 0.133 0.0083 1 0.0175 0.0226 1 0.6137 0.3240 1 0.5187 – –
ACD 0.346 1 0.338 0.0020 1 0.2031 0.1528 1 0.2006 70.846 1 0.0079 – –
BCD 0.147 1 0.529 0.0004 1 0.5822 0.0566 1 0.4274 0.3270 1 0.5169 – –
A2B – – – – – – – – – 34.180 1 0.0495 – –
A2D 0.003 1 0.931 0.0010 1 0.3568 0.0479 1 0.4645 34.180 1 0.0495 – –
B2D 0.953 1 0.122 0.0016 1 0.2587 0.0021 1 0.8784 0.3133 1 0.5256 – –
C2D 0.570 1 0.223 0.0045 1 0.0672 0.1028 1 0.2892 0.9610 1 0.2734 – –
Lack of fit 3.522 6 0.058 0.0085 6 0.2828 0.3734 6 0.7162 20.427 6 495.597 12 0.7475
Pure error 1.396 8 0.0075 8 0.8123 8 83.086 8 496.984 8
R2 0.815 0.7902 0.7896 0.8490 0.2670
FDt Contrast Correlation IDM Entropy
SS df p-value SS df p-value SS Df p-value SS df p-value SS df p-value
Model 0.0311 13 < 0.0001 760,691.83 13 < 0.001 5.77x10⁻⁷ 13 0.0002 0.0006 13 0.0004 1.0449 13 3.71 × 10⁻⁴
A 0.0126 1 < 0.0001 440,783.29 1 < 0.001 3.16x10⁻⁷ 1 < 0.001 0.0003 1 < 0.001 0.4446 1 < 0.001
B 0.0004 1 0.2241 3557.04 1 0.4760 1.14 × 10⁻⁹ 1 0.6937 2.0 × 10⁻⁵ 1 0.1413 0.0011 1 0.7870
C 0.0008 1 0.1029 244.67 1 0.8508 7.20 × 10⁻⁹ 1 0.3278 1.3 × 10⁻⁶ 1 0.7058 0.0947 1 0.0193
–5 –11
D 2.28 × 10 1 0.7786 416.98 1 0.8061 4.08 × 10 1 0.9406 1.5 × 10⁻⁶ 1 0.6766 0.0001 1 0.9236
AB 4.03 × 10⁻⁶ 1 0.9059 126.59 1 0.8924 1.13 × 10⁻⁹ 1 0.6952 7.0 × 10⁻⁶ 1 0.3775 7. × 10–6 1 0.9827
AC 0.0003 1 0.3045 28,624.14 1 0.0526 4.17 × 10⁻⁹ 1 0.4543 3.2 × 10⁻⁵ 1 0.0685 0.0154 1 0.3172
AD 1.52 × 10⁻⁵ 1 0.8184 318.22 1 0.8302 2.19 × 10⁻¹⁰ 1 0.8629 1.1 × 10⁻⁵ 1 0.2817 0.0068 1 0.5037
BC 4.78 × 10⁻⁵ 1 0.6845 933.75 1 0.7137 4.26 × 10⁻¹⁰ 1 0.8097 2.5 × 10⁻⁶ 1 0.5941 0.0016 1 0.7457
BD 0.0006 1 0.1543 301.61 1 0.8346 1.02 × 10⁻⁸ 1 0.2474 1.4 × 10⁻⁵ 1 0.2164 0.0304 1 0.1652
CD 0.0002 1 0.4586 500.51 1 0.7881 1.20 × 10⁻⁹ 1 0.6867 6.2 × 10⁻⁸ 1 0.9330 0.0301 1 0.1669
A2 0.0138 1 < 0.0001 273,923.46 1 0.0000 2.35 × 10⁻⁷ 1 < 0.0001 0.0002 1 < 0.0001 0.3929 1 < 0.0001
B2 2.1 × 10⁻⁵ 1 0.7890 1598.71 1 0.6316 6.46 × 10⁻¹³ 1 0.9925 1.3 × 10⁻⁶ 1 0.6969 0.0173 1 0.2892
C2 0.0028 1 0.0048 12,319.32 1 0.1915 9.15 × 10⁻¹⁰ 1 0.7244 9.6 × 10⁻⁷ 1 0.7423 0.0016 1 0.7417
ABD – – – – – – – – – – – – – – –
ACD – – – – – – – – – – – – – – –
BCD – – – – – – – – – – – – – – –
A2B – – – – – – – – – – – – – – –
A2D – – – – – – – – – – – – – – –
B2D – – – – – – – – – – – – – – –
C2D – – – – – – – – – – – – – – –
Lack of fit 0.0020 12 0.9433 43,465.57 12 0.9639 2.63 × 10⁻⁸ 12 0.9981 0.0001 12 0.9769 0.1401 12 0.7864
Pure error 0.0036 8 91,366.54 8 1.17 × 10⁻⁷ 8 0.0001 8 0.1526 8
R2 0.8468 0.849 0.8011 0.7776 0.7812
Table 2. ANOVA for the adjusted variables to the Box-Behnken design: moisture, aw, CA, h
ab, ΔE*, FDt,
contrast, correlation, IDM and entropy for flakes of HOPO nanoemulsions.
Scientific Reports | (2021) 11:9359 | https://doi.org/10.1038/s41598-021-88381-7 6
Vol:.(1234567890)www.nature.com/scientificreports/
The samples’ moisture content was only affected by water temperature during drying; this was the variable
directly influencing RW drying’s three most important aspects: heat emission by the drying source (hot water),
propagation of heat by the medium (Mylar polyester film) and the heat absorbed by the product (emulsion).
Zotarelli et al.39 have reported how using Mylar film led to more than 40% transmittance regarding maximum
heat emission (60 °C to 100 °C) by water radiation (10–100 W/m2); such values were more than sufficient for
good heat transfer by radiation between the heat source and the water in the emulsion40. This data suggested the
effectiveness of heat transfer during RW drying.
The forgoing highlighted the fact that moisture content varied from 1.8 to 5.65% for the proposed tem-
perature interval and gave favourable values for RW dried products, as values below 15% prevent antimicrobial
growth, increase a sample’s structural stability and retard deterioration reactions (i.e. sugar crystallisation and
non-enzymatic browning)41.
Water activity. Water activity (aw) is an important parameter which can influence food shelf-life since it
reflects the amount of water available for chemical reactions and microorganism growth (i.e. bacteria, fungi
and yeasts)42. Table 2 gives ANOVA results for water activity (aw) response. The results were fitted to a quadratic
model (0.79 R 2). Table 2 shows that the model was significant (p < 0.05) and had a 0.28 lack of fit, indicating that
the proposed model’s a w provided a suitable fit and could thus fit and predict an evaluable water activity pattern
for flakes from RW-dried nanoemulsions.
Only temperature had a significant impact on water activity pattern (p < 0.05); at higher temperatures, less
water activity. The temperature squared (A2) value also significantly affected aw (p < 0.05); Table S1 of Supple-
mentary file shows the equations describing water activity pattern for each formulation.
This study emphasised the relationship between drying temperature and a w, as increasing the drying tem-
perature led to a reduction in the flakes’ aw; this could have been related to the fact that more water would have
been evaporated at higher temperatures43. However, no mention was found in the pertinent literature of variation
concerning drying temperature and its effect on a w, as most studies compare RW with other drying methods at
a single temperature or vary drying times or sample thickness.
Drying is one of the most efficient methods for conserving food, as reducing a w reduces microbial growth
and decreases the speed of degradation reactions, the latter being of great interest for drying products having
antioxidant activity. Around 0.3 a w values were obtained for the flakes (Table 1) which authors like Pavan et al.24
(whose group has dried açai pulp) have considered a standard value for pulp dried by any method, since water
having higher a w is sufficient to behave like a solvent, thereby increasing the mobility of products used in/avail-
able for degradation r eactions13. Other authors have focused more on the relationship of a w with moisture and
storage temperature which are very important aspects when considering food c onservation12,13,39.
Contact angle. Contact angle is a measurement quantifying a substance’s hydrophilic or hydrophobic
behaviour as an important parameter when analysing surfaces’ interaction with water; a smaller angle measure-
ment indicates hydrophilic behaviour whilst a greater angle indicates a hydrophobic p attern44.
ANOVA was used for ascertaining quadratic fit (Table 2) and square root transformation (Supplementary file
Table S1) of data regarding contact angle (0.78 R 2). Table 2 shows that the model was significant (p < 0.05) and
had 0.72 lack of fit, suggesting the model’s great reliability or describing its pattern and possibly acting as a tool
for analysing the contact angle of RW dried nanoemulsion flakes in similar conditions.
Like aw, temperature (A) and its quadratic relation ( A2) were the variables which significantly affected the
contact angle. Contact angle varied from 15.72° to 31.99° (Table 1); a sample’s lower drying temperature meant a
smaller contact angle whilst formulation A had a slightly more hydrophobic pattern (CA = 24°) than formulation
B (B = 22°), given the same temperature and thickness values. This pattern could have been due to the chemical
nature of gum Arabic (Formulation B) since its structure (consisting of a branched carbohydrate chain (d-glu-
curonic acid, l-rhamnose, d-galactose and l-arabinose) has glycoproteins bound by covalent linkages, making
it a highly hydrophilic m olecule45. Amylose, which makes up 50% of corn starch, consists of glycosidic bonds
producing a simple helix whose interior only consists of hydrogen atoms, thereby giving a lipophilic p attern46. In
the supplementary file Table S1 are shown the equations describing contact angle pattern for both formulations.
Studying contact angles is closely linked to the science of materials and polymers, so studying it in the agri-
food industry has been very limited and (to the best of our knowledge) no research has yet been published on
contact angles on surfaces obtained from RW-dried matrices.
Authors who have researched food area-related contact angles have based their work on studying the proper-
ties of materials’ surfaces in response to contact with liquid foodstuffs (i.e. interfacial interactions). Their useful-
ness as a mechanism for predicting interactions between liquids and solid surfaces (i.e. biofilms, membranes,
heat interchange or packed food surfaces) has been studied by authors like Güleç et al.47. Such authors have
studied the hydrophilicity, hydrophobicity and surface free energy of three different materials used in the food
packaging industry (glass, polyethylene and stainless steel); they studied contact angle variation regarding surface
and interfacial tension to ascertain the effects of packaging surface contaminants on food and microorganism
growth. Other studies have focused more on predicting food packaging surface structure by using mathematical
relationships to modify surfaces to control contact angles and surface e nergy48,49.
Color. Table 2 gives ANOVA results for variables hab and ΔE*. The table shows that even though the lack of fit
was p > 0.05 in all cases, the model did not fit (p > 0.05) variable ΔE* (Table 2, in red), indicating that it might not
accurately predict such flake color parameters. The results for color parameter h 2:0.85
ab fit a quadratic model R
for hab.
Scientific Reports | (2021) 11:9359 | https://doi.org/10.1038/s41598-021-88381-7 7
Vol.:(0123456789)www.nature.com/scientificreports/
L* a* b* hab (°)
Pressure (psi) A B A B A B A B
0 63.4 (0.4) 64.1 (0.6) 15.1 (< 0.01) 14.6 (0.2) 80.3 (1.4) 81.0 (2.3) 79.3 (0.2) 79.8 (0.2)
10,000 68.5 (0.6) 68.7 (0.1) 11.3 (0.2) 11.8 (0.2) 73.8 (1.9) 74.1 (1.5) 81.3 (0.4) 80.9 (< 0.01)
20,000 66.3 (1.3) 66.7 (1.0) 13.5 (2.1) 12.4 (0.4) 80.9 (3.6) 75.6 (3.0) 80.5 (1.0) 80.7 (0.6)
Table 3. Lightness (L*), color coordinate a*, color coordinate b*, and hue (hab), for fresh nanoemulsions of
HOPO. The values in parenthesis are the standard deviations.
Variable hab was significantly affected (p < 0.05, Table 2) by flake thickness, microfluidization pressure and
formulation. Increasing flake thickness significantly reduced (p < 0.05) hab, this could be due to the exposure of the
sample film to the drying temperature; lower thickness values, less layers to receive the heat transfer, which results
in a yellowing of the sample. On the other hand, increasing microfluidization pressure significantly increased
(p < 0.05) hab wich could be due to the organization of the droplets of the sample, that at higher microfluidiza-
tion pressure, lower the droplet size of the emulsion50–54. The same happened for formulation B, hab values were
higher than those for formulation A; in this case, the main difference between formulation A and B was the wall
material (corn starch and gum Arabic, respectively), letting conclude that gum Arabic preserve better the color
of the original food. The flakes h
ab values ranged from 73.24° to 78.80° (Table 1), related to high purity regarding
yellow tonality since such values were close to 90°55.
Table 3 gives the fresh nanoemulsions’ color parameters (L*, a*, b*, h ab). Color difference (ΔE*) values regard-
ing flakes and nanoemulsions before RW drying varied from 3.81 to 13.29 (Table 1), i.e. an obvious color dif-
ference between flakes and fresh nanoemulsion for the human eye (ΔE* > 3)34. Such results showed that the
temperature of RW drying of a nanoemulsion does produce important changes in parameters (L*, a*, b*), also
the pressure of microfluidization which led to encapsulation of the oil, thereby producing high color differences
obtained at lower pressure values and higher temperatures. Such difference may have been due to carotene deg-
radation in palm oil (i.e. natural antioxidants controlling color56 during drying as it has been widely reported
that they are temperature-sensitive (i.e. the higher the temperature, the greater carotene degradation, especially
when 60 °C has been exceeded)57–59.
Scanning electron microscopy (SEM). Figures 2 and 3 show SEM microstructures of flakes from formu-
lations A and B for every drying temperature and microfluidization pressure used in the study; the porous struc-
ture of flakes obtained by drying HOPO nanoemulsions from both formulations was revealed by microstructural
study. Nanoemulsions which were not microfluidized (0 psi) had a less homogeneous structure, having larger
pores which joined together forming large holes; pore size became reduced when increasing microfluidization
pressure. It would thus seem that using higher microfluidization pressure gives more homogeneous microstruc-
ture nanoemulsions, as RW drying results in flakes having a more uniform structure, with smaller sized pores,
since the continuous phase is more homogeneous in the emulsion. Increased nanoemulsion homogeneity related
to decreased particle size when increasing microfluidization pressure has already been r eported19,20.
Image analysis. Table 2 gives ANOVA results for FDt, contrast, correlation, IDM and entropy response. The
2 were 0.85 for FDt and
results for all texture parameters analysed here fit a quadratic model; texture parameters R
contrast, 0.8 for correlation and 0.78 for IDM and entropy. Table 2 shows that the model was significant (p < 0.05)
and had > 0.05 lack of fit, thereby indicating its suitability for predicting the texture parameters which would
be obtained when a nanoemulsion prepared at a specific microfluidisation pressure was dried at a determined
temperature and lamina thickness.
Texture FDt analysis regarding drying temperature and drying temperature squared ( A2) was statistically
significant (p < 0.05) (Table 2). Increased temperature produced a significant reduction (p < 0.05) in the flakes’
FDt for both formulations. Lower FDt values were related to more homogenous and regular surfaces. FDt was
also affected by the microfluidization pressure squared ( C2) used in preparing the nanoemulsion.
The values obtained came within the range reported to date for food surface images60–63. The pertinent lit-
erature states that low FDt values at high drying temperatures could be associated with images having a smooth
fractal texture, while high FDt values could be related to images having rough fractal t exture62. Hernández-
Carrión et al.63 found that Lamuyo red pepper FDt was lower when less structural damage was caused by high
hydrostatic pressure. Such results would explain why lower FDt values were obtained at higher microfluidization
pressures, related to a more homogeneous and regular structure, as can be seen in the microstructure study.
Authors like Aragón-Rojas et al.64 have established a relationship between freeze-dried powders’ FDt and mois-
ture. Such authors have stated that freeze-dried powders have greater surface area exposed to the environment
when their surface is more rugged (higher FDt values) and their moisture will thus be higher. This would explain
the results obtained when analysing the flakes’ moisture, as flakes with higher values of FDt also had the higher
values of moisture content.
Texture contrast, correlation and IDM parameters were significantly affected (p < 0.05) by RW drying tempera-
ture, as well as such variable squared (A2) (Table 2). Increased drying temperature led to a significant reduction
(p < 0.05) in image contrast, whilst producing a significant increase (p < 0.05) in correlation and IDM for both
formulations. Such results indicated that increasing nanoemulsion drying temperature led to a more homogenous
and regular texture of flakes after drying.
Scientific Reports | (2021) 11:9359 | https://doi.org/10.1038/s41598-021-88381-7 8
Vol:.(1234567890)www.nature.com/scientificreports/
Figure 2. Scanning electron microscopy micrographs for flakes of HOPO nanoemulsions elaborated using
formulation A. Magnification: 4000x. The labelling of the imagen (letters A to M) was the order in which SEM
images were took. Processed with ImageJ 1.34 software (https://imagej.nih.gov/ij/notes.html).
A high contrast value indicates a high degree of local variation65,66, this being typical of rougher and more
heterogeneous surfaces. This would explain the higher contrast values for rougher surfaces observed at low drying
temperatures and the lower values for a more homogenous surface at high drying temperatures. It is known that
IDM values indicate the degree of image contrast variation and high IDM values can be associated with homo-
geneous images65, such as images obtained at high drying temperatures. An increase in temperature tended to
increase the IDM which was related to the more homogenous structures observed at high drying temperatures.
Similar results were obtained by Barrera et al.67 when evaluating mechanical damage to wheat starch granules.
They concluded that damaged granule surface had lower IDM values than those for native starch granules, sug-
gesting that the mechanical process decreased IDM. Hernández-Carrión et al.63 evaluated structural damage to
Lamuyo red pepper caused by high hydrostatic pressure treatment and pasteurisation; they found that treatment
causing more structural damage to red pepper tissue had lower IDM values and higher contrast values than those
causing lower structural damage, thereby suggesting that structural damage decrease IDM values and increase
contrast values. The above suggest that drying nanoemulsions at low temperatures could a more heterogeneous
flake structure as the IDM values obtained for these temperatures decreased.
Entropy was significantly affected (p < 0.05) by drying temperature and the microfluidization pressure of
nanoemulsions (Table 2). Increased drying temperature and microfluidization pressure led to a significant reduc-
tion (p < 0.05) of the flakes’ entropy for both formulations. The higher entropy values obtained at low drying
temperature and microfluidization pressure could have been related to their structure’s greater h eterogeneity37
65,67
since more complex images are associated with higher entropy values .
Scientific Reports | (2021) 11:9359 | https://doi.org/10.1038/s41598-021-88381-7 9
Vol.:(0123456789)www.nature.com/scientificreports/
Figure 3. Scanning electron microscopy micrographs for flakes of HOPO nanoemulsions elaborated using
formulation B. Magnification: 4000x. The labelling of the imagen (letters A to M) was the order in which SEM
images were took. Processed with ImageJ 1.34 software (https://imagej.nih.gov/ij/notes.html).
Moisture (%) aw
Temperature (°C) Thickness (mm) Pressure (psi) Formulation Experimental Model Experimental Model
OptA 72.00 1.44 20,000 A 2.85 2.69 0.2937 0.2847
OptB 80.00 2.00 16,237 B 2.08 2.02 0.2766 0.2916
Table 4. Experimental optimum conditions obtained by the Box-Behnken optimization design for moisture
and aw: experimental values vs values of prediction equations.
The lower entropy values found at high drying temperatures and microfluidization pressures could have
omogeneity37,65. Hernández-Carrión et al.63 when evaluating structural
been related to their structures’ greater h
damage to Lamuyo red pepper subjected to high hydrostatic pressure treatment and pasteurization stated that
treatments causing more structural damage to red pepper tissue had higher entropy values than those causing
lower structural damage, suggesting that structural damage increased entropy.
Increased nanoemulsion drying temperature was thus mainly responsible for improving the parameters
regarding image texture as a more homogeneous and regular texture was thereby obtained at higher temperatures.
Scientific Reports | (2021) 11:9359 | https://doi.org/10.1038/s41598-021-88381-7 10
Vol:.(1234567890)www.nature.com/scientificreports/
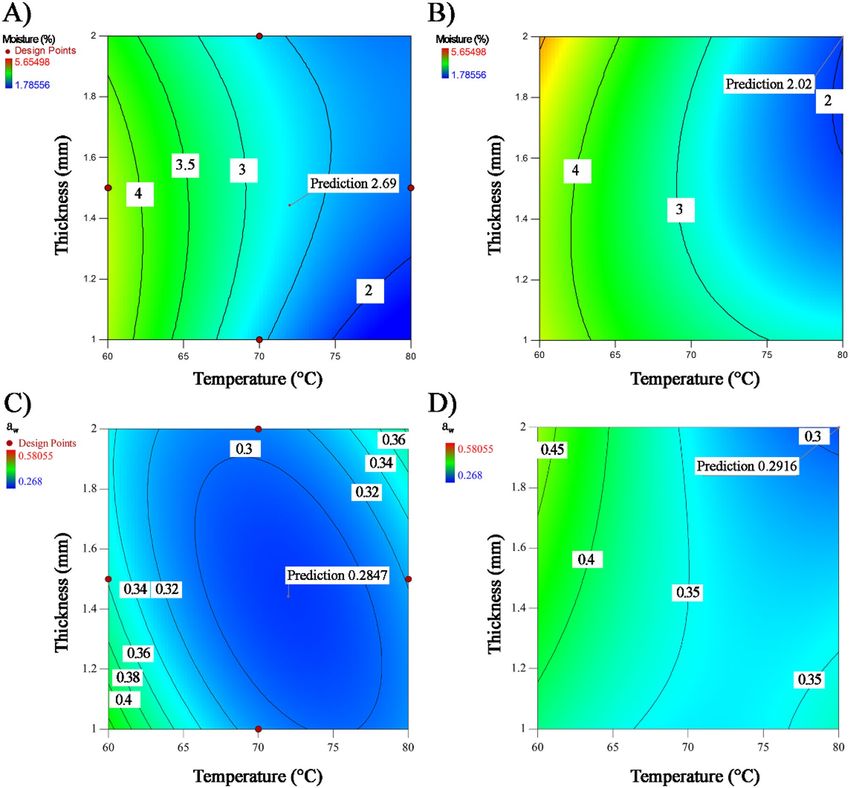
Figure 4. Isoplots for adjusted variables the Box-Behnken optimal design: (A) Moisture content for
Formulation A, (B) Moisture content for Formulation B, (C) water activity for Formulation A, and (D) water
activity for formulation B. Obtained from: Design Expert Software Version 10.1.0 (Stat-Ease Inc., MN, USA,
https://www.statease.com/software/design-expert/ ).
Table S1 of Supplementary file, gives the prediction equations for the texture parameters from the model’s
parameters for formulations A and B.
Optimisation. Table 4 and Fig. 4 show that high drying temperature (72 °C), intermediate thickness
(1.44 mm) and high microfluidization pressure (20,000 psi) must be used for obtaining flakes from nanoemul-
sions made from formulation A having low moisture content of 2.69% and aw of 0.2847. Higher drying tempera-
ture (80 °C), greater thicknesses (2 mm) and lower microfluidization pressure (16,237 psi) would have to be used
with formulation B for ensuring low moisture (2.02%) and aw (0.2916).
High drying temperatures and microfluidization pressures were thus mainly responsible for obtaining flakes
having low moisture and aw; flakes having lower moisture and aw were obtained from nanoemulsions made from
formulation B than formulation A.
It should be stressed that optimal solution desirability was > 92% and moisture and a w experimental values
were very close to those estimated by the model’s prediction equations (Table 4). Maximum error was 5.76%
for optimal nanoemulsion A moisture whilst a 2.70% minimum error was recorded for optimal nanoemulsion
B moisture.
Scientific Reports | (2021) 11:9359 | https://doi.org/10.1038/s41598-021-88381-7 11
Vol.:(0123456789)www.nature.com/scientificreports/
Conclusions
Using response surface methodology for studying the effect of emulsion formulation drying conditions resulted
in mathematical models for predicting the pattern of the variables analysed in this work. These results suggested
that RW drying, and microfluidization as a nanoencapsulation technique of high-oleic palm oil, could lead to
producing dried products in the form of flakes, however, it causes an effect in the color of the emulsion which
could be perceived by the human eye. In this case, they were formulated with biopolymers such as corn starch
and gum arabic, having high oil content, allowing optimum physical properties represented in lower moisture
content and lower water activity, mostly affected by the pressure of microfluidization and drying temperature.
For the best of our knowledge, this is the first article that analyses the microstructure of flakes containing oil
using RW, that was affected only by the drying temperature. These results provide evidence of new ways of dried
structures with high oil contents different from powders. This paper shows the importance of develop technolo-
gies and processes that enhance products and allow the addition of compounds at cheaper prices than those that
can be offered by technologies such as freeze-drying.
Received: 13 July 2020; Accepted: 8 February 2021
References
1. Joye, I. J., Davidov-Pardo, G. & McClements, D. J. Nanotechnology for increased micronutrient bioavailability. Trends Food Sci.
Technol. 40(2), 168–182 (2014).
2. Fioramonti, S. A., Rubiolo, A. C. & Santiago, L. G. Characterisation of freeze-dried flaxseed oil microcapsules obtained by multilayer
emulsions. Powder Technol. 319, 238–244 (2017).
3. Pan, H., Yu, L., Xu, J. & Sun, D. Preparation of highly stable concentrated W/O nanoemulsions by PIC method at elevated tem-
perature. Colloids Surf. A Physicochem. Eng. Asp. 447, 97–102 (2014).
4. Gupta, A., Eral, H. B., Hatton, T. A. & Doyle, P. S. Nanoemulsions: Formation, properties and applications. Soft Matter 12(11),
2826–2841 (2016).
5. Choi, A.-J., Kim, C.-J., Cho, Y.-J., Hwang, J.-K. & Kim, C.-T. Characterization of capsaicin-loaded nanoemulsions stabilized with
alginate and chitosan by self-assembly. Food Bioprocess. Technol. 4(6), 1119–1126 (2011).
6. Donsì, F., Sessa, M. & Ferrari, G. Effect of emulsifier type and disruption chamber geometry on the fabrication of food nanoemul-
sions by high pressure homogenization. Ind. Eng. Chem. Res. 51(22), 7606–7618 (2012).
7. Ricaurte, L., de Jesús Perea-Flores, M., Martinez, A. & Quintanilla-Carvajal, M. X. Production of high-oleic palm oil nanoemul-
sions by high-shear homogenization (microfluidization). Innov. Food Sci. Emerg. Technol. 35, 75–85 (2016).
8. Lee, L. & Norton, I. T. Comparing droplet breakup for a high-pressure valve homogeniser and a microfluidizer for the potential
production of food-grade nanoemulsions. J. Food Eng. 114(2), 158–163 (2013).
9. Shen, L. & Tang, C.-H. Microfluidization as a potential technique to modify surface properties of soy protein isolate. Food Res. Int.
48(1), 108–118 (2012).
10. Wilking, J. N., Chang, C. B., Fryd, M. M., Porcar, L. & Mason, T. G. Shear-induced disruption of dense nanoemulsion gels. Langmuir
27(9), 5204–5210 (2011).
11. Nindo, C. I., Tang, J., Powers, J. R. & Takhar, P. S. Rheological properties of blueberry puree for processing applications. LWT Food
Sci. Technol. 40(2), 292–299 (2007).
12. Celli, G. B., Khattab, R., Ghanem, A. & Brooks, M.S.-L. Refractance Window drying of haskap berry—Preliminary results on
anthocyanin retention and physicochemical properties. Food Chem. 194, 218–221 (2016).
13. Ortiz-Jerez, M. J., Gulati, T., Datta, A. K. & Ochoa-Martínez, C. I. Quantitative understanding of refractance window drying. Food
Bioprod. Process. 95, 237–253 (2015).
14. Caparino, O. A. et al. Effect of drying methods on the physical properties and microstructures of mango (Philippine ‘Carabao’
var.) powder. J. Food Eng. 111(1), 135–148 (2012).
15. Sun, D. W. Computer Vision Technology for Food Quality Evaluation 2nd edn. (Academic Press, 2016).
16. García-Armenta, E. et al. Multifractal breakage patterns of thick maltodextrin agglomerates. Powder Technol. 266, 440–446 (2014).
17. Khan, A., Munir, M. T., Yu, W. & Young, B. R. A review towards hyperspectral imaging for real-time quality control of food products
with an illustrative case study of milk powder production. Food Bioprocess Technol. 13, 739–752 (2020).
18. Haralick, R. M., Shanmugam, K. & Dinstein, I. Textural features for image classification. IEEE Trans. Syst. Man Cybern. SMC-3(6),
610–621 (1973).
19. Ricaurte, L., Perea-Flores, M. D. J., Martinez, A. & Quintanilla-Carvajal, M. X. Production of high-oleic palm oil nanoemulsions
by high-shear homogenization (microfluidization). Innov. Food Sci. Emerg. Technol. 35, 75–85 (2016).
20. Salvia-Trujillo, L., Rojas-Graü, M. A., Soliva-Fortuny, R. & Martín-Belloso, O. Effect of processing parameters on physicochemical
characteristics of microfluidized lemongrass essential oil-alginate nanoemulsions. Food Hydrocoll. 30(1), 401–407 (2013).
21. Sadeghpour Galooyak, S. & Dabir, B. Three-factor response surface optimization of nano-emulsion formation using a microfluid-
izer. J. Food Sci. Technol. 52(5), 2558–2571 (2015).
22. Bai, L., Huan, S., Gu, J. & McClements, D. J. Fabrication of oil-in-water nanoemulsions by dual-channel microfluidization using
natural emulsifiers: Saponins, phospholipids, proteins, and polysaccharides. Food Hydrocoll. 61, 703–711 (2016).
23. Topuz, A., Dincer, C., Özdemir, K. S., Feng, H. & Kushad, M. Influence of different drying methods on carotenoids and capsaici-
noids of paprika (Cv., Jalapeno). Food Chem. 129(3), 860–865 (2011).
24. Pavan, M. A., Schmidt, S. J. & Feng, H. Water sorption behavior and thermal analysis of freeze-dried, Refractance Window-dried
and hot-air dried açaí (Euterpe oleracea Martius) juice. LWT Food Sci. Technol. 48(1), 75–81 (2012).
25. Minjares-Fuentes, R. et al. Effect of different drying procedures on physicochemical properties and flow behavior of Aloe vera
(Aloe barbadensis Miller) gel. LWT Food Sci. Technol. 74, 378–386 (2016).
26. Minjares-Fuentes, R. et al. Effect of different drying procedures on the bioactive polysaccharide acemannan from Aloe vera (Aloe
barbadensis Miller). Carbohyd. Polym. 168, 327–336 (2017).
27. Tontul, I. & Topuz, A. Effects of different drying methods on the physicochemical properties of pomegranate leather (pestil). LWT
Food Sci. Technol. 80, 294–303 (2017).
28. Hernández-Carrión, M., Moyano, M. & Quintanilla-Carvajal, M. X. Design of high-oleic palm oil nanoemulsions suitable for
drying in refractance window. J. Food Process. Preserv. 45, e15076 (2020).
29. Quintanilla-Carvajal, M. X. et al. Effects of microfluidisation process on the amounts and distribution of encapsulated and non-
encapsulated α-tocopherol microcapsules obtained by spray drying. Food Res. Int. 63, 2–8 (2014).
30. Nindo, C. I., Sun, T., Wang, S. W., Tang, J. & Powers, J. R. Evaluation of drying technologies for retention of physical quality and
antioxidants in asparagus (Asparagus officinalis, L.). LWT Food Sci. Technol. 36(5), 507–516 (2003).
Scientific Reports | (2021) 11:9359 | https://doi.org/10.1038/s41598-021-88381-7 12
Vol:.(1234567890)www.nature.com/scientificreports/
31. FDA. Inspection technical guides. Water activity (aw) in foods. 2014. On line. https://www.fda.gov/inspections-compliance-enfor
cement-and-criminal-investigations/inspection-technical-guides/water-activity-aw-foods
32. Haas, K. et al. Impact of powder particle structure on the oxidation stability and color of encapsulated crystalline and emulsified
carotenoids in carrot concentrate powders. J. Food Eng. 263, 398–408 (2019).
33. Francis, F. J. & Clydesdale, F. M. Food Colorimetry: Theory and Applications (AVI Publishing Co., Inc., 1975).
34. Bodart, M., de Peñaranda, R., Deneyer, A. & Flamant, G. Photometry and colorimetry characterisation of materials in daylighting
evaluation tools. Build. Environ. 43(12), 2046–2058 (2008).
35. Chen, W., Yuan, S., Hsiao, H. & Hsieh. C. Algorithms to estimating fractal dimension of texture images. In IEEE International
Conference on Acoustics, Speech and Signal Processing, Hong Kong (China) (2001).
36. Laddi, A., Sharma, S., Kumar, A. & Kapur, P. Classification of tea grains based upon image texture feature analysis under different
illumination conditions. J. Food Eng. 115(2), 226–231 (2013).
37. Yang, X., Beyenal, H., Harkin, G. & Lewandowski, Z. Quantifying biofilm structure using image analysis. J. Microbiol. Methods
39(2), 109–119 (2000).
38. Gonzalez, R. C., Woods, R. E. & Eddins, S. L. Digital image processing using MATLAB (Prentice Hall, 2003).
39. Zotarelli, M. F., Carciofi, B. A. M. & Laurindo, J. B. Effect of process variables on the drying rate of mango pulp by Refractance
Window. Food Res. Int. 69(Supplement C), 410–417 (2015).
40. Bergman, T. L. & Incropera, F. P. Fundamentals of Heat and Mass Transfer (John Wiley & Sons, 2011).
41. Tontul, İ & Topuz, A. Spray-drying of fruit and vegetable juices: Effect of drying conditions on the product yield and physical
properties. Trends Food Sci. Technol. 63(Supplement C), 91–102 (2017).
42. Sagona, S. et al. Water activity of fresh bee pollen and mixtures of bee pollen-honey of different botanical origin. LWT Food Sci.
Technol. 84, 595–600 (2017).
43. Tontul, İ, Kasimoglu, Z., Asik, S., Atbakan, T. & Topuz, A. Functional properties of chickpea protein isolates dried by refractance
window drying. Int. J. Biol. Macromol. 109, 1253–1259 (2017).
44. Neira-Arenas, G. & Cañas, L. A. Procedure to measure contact angles in fine divided solids. Scientia et Technica 36, 833–838 (2007).
45. Tupuna, D. S. et al. Encapsulation efficiency and thermal stability of norbixin microencapsulated by spray-drying using different
combinations of wall materials. Ind. Crops Prod. 111, 846–855 (2018).
46. Kong, L., Bhosale, R. & Ziegler, G. R. Encapsulation and stabilization of β-carotene by amylose inclusion complexes. Food Res. Int.
105, 446–452 (2018).
47. Güleç, H. A., Sarıoglu, K. & Mutlu, M. Modification of food contacting surfaces by plasma polymerisation technique. Part I:
Determination of hydrophilicity, hydrophobicity and surface free energy by contact angle method. J. Food Eng. 75(2), 187–195
(2006).
48. Erbil, H. Y. The debate on the dependence of apparent contact angles on drop contact area or three-phase contact line: A review.
Surf. Sci. Rep. 69(4), 325–365 (2014).
49. Ng, F., Bonnet, L., David, G. & Caillol, S. Novel biobased and food contact epoxy coatings for glass toughening applications. Prog.
Org. Coat. 109(Supplement C), 1–8 (2017).
50. Abonyi, B. I. et al. Quality retention in strawberry and carrot purees dried with refractance window system. J. Food Sci. 67(3),
1051–1056 (2002).
51. Subhashree, S. N., Sunoj, S., Xue, J. & Bora, G. C. Quantification of browning in apples using colour and textural features by image
analysis. Food Qual. Saf. 1(3), 221–226 (2017).
52. Betoret, E., Betoret, N., Carbonell, J. & Fito, P. Effects of pressure homogenization on particle size and the functional properties
of citrus juices. J. Food Eng. 92(1), 18–23 (2009).
53. Valencia Flores, D. C. Aplicación de la ultra alta presión de homogenización (UHPH) en la elaboración de licuados vegetales de
almendra de alta calidad. In Departament de Ciència Animal i dels Aliments. 162. (Universitat Autònoma de Barcelona, 2015).
54. Ochoa-Martínez, C. I., Quintero, P. T., Ayala, A. A. & Ortiz, M. J. Drying characteristics of mango slices using the Refractance
Window technique. J. Food Eng. 109(1), 69–75 (2012).
55. Tuberoso, C. I. et al. Color evaluation of seventeen European unifloral honey types by means of spectrophotometrically determined
CIE L*Cab*h(ab) degrees chromaticity coordinates. Food Chem. 145, 284–291 (2014).
56. Meirelles, A. J. Development of a new refining process to maintain carotenes in edible palm oil. Revista Palmas 31(Special), 141–152
(2010).
57. Topuz, A., Feng, H. & Kushad, M. The effect of drying method and storage on color characteristics of paprika. LWT Food Sci.
Technol. 42(10), 1667–1673 (2009).
58. Hiranvarachat, B., Devahastin, S. & Chiewchan, N. Effects of acid pretreatments on some physicochemical properties of carrot
undergoing hot air drying. Food Bioprod. Process. 89(2), 116–127 (2011).
59. Demiray, E. & Tulek, Y. Color degradation kinetics of carrot (Daucus carota L.) slices during hot air drying. J. Food Process. Pres.
39(6), 800–805 (2015).
60. Gonzales-Barron, U. & Butler, F. Fractal texture analysis of bread crumb digital images. Eur. Food Res. Technol. 226(4), 721–729
(2008).
61. Pérez-Nieto, A. et al. Image analysis of structural changes in dough during baking. LWT Food Sci. Technol. 43(3), 535–543 (2010).
62. Flores-Andrade, E. et al. Fractal surface analysis and thermodynamic properties of moisture sorption of calcium–sucrose powders.
Dry. Technol. 36, 1–14 (2017).
63. Hernández-Carrión, M., Hernando, I., Sotelo-Díaz, I., Quintanilla-Carvajal, M. X. & Quiles, A. Use of image analysis to evaluate
the effect of high hydrostatic pressure and pasteurization as preservation treatments on the microstructure of red sweet pepper.
Innov. Food Sci. Emerg. 27(Supplement C), 69–78 (2015).
64. Aragón-Rojas, S., Ruiz-Pardo, R. Y., Hernández-Álvarez, A. J. & Quintanilla-Carvajal, M. X. Sublimation conditions as critical
factors during freeze-dried probiotic powder production. Dry. Technol. 38, 333–349 (2020).
65. Mendoza, F., Dejmek, P. & Aguilera, J. M. Colour and image texture analysis in classification of commercial potato chips. Food
Res. Int. 40(9), 1146–1154 (2007).
66. Park, B. & Chen, Y. R. AE—Automation and emerging technologies: Co-occurrence matrix texture features of multi-spectral
images on poultry carcasses. J. Agric. Eng. Res. 78(2), 127–139 (2001).
67. Barrera, G. N. et al. Evaluation of the mechanical damage on wheat starch granules by SEM, ESEM, AFM and texture image analysis.
Carbohydr. Polym. 98(2), 1449–1457 (2013).
Acknowledgements
The authors wish to acknowledge to Banco de Desarrollo de América Latina (CAF) for the support to this
research and to the Universidad de La Sabana for its help in this investigation through the funding of the ING-
170-2016 project. Moreover, the authors thank to Cenipalma (Colombia) for kindly supplying the High Oleic
Palm Oil used in this study and to Alexandra Mondragón Serna, Leader of the project of Health and Nutrition
of Cenipalma.
Scientific Reports | (2021) 11:9359 | https://doi.org/10.1038/s41598-021-88381-7 13
Vol.:(0123456789)www.nature.com/scientificreports/
Author contributions
M.H.C. and M.M.M. were involved in the development of experimental work in the laboratory, calculations,
and in the manuscript writing, correcting and editing. L.R. and A.C.R. were involved in the manuscript writing.
M.X.Q.C. conceived the project and the study hypothesis and was involved in the manuscript correcting. All
authors read and approved the final manuscript.
Competing interests
The authors declare no competing interests.
Additional information
Supplementary Information The online version contains supplementary material available at https://doi.org/
10.1038/s41598-021-88381-7.
Correspondence and requests for materials should be addressed to M.X.Q.-C.
Reprints and permissions information is available at www.nature.com/reprints.
Publisher’s note Springer Nature remains neutral with regard to jurisdictional claims in published maps and
institutional affiliations.
Open Access This article is licensed under a Creative Commons Attribution 4.0 International
License, which permits use, sharing, adaptation, distribution and reproduction in any medium or
format, as long as you give appropriate credit to the original author(s) and the source, provide a link to the
Creative Commons licence, and indicate if changes were made. The images or other third party material in this
article are included in the article’s Creative Commons licence, unless indicated otherwise in a credit line to the
material. If material is not included in the article’s Creative Commons licence and your intended use is not
permitted by statutory regulation or exceeds the permitted use, you will need to obtain permission directly from
the copyright holder. To view a copy of this licence, visit http://creativecommons.org/licenses/by/4.0/.
© The Author(s) 2021
Scientific Reports | (2021) 11:9359 | https://doi.org/10.1038/s41598-021-88381-7 14
Vol:.(1234567890)You can also read