SEGMENTATION OF COMMON AND INTERNAL CAROTID ARTERIES FROM 3D ULTRASOUND IMAGES USING ADAPTIVE TRIPLE U-NET
←
→
Page content transcription
If your browser does not render page correctly, please read the page content below
S EGMENTATION OF COMMON AND INTERNAL CAROTID
                                              ARTERIES FROM 3D ULTRASOUND IMAGES USING ADAPTIVE
                                                                 TRIPLE U-N ET

                                                                  Mingjie Jiang                                         Yuan Zhao
arXiv:2101.11252v2 [eess.IV] 28 Jan 2021

                                                        Department of Electrical Engineering                Department of Electrical Engineering
                                                           City University of Hong Kong                        City University of Hong Kong
                                                                    Hong Kong                                           Hong Kong

                                                                                           Bernard Chiu
                                                                                 Department of Electrical Engineering
                                                                                    City University of Hong Kong
                                                                                             Hong Kong
                                                                                      bcychiu@cityu.edu.hk

                                                                                           January 29, 2021

                                                                                               A BSTRACT

                                                   Objective: Vessel-wall-volume (VWV) and localized vessel-wall-thickness (VWT) measured from
                                                   3D ultrasound (US) carotid images are sensitive to anti-atherosclerotic effects of medical/dietary
                                                   treatments. VWV and VWT measurements require the lumen-intima (LIB) and media-adventitia
                                                   boundaries (MAB) at the common and internal carotid arteries (CCA and ICA). However, most
                                                   existing segmentation techniques were capable of automating only CCA segmentation. An approach
                                                   capable of segmenting the MAB and LIB from the CCA and ICA was required to accelerate VWV
                                                   and VWT quantification.
                                                   Methods: Segmentation for CCA and ICA were performed independently using the proposed two-
                                                   channel U-Net, which was driven by a novel loss function known as the adaptive triple Dice loss
                                                   (ADTL). A test-time augmentation (TTA) approach is used, in which segmentation was performed
                                                   three times based on axial images and its flipped versions; the final segmentation was generated by
                                                   pixel-wise majority voting.
                                                   Results: Experiments involving 224 3DUS volumes produce a Dice-similarity-coefficient (DSC) of
                                                   95.1%±4.1% and 91.6%±6.6% for the MAB and LIB, in the CCA, respectively, and 94.2%±3.3%
                                                   and 89.0%±8.1% for the MAB and LIB, in the ICA, respectively. TTA and ATDL independently
                                                   contributed to a statistically significant improvement to all boundaries except the LIB in ICA. The
                                                   total time required to segment the entire 3DUS volume (CCA+ICA) is 1.4s.
                                                   Conclusion: The proposed two-channel U-Net with ADTL and TTA can segment the CCA and ICA
                                                   accurately and efficiently from the 3DUS volume.
                                                   Significance: Our approach has the potential to accelerate the transition of 3DUS measurements of
                                                   carotid atherosclerosis to clinical research.

                                           Keywords Three-dimensional ultrasound, carotid segmentation, convolutional neural network, adaptive triple Dice
                                           loss (ATDL)
A PREPRINT - JANUARY 29, 2021

1   Introduction
Stroke is the leading cause of death in China and the second global leading cause of death [1, 2], and the prevalence
of stroke has been increased by about 200% from 1993 to 2013 [2]. Ischemic strokes account for 87% of all strokes
[3]. This type of stroke is mostly caused by the blockage of a cerebral artery by an embolus. Carotid atherosclerosis
is a major source of emboli, which are composed of platelet aggregates and plaque debris arising from plaque rupture.
Management of atherosclerosis in high-risk population through dietary and medical therapies can reduce stroke risk
by up to 80% [4]. Therefore, there is a critical need in developing sensitive and reproducible biomarkers for the
identification of high-risk patients and monitoring plaque response to therapies.
Carotid intima-media thickness (IMT) measured from the common carotid arteries (CCA) imaged by 2D ultrasound
(2DUS) is an early imaging biomarker that was shown to correlate with clinical outcomes [5, 6]. However, recent
investigations show that it is not a strong cardiovascular event predictor [7] and not sensitive to treatment effect [8, 9].
These weaknesses of IMT are attributable to several factors: (1) the small annual change of IMT (∼0.015mm) does not
allow the measurement of treatment effect in a clinically affordable time frame [10]; (2) IMT measures vascular wall
thickening, which is not directly related to atherosclerosis [11]; (3) 2DUS requires an operator to locate an imaging
plane to be scanned, making IMT measurement difficult to reproduce even for the same operator [12] These issues are
addressed by the development of 3D ultrasound (3DUS) imaging. As plaques grow/regress circumferentially as well
as longitudinally and in thickness, the total plaque volume (TPV) and vessel wall volume (VWV) measured from 3D
were shown to be more sensitive to treatment effect in several studies [13, 14]. As carotid atherosclerosis is a focal
disease, the evolution of the size and stability of plaques is affected by their locations in the artery [15]. Our group
has developed a methodology to measure the vessel-wall-plus-plaque thickness (VWT) on a point-by-point basis [16]
and introduced metrics to quantify the VWT distributions [9, 17, 18]. A VWT-based metric we introduced led to
70% reduction in the sample size required to show treatment effect compared to VWV [9]. These measurements
require the segmentation of the media-adventitia (MAB) and lumen-intima (LIB) from the 3DUS image. Although
these boundaries can be segmented manual as in previous clinical studies [13, 19, 9], manual segmentation is time-
consuming [20], creating a bottleneck that limits the clinical utility of the 3DUS measurements.
Table 1 lists previous algorithms introduced for segmenting MAB and LIB from ultrasound images. Yang et al. [21]
used the active shape model to perform CCA segmentation from 3DUS. Their method required manual intervention
to locate nine landmark points on the contour of MAB and LIB on a slice-by-slice basis and this process is time-
consuming. Ukwatta et al. [22] proposed a sparse level set algorithm to delineate the MAB and LIB of CCA from
3DUS. This approach requires around 2 minutes for a user to initialize the algorithm; this is an improvement compared
to their earlier slice-based model, which takes around 9 minutes to initialize [23]. Hossain et al. [24] proposed a
stopping criterion for a level-set algorithm to segment MAB and LIB of common, internal and external carotid arteries.
Their method required around 14 mins for a user to initialize the algorithm. The requirement of human interaction also
leads to observer variability, which has been demonstrated in Chiu et al. [25] for the arteries segmented in Ukwatta et
al. [23].

                           Paper               Year    ROI          Carotid          # of subjects in total
                   Ukwatta et al. [23]        2011      Y            CCA                      21
                    Yang et al. [21]          2013      Y            CCA                      17
                   Ukwatta et al. [22]        2013      Y            CCA                      21
                 Menchón-Lara et al. [26]     2014      Y            CCA                      30
                   Hossain et al. [24]        2015      Y        CCA&ICA&ECA                  10
                  Azzopardi et al. [27]       2017      Y            CCA                       5
                    Zhou et al. [28]          2019      Y            CCA                      38
                    Zhou et al. [20]          2020      Y            CCA                     1007
                  Azzopardi et al. [29]       2020      N            CCA                      15

Table 1: Previous published papers on ultrasound carotid segmentation. Y and N stand for yes and no respectively.
CCA, ICA and ECA stand for the common, internal and external carotid arteries.

Deep learning algorithms have been introduced to reduce user interaction in the segmentation process. Menchón-
Lara et al. [26] used the autoencoder and multi-layer perceptron (MLP) to detect the media-adventitia (MAB) and
the lumen-intima boundaries (LIB) from 2D longitudinal ultrasound images with an ROI covering the CCA cropped
manually. They applied an MLP classifier to patches centering at each pixel to be segmented. This method is limited
in computational efficiency due to the use of patch-by-patch classification. Azzopardi et al. [30] developed a small

                                                             2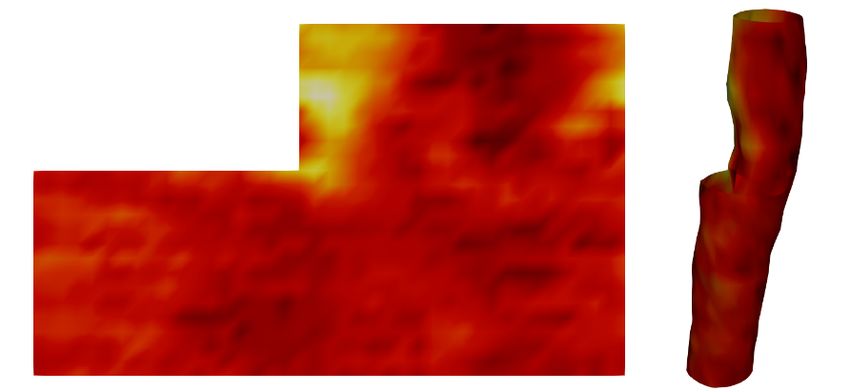
A PREPRINT - JANUARY 29, 2021

U-Net-like convolutional neural network (CNN) to segment LIB and MAB using axial carotid images and the cor-
responding phase congruency maps. A limitation of this work is that the segmentation performance was evaluated
only on five subjects. Besides, the computation of the phase congruency maps would slow down the segmentation
procedure and may introduce noise into the network. The algorithm was later improved by adding the geometrically
constrained terms in the loss function [29]. These terms were shown to provide higher segmentation accuracy using
leave-one-out cross-validation. However, it is questionable whether the algorithm should be evaluated by leave-one-
out cross-validation. First, clinical applications could not afford a leave-one-out workflow that repeats the training
procedure for each artery. Second, as each trained model was tested only on one artery, it is uncertain whether the
trained model with the geometrically constrained terms can generalize to provide accurate segmentation for arteries
with different shapes. Zhou et al. [28] proposed a semi-automatic framework based on dynamic convolutional network
and U-Net to segment MAB and LIB of the CCA and their method required extensive user-interaction to initialize the
MAB contour. The initialization process takes 13.8 s for each artery and introduces observer variability. The same
group [20] proposed another CCA segmentation network that integrates (1) a 3D pyramid pooling module expanded
from pyramid pooling module (PPM) [31] and (2) an attention mechanism to select features from the multiple upsam-
pling paths. The results generated by the network was further smoothed by the continuous max-flow (CMF) algorithm.
This method required the manual cropping of a region-of-interest (ROI), and therefore, is not fully automatic.
Most methods introduced above requires manual identification of an ROI before the MAB and LIB segmentation. The
first contribution of this work is the introduction of a CNN that does not require manual ROI identification for CCA
segmentation. The proposed CCA segmentation network would save time required for ROI identification in a large
clinical trial (for example, 7345 patients were followed in the stroke prevention clinic that provided images for this
study [32]). Another motivation for this work stems from the lack of automated methods to segment the internal carotid
artery (ICA) from 3DUS images. VWV and VWT measurements and metrics derived from local characterization of
VWT-Change from the carotid template [18, 9, 13, 33, 34] were shown to be sensitive in detecting effects of medical
or dietary treatments in a short period of followup time and provide accurate stroke risk stratification. These 3DUS
carotid measurements were made on a longitudinal coverage that incorporates the CCA and ICA. Measurements made
only on CCA would be less useful as carotid plaques are much more prevalent in ICA than in CCA (the Northern
Manhattan Study [35] reported that 52% of subjects had plaques in the ICA or the bifurcation, but only 4.3% of
subjects had plaques in the CCA). Although 3DUS measurements and metrics derived from the local characterization
of VWT-Change from the carotid template [18, 9, 13] were useful in treatment evaluation and risk stratification, these
measurements have not gained widespread clinical acceptance. The major bottleneck in the workflow of VWV and
VWT measurements is the requirement of manual segmentation of the MAB and LIB in the CCA and ICA. The
second contribution addresses this issue by introducing a network that segments ICA with minimal user inputs. The
third contribution is the introduction of the adaptive triple Dice loss function (ATDL) that involves three terms that
characterize the Dice coefficients of the MAB, LIB and vessel wall (i.e., the region between the MAB and LIB).
The triple Dice loss function (TDL) was first proposed for segmenting black-blood carotid MR images [36]. Our
loss function differs in that the weights of the terms associated with MAB, LIB and the vessel wall were adaptively
determined. Dice coefficients of the MAB and LIB are typically larger than that of the vessel wall, as the vessel wall
area (and therefore, the area overlap) is much smaller than the areas covered by the MAB and LIB. The proposed loss
function weighting method put a larger weight on the loss function term associated with the vessel wall adaptively and
improved the segmentation performance.
We demonstrate that the point-wise VWT on the CCA and ICA can be measured from the MAB and LIB segmented
by the proposed algorithm. The distribution of VWT throughout the artery can be visualized on the carotid template
previously described [37] and VWT-based metrics sensitive to treatment effect, such as weighted VWT average of
a subject introduced in [9], can be computed directly from the carotid template. The proposed carotid segmentation
framework substantially accelerates the workflow for VWV and VWT measurements, thereby promoting the clinical
utility of 3D ultrasound measurements of carotid atherosclerosis.

2     Materials and Methods
2.1   Image acquisition and preprocessing

Subjects with diabetic nephropathy were recruited for the Diabetic Intervention with Vitamin to Improve Nephropathy
(DIVINe) trial. They provided written informed consent to the study protocol as described previously [38]. A total
of 224 3DUS volumes from 56 subjects acquired at baseline and a follow-up session for both carotid arteries were
available for training, validating and testing the proposed algorithm. High-resolution 3DUS images were obtained by
translating an ultrasound tranducer (L12-5, Philips, Bothel, WA, USA) mounted on a mechanical assembly along the
neck of the subjects for approximately 4 cm. The 2D ultrasound frames from the ultrasound machine (ATL HDI 5000,
Philips, Bothel, WA, USA) were captured by a frame grabber and reconstructed into a 3D image.

                                                          3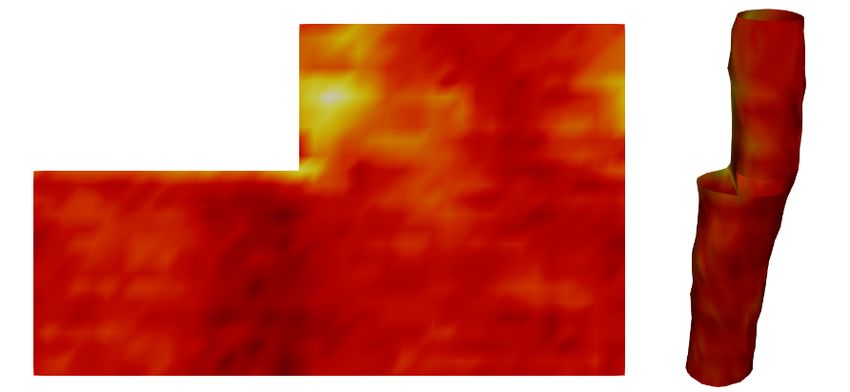
A PREPRINT - JANUARY 29, 2021

Manual segmentation of the carotid arteries was used as the surrogate ground truth to train and evaluate the proposed
algorithm. The CCA and ICA were manually segmented on axial planes with an interslice distance of 1 mm, as
previously described [39]. The CCA was segmented for 15 mm proximal to the bifurcation and the ICA was segmented
for 10 mm distal to the bifurcation.
No manual interaction was required for identifying ROI for CCA segmentation. For ICA segmentation, a bounding
box was required to be identified on two ICA axial slices in the 3DUS volume: the axial slices that are closest and
furthest from the bifurcation. The rectangular ROI was defined by two manually identified landmarks at the two
diagonally opposite corner of the rectangle. An ROI was automatically generated for each ICA image slice in between
by linear interpolation. The bounding boxes identified for the slices closest and furthest from the bifurcation were
expanded by 20 pixels before this linear interpolation to ensure that the interpolated bounding boxes enclose the ICA.
As the CNN requires images of the same size to be fed in as batches, all axial slices were resliced to 256 × 320 pixels.
The intensities of input images were normalized to [0, 1] by linear scaling.

2.2   Network architecture

Fig. 1 shows the architecture of the proposed two-channel network. The outputs in the two channels represent the
probabilities that each pixel is enclosed by the MAB and LIB, respectively. The probability of each pixel being
enclosed by the vessel wall was obtained by first subtracting the LIB from the MAB output channel. The result was
then fed into a rectified linear unit (ReLU) (x 7→ max(x, 0)). The two-channel structure is associated with two major
advantages. First, since the LIB is inside MAB, it is anticipated that features required to localize these two boundaries
are similar and complementary. An integrated encoder for the two-channel input is more appropriate in this setting.
Second, simultaneous segmentation of MAB and LIB by the two-channel structure is more efficient than using two
independent models to perform MAB and LIB segmentations. We will compare the segmentation performance of this
two-channel structure with that of the two independent U-Nets for MAB and LIB segmentations.
The U-Net in this paper employs 2D convolution of kernel size 3 × 3 with stride 1, and uses 2D transpose convolution
of kernel size 2 × 2 with stride 2, and utilizes 2D max pooling of kernel size 2 × 2 with stride 2. The activation function
of the output layer is the sigmoid function (x 7→ 1+e1−x ) and we use ReLU as activation function for other layers. In
addition, batch normalization [40] is placed between the convolution and activation function.

Figure 1: The architecture of the proposed two-channel CNN. The number at the bottom of each block denotes the size
of the tensor. The following labels are used in the legend: Conv – Convolution, MaxPool – Maxpooling, BN – Batch
normalization, ReLU – Rectified linear unit, Concat – concatenation of two tensors, Sigmoid – sigmoid function.

2.3   Loss function

We propose the adaptive triple Dice loss (ATDL), which is based on the triple Dice loss (TDL) [36] but assigns weights
of the three Dice losses adaptively. The triple Dice loss is designed to minimize the difference between ybMAB , ybLIB ,

                                                            4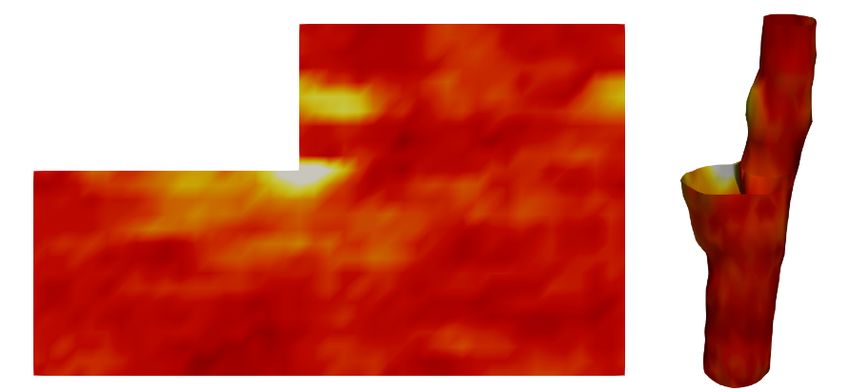
A PREPRINT - JANUARY 29, 2021

ybwall and their corresponding ground truth simultaneously, and TDL is defined as follows:
                                      L = αLDSC (b
                                                 yMAB , yMAB ) + βLDSC (b
                                                                        yLIB , yLIB )
                                        + γLDSC (b
                                                 yCVW , yCVW ),
where yMAB , yLIB , yCVW are binary images denoting whether each pixel is enclosed by the manually segmented MAB,
LIB and the vessel wall boundary (CVW), respectively, with yCVW = yMAB \yLIB . ybMAB , ybLIB , ybCVW represent the
probabililty of each pixel being enclosed by the MAB, LIB and CVW, respectively, as determined by the algorithm.
                                                                                                                y|
α, β and γ are the hyperparameters used to balance the importance of three Dice losses. LDSC (y, yb) = 1 − 2|y×by| ,
                                                                                                             |y+b
where + and × represent pixel-by-pixel addition and multiplication, respectively. α + β + γ = 1. TDL assigns the
same weight to the three Dice losses (i.e., α = β = γ = 31 ).
LDSC (byCVW , yCVW ) is larger than LDSC (b
                                          yMAB , yMAB ) and LDSC (byLIB , yLIB ) because the vessel wall area is much smaller
than the areas covered by MAB and LIB. In the course of the training phase, LDSC (b       yMAB , yMAB ) and LDSC (byLIB , yLIB )
reduce quickly to a value that is substantially lower than LDSC (b yCVW , yCVW ). Instead of using a uniform weight for the
three loss terms in the entire training process, we propose to focus more on reducing LDSC (b       yCVW , yCVW ) at the later
stage of the training process. A workflow is proposed in which α and β are controlled adaptively by LDSC (b      yMAB , yMAB )
and LDSC (byLIB , yLIB ), respectively. When these two loss functions are already small in the middle of the training phase,
α and β are reduced, allowing more emphasis to be placed on minimizing LDSC (b         yCVW , yCVW ).
The weights for the three losses evolve adaptively in ATDL according to the following equations:
                                                                L1
                                               α∗ (L1 ) = Å               ã
                                                         3 1 + a(1 − L1 )

                                                                 L2                                                         (1)
                                               β ∗ (L2 ) = Å               ã
                                                          3 1 + a(1 − L2 )

                                           γ ∗ (L1 , L2 ) = 1 − α∗ (L1 ) − β ∗ (L2 ),
where a > 0 is a hyperparamter. Note that α∗ (0) = β ∗ (0) = 0, α∗ (1) = β ∗ (1) =             1
                                                                                               3.   In addition, α∗ and β ∗ are
monotonic functions increasing from 0 to 31 when L1 and L2 increase from 0 to 1.
The new algorithm, which we call the adaptive triple dice loss (ATDL) approach, consists of two phases. A uni-
form weight was used in the first half and an adaptive weight defined in Eq. 1 was used in the second half. As
LDSC (b
      yMAB , yMAB ) and LDSC (b yLIB , yLIB ) are relatively large at the beginning of the training, a uniform emphasis was
given to MAB, LIB and CVW segmentation to facilitate the localization of MAB and LIB. When LDSC (b              yMAB , yMAB )
and LDSC (byLIB , yLIB ) are small, more emphasis was given to CVW segmentation according to Eq. 1 to refine the
carotid segmentation.

2.4   Data augmentation in training and testing

The training set was augmented by reconstructing MAB and LIB surfaces from manual segmentation using a shape-
based interpolation method [41] and then reslicing the image and reconstructed surface with an inter-slice distance of
0.1 mm. The training set generated this way was only involved in training the proposed network and not involved in
the testing phase. Only axial slices with manual segmentation were involved in the evaluation of the network. A total
of 53,968 axial image slices with manual or interpolated contours were generated by this procedure, in which 33,824
are CCA slices and 20,044 are ICA slices.
The following geometric operations were performed to further augment the training set: (a) Flipping: An image is
randomly flipped horizontally about the image center with a probability P1 and then is randomly flipped vertically
with a probability P2 . In this study, P1 = P2 = 0.5. (b) Translation: An image was randomly translated along x- and
y-axes by Tx and Ty pixels, where Tx and Ty are uniformly sampled from [0, 0.2H] and [0, 0.2W ], where H and W
are the height and the width of the image. (c) Rotation: An image was randomly rotated by d degrees about the image
center, where d is uniformly sampled from [−20, 20].
We performed image flipping in the inference stage to improve the segmentation accuracy. Fig. 2 shows the workflow
of this scheme. In particular, each 2D axial carotid image was flipped horizontally and vertically, resulting in three
versions of the same image (i.e., the original, the horizontally and vertically flipped images). These three versions of
the same image were fed into the network to generate three different segmentation results. The segmentation results
generated for the flipped images were flipped back to the original position, resulting in three aligned segmentation

                                                               5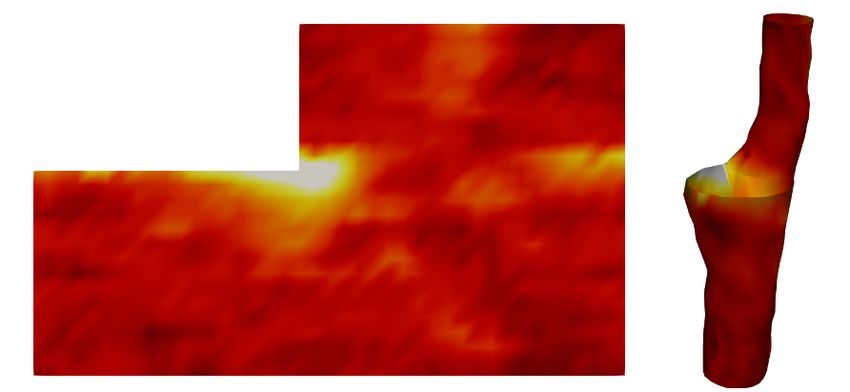
A PREPRINT - JANUARY 29, 2021

results for the same image slice. Pixel-wise majority voting was performed to generate the final segmentation result
for the 2D axial image.

                            Figure 2: Workflow of test time augmentation (TTA) procedure

3     Experiments

3.1   Experimental settings and implementations

Three major components were integrated in the proposed network: (i) the novel ATDL function minimized in the
two-channel U-Net architecture; (ii) test-time augmentation (TTA) and pixel-wise majority voting; (iii) training set
augmentation by MAB and LIB surface reconstruction and reslicing. Experiments were designed to evaluate each of
the three components independently. In addition, as the effects of the two-channel architecture and the triple Dice
loss have not been evaluated for carotid ultrasound images, we also evaluated the effects of these two components
in this study. Specifically, four models were evaluated, which we call single Dice loss (SDL), double Dice loss
(DDL), triple Dice loss (TDL) and ATDL. The SDL setting involves training two independent single-channel U-Nets.
In this setting, the U-Nets used for MAB and LIB segmentations were trained separately with LDSC (b        yMAB , yMAB )
and LDSC (b yLIB , yLIB ), respectively. The DDL and TDL settings involve training the two-channel U-Nets with
the loss functions 1/2LDSC (b    yMAB , yMAB ) + 1/2LDSC (b
                                                          yLIB , yLIB ), 1/3LDSC (b
                                                                                  yMAB , yMAB ) + 1/3LDSC (b
                                                                                                           yLIB , yLIB ) +
1/3LDSC (b yCVW , yCVW ), respectively. The training workflow for the ATDL setting was described in Section 2.3. In
each of the four configurations (i.e., SDL, DDL, TDL and ATDL), the improvement attributable to TTA was indepen-
dently assessed by comparing the segmentation accuracy of each model with and without TTA (denoted by
vs.  + TTA, where  = SDL, DDL, TDL or ATDL). The improvement attributable to training set
augmentation by MAB and LIB surface reconstruction/reslicing was evaluated by comparing the segmentation perfor-
mance produced by the ATDL + TTA model with and without this training set augmentation.
We randomly selected 60% (n = 136), 20% (n = 44) and 20% (n = 44) 3DUS images for CNN training, validation and
testing, respectively. Images acquired for the two carotid arteries of a single patient are included in the same partition.
Python 3.7 was used as the programming language. Keras [42] with TensorFlow [43] backend was used as the deep
learning framework. Experiments were performed on a computer with an Intel Xeon Silver 4108 CPU, 30GB memory
and a Graphics Processing Unit (GPU) of Nvidia GeForce RTX 2080 Ti with 11GB frame buffer.
The stochastic optimization algorithm Adam was employed to train the networks. The training hyperparameters are
given as follows: adaptive parameter a = 0.5, learning rate α = 10−3 , momentum parameters β1 = 0.9, β2 = 0.999,
batch size is 8, number of epochs is 50.

3.2   Evaluation metrics and statistical analysis

The MAB and LIB probability maps output by the proposed two-channel network were binarized using a threshold
of 0.5. Since the probability was either very close to 0 or 1, the segmentation results did not vary for a large range
of thresholding probabilities. The boundaries generated in this way were evaluated by region-, distance- and volume-
based metrics describe below. The Dice similarity coefficient (DSC) was used to evaluate the area overlap between
the algorithm and manual segmentation:
                                                             |A ∩ M |
                                                  DSC = 2
                                                            |A| + |M |

                                                            6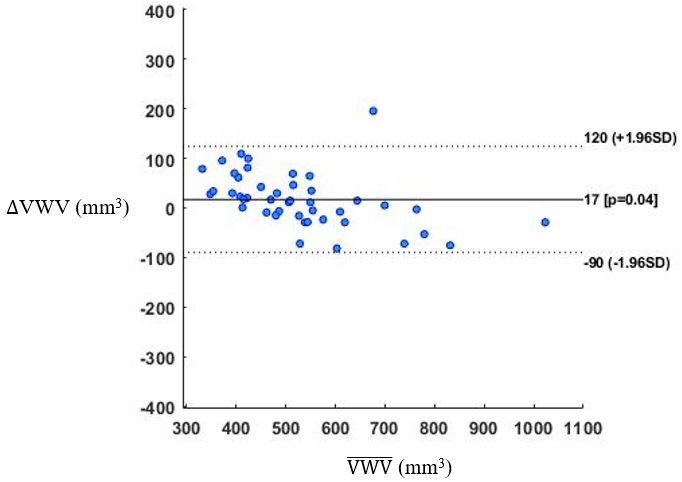
A PREPRINT - JANUARY 29, 2021

                                                        DSC                               M AD                             M AXD
 carotid               model
                                                MAB               LIB               MAB             LIB             MAB               LIB
                      SDL                    0.919 ± 0.107    0.876 ± 0.100    2.047 ± 3.129    2.213 ± 1.866   6.893 ± 11.874    7.122 ± 7.030
                   SDL+TTA                   0.924 ± 0.099    0.882 ± 0.112    1.921 ± 2.814    2.145 ± 2.460   6.551 ± 10.802    6.844 ± 7.197
                     DDL                     0.927 ± 0.112    0.887 ± 0.128    1.789 ± 2.230    1.998 ± 1.503    6.015 ± 7.189    5.934 ± 5.282
                  DDL+TTA                    0.932 ± 0.119    0.889 ± 0.129    1.663 ± 2.449    1.984 ± 1.648    5.516 ± 6.847    5.882 ± 5.499
    CCA
                     TDL                     0.928 ± 0.088    0.887 ± 0.102    1.822 ± 2.582    1.916 ± 1.327    5.858 ± 7.010    6.255 ± 5.513
                   TDL+TTA                   0.940 ± 0.065    0.899 ± 0.098    1.568 ± 1.644    1.907 ± 2.291    5.261 ± 5.990    6.032 ± 5.980
                     ATDL                    0.948 ± 0.055    0.913 ± 0.072    1.418 ± 1.822    1.626 ± 1.166    4.771 ± 5.950    5.501 ± 5.156
                  ATDL+TTA                  0.951 ± 0.041    0.916 ± 0.066    1.362 ± 1.546    1.595 ± 1.217    4.641 ± 5.692    5.394 ± 5.238
           ATDL+TTA w/o surface reslicing    0.943 ± 0.068    0.904 ± 0.100    1.783 ± 3.703    1.885 ± 3.007    5.461 ± 8.421    5.898 ± 7.149
                      SDL                    0.916 ± 0.039    0.860 ± 0.143    1.775 ± 1.000    2.171 ± 5.170    4.757 ± 2.658    5.501 ± 7.796
                   SDL+TTA                   0.928 ± 0.033    0.873 ± 0.119    1.503 ± 0.781    2.197 ± 6.205    4.254 ± 2.331    5.334 ± 9.108
                     DDL                     0.927 ± 0.060    0.873 ± 0.137    1.530 ± 1.272    1.710 ± 1.645    4.590 ± 3.119    4.622 ± 4.021
                  DDL+TTA                    0.930 ± 0.052    0.881 ± 0.118    1.449 ± 1.092    1.615 ± 1.405    4.390 ± 2.902    4.462 ± 3.677
    ICA
                     TDL                     0.928 ± 0.063    0.884 ± 0.102    1.571 ± 1.001    1.607 ± 1.217    4.247 ± 2.787    4.418 ± 3.497
                   TDL+TTA                   0.931 ± 0.043    0.889 ± 0.097    1.463 ± 0.894    1.544 ± 1.232    3.979 ± 2.390    4.255 ± 3.416
                     ATDL                    0.938 ± 0.035    0.884 ± 0.081    1.346 ± 1.576    1.615 ± 1.251    3.891 ± 3.184    4.351 ± 3.399
                  ATDL+TTA                  0.942 ± 0.033    0.890 ± 0.081    1.290 ± 1.557    1.544 ± 1.152    3.689 ± 3.015    4.193 ± 3.220
           ATDL+TTA w/o surface reslicing    0.911 ± 0.047    0.886 ± 0.096    1.978 ± 1.159    1.677 ± 1.409    5.129 ± 2.452    4.524 ± 3.686

Table 2: The means and the standard deviations of Dice coefficient (DSC), mean absolute difference (MAD) and
maximum absolute difference (MAXD) in MAB and LIB segmentations attained in all experimental settings.

where M and A denote the regions enclosed by the manual and algorithm segmentation, respectively, and |·| denotes
the area of the operand.
Distance-based metrics evaluate the distance between the manual and algorithm segmentation. The manually seg-
mented and the algorithm generated contours were matched on a point-by-point basis using the symmetric correspon-
dence algorithm [16]. Distances between each pair of corresponding points are denoted by {di }Ki=1 , where K is the
total number of corresponding pairs. Two distance-based metrics, known as the mean absolute difference (MAD) and
maximum absolute difference (MAXD) were defined below to summarize the distance measurements:
                                                                           K
                                                                        1 X
                                                             MAD =            di
                                                                        K i=1
                                                         MAXD = max {di },
                                                                        i=1,...,K

Manual measurement of VWV was shown to be sensitive to treatment effect [13]. A major motivation for the develop-
ment of the proposed algorithm is to accelerate the VWV measurement workflow. Therefore, a comparison between
the VWV measured from manual and algorithm-generated segmentations is important in assessing the clinical utility of
the algorithm. Two-dimensional contours segmented from axial image slices were reconstructed to three-dimensional
MAB and LIB surfaces using a previously proposed surface reconstruction algorithm [16]. The correlation and agree-
ment between VWV measurements obtained from manual segmentation and the proposed ATDL approach were as-
sessed using the Pearson’s correlation coefficient (r) and the Bland-Altman analysis, respectively. Statistical analyses
were performed using GraphPad Prism version 7.1.3 for Windows (GraphPad Software, San Diego, CA) and Matlab
R2020a (The Mathworks, Inc., Natick, MA). Tukey’s tests [44] were performed to compare metrics produced by dif-
ferent experimental settings. Tukey’s test is similar to the t-test, except that it corrects for the family-wise type I error
rate [45].

4     Experimental results
Table 2 shows the distance- and area-based metrics for nine experimental settings (4 loss function settings with/without
test time augmentation (TTA), ADTL + TTA trained without data augmentation by MAB and LIB surface reconstruc-
tion/reslicing). All metrics indicate that the ADTL + TTA setting produces the highest accuracy among all settings for
CCA and ICA segmentations. Table 3 shows the p-values of Tukey’s tests performed for 10 pairs of settings. The first
four pairings in Table 3 evaluates the contribution of the TTA strategy. The fifth and the sixth pairings evaluate the
effects of the two-channel U-Net and TDL, respectively. The next three pairings evaluate the contribution of ATDL
with respect to SDL, DDL and TDL. The last pairing evaluates the effect of our surface reslicing data augmentation
strategy. Results in Table 3 show that TTA has a significant effect in most pairings for CCA and ICA segmentations.
The data augmentation strategy involving surface reconstruction and reslicing has a significant effect, except in the
LIB of ICA. The two-channel U-Net and the introduction of the TDL function, proposed in Wu et al. [36] for segmen-
tation in MRI carotid images, do not contribute independently to statistically significant improvement, as shown in the

                                                                        7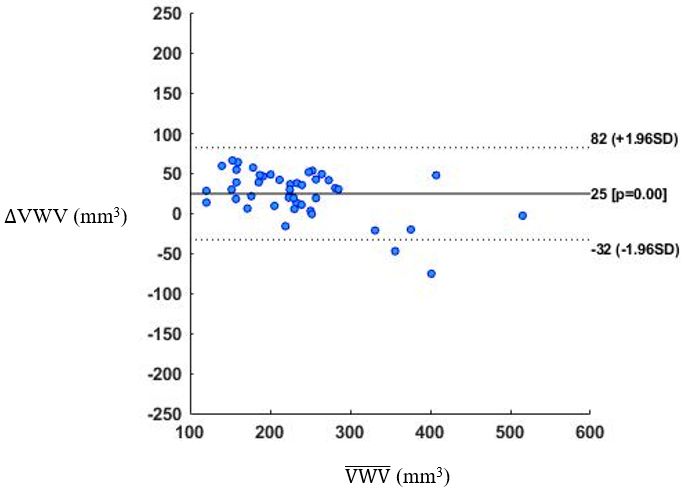
A PREPRINT - JANUARY 29, 2021

                                                                                                 DSC
       Carotid              Effect                     Setting 1           Setting 2
                                                                                           MAB          LIB
                                                         SDL              SDL+TTA         0.0019       0.0022
                                                        DDL              DDL+TTA          0.1205       0.4113
                        Effect of TTA
                                                        TDL              TDL+TTA         < 0.0001     < 0.0001
                                                        ATDL             ATDL+TTA         0.0044       0.0042
                      Advantage of two-
        CCA                                          SDL+TTA             DDL+TTA          0.6517       0.7224
                       channel U-Net
                        Effect of TDL                DDL+TTA             TDL+TTA          0.4594       0.4272
                                                     ATDL+TTA            SDL+TTA         < 0.0001     < 0.0001
                     Advantage of ATDL               ATDL+TTA            DDL+TTA          0.0001      < 0.0001
                                                     ATDL+TTA            TDL+TTA         < 0.0001     < 0.0001
                 Effect of data augmentation        ATDL+TTA
                                                                         ATDL+TTA         0.0011       0.0003
                     by surface reslicing        w/o surface reslicing
                                                         SDL              SDL+TTA        < 0.0001      0.0122
                                                        DDL              DDL+TTA         < 0.0001     < 0.0001
                        Effect of TTA
                                                        TDL              TDL+TTA          0.0143      < 0.0001
                                                        ATDL             ATDL+TTA        < 0.0001      0.2567
        ICA           Advantage of two-
                                                     SDL+TTA             DDL+TTA          0.9524       0.5876
                       channel U-Net
                        Effect of TDL                DDL+TTA             TDL+TTA         > 0.9999      0.2665
                                                     ATDL+TTA            SDL+TTA         < 0.0001      0.0007
                     Advantage of ATDL               ATDL+TTA            DDL+TTA         < 0.0001      0.3790
                                                     ATDL+TTA            TDL+TTA         < 0.0001     > 0.9999
                 Effect of data augmentation        ATDL+TTA
                                                                         ATDL+TTA        < 0.0001      0.7749
                     by surface reslicing        w/o surface reslicing

Table 3: P-values of Tukey’s test performed to evaluate individual contributions attributable to (1) the test-time aug-
mentation unit, (2) two-channel U-Net, (3) the use of triple Dice loss (TDL), (4) the use of the adaptive triple Dice
loss (ATDL) and (5) data augmentation by reslicing.

p-values obtained in the (SDL+TTA vs. DDL+TTA) and the (DDL+TTA vs. TDL+TTA) comparisons for CCA and
ICA segmentations.
In contrast, the proposed ATDL approach produced a significantly higher DSC for CCA and ICA segmentations than
the TDL approach as shown in Table 3. The improvement attributable to the proposed ATDL approach is shown in
Fig. 3, which shows the MAB and LIB contours for example cases from five arteries in the testing set. In these
examples, the MAB and LIB contours segmented by the TDL model missed large sections of the carotid artery and the
segmentation inaccuracy was largely corrected by the proposed ATDL model. Fig. 4 compares the 2D and 3D VWT
maps generated manually and using the ADTL + TTL model with training data augmentation by surface reslicing.
The 2D flattened maps were generated by cutting and unfolding the VWT maps, as previously described [37]. The
result suggests that VWT maps can be generated accurately based on the proposed algorithm. The availability of
the proposed segmentation tool will substantially accelerate the workflow of clinical evaluation of the effect of anti-
atherosclerotic treatments, such as those described in our previous clinical studies [13, 9].
Fig. 5 shows the correlation and the Bland-Altman plots comparing the VWV measurements for CCA produced
manually and based on the boundaries generated by the ADTL + TTA setting. Fig. 5 (a) shows a strong and significant
correlation between the two VWV measurements (r = 0.94 and p = 1.22 × 10⁻²¹ ). The Bland-Altman plot shown
in Fig. 5 (b) shows a bias of 17 mm3 with 95% limits of agreement ranging from -90 to 120 mm3 , which is small
compared to the VWV measurement range (292 – 1037 mm3 ). Fig. 6 shows similar plots for the VWV measurements
for the ICA. The Pearson’s coefficient is strong and significant (r = 0.95 and p = 2.53 × 10⁻²³ ). The Bland-Altman
plot shown in Fig. 6 (b) shows a bias of 25 mm3 with 95% limits of agreement ranging from -32 to 82 mm3 , which is
small compared to the VWV measurement range (106 – 516 mm3 ).

                                                          8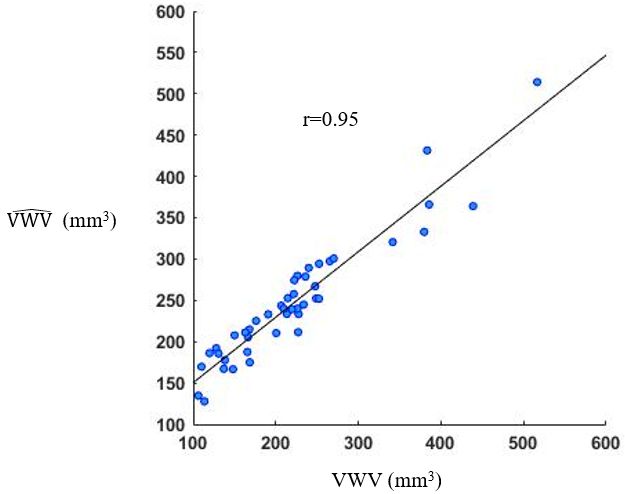
A PREPRINT - JANUARY 29, 2021

          (1a) (0.754, 0.777)   (2a) (0.832, 0.807)   (3a) (0.408, 0.469)   (4a) (0.680, 0.603)      (5a) (0.803, 0.839)

          (1b) (0.913, 0.906)   (2b) (0.959, 0.958)   (3b) (0.925, 0.934)   (4b) (0.840, 0.867)      (5b) (0.905, 0.934)
Figure 3: The effect of ATDL demonstrated in five example images. The green boundaries represent algorithm-
generated boundaries and the red boundaries represent manually segmented boundaries. (1a)-(5a) show the boundaries
segmented in the TDL setting and (1b)-(5b) show the boundaries segmented using the ATDL approach. The tuple
below each image represents the DSC for MAB and LIB segmentations.

         ()                              ((1a))                                               ((1b))

         ()                              ((2a))                                               ((2b))

         ()                              ((3a))                                                   ((3b))
Figure 4: Flattened vessel wall thickness map and its corresponding 3D vessel wall thickness surface for three example
arteries. Each row shows the maps generated by the same artery. (1a), (2a) and (3a) show the maps generated
using algorithm-generated boundaries, and (1b), (2b) and (3b) show the maps generated using manually segmented
boundaries.

                                                              9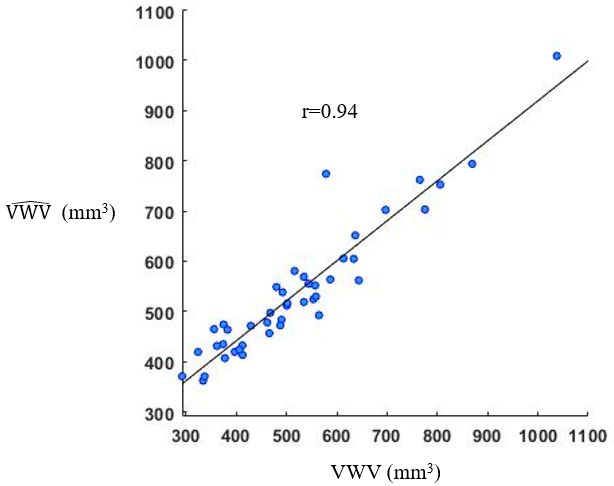
A PREPRINT - JANUARY 29, 2021

                                  carotid     model   time (s/epoch)       total time (h)
                                               SDL        931.47                 12.94
                                              DDL         491.34                  6.82
                                   CCA
                                              TDL         498.14                 6.92
                                              ATDL        501.02                  6.96
                                               SDL        606.02                 8.42
                                              DDL         309.93                 4.30
                                    ICA
                                              TDL         304.96                 4.24
                                              ATDL        305.38                 4.24

Table 4: Training time of all experimental settings. The total time is obtained by multiplying the per-epoch time with
the number of epochs executed, which is 50 in this study.

                     carotid                model               time (s/slice)     total time (s/3DUS)
                                         SDL                       0.050                  0.786
                                      SDL+TTA                      0.078                  1.256
                      CCA
                                  Two-channel U-Net                0.028                  0.453
                                Two-channel U-Net+TTA              0.052                  0.837
                                         SDL                       0.054                  0.542
                                      SDL+TTA                      0.083                  0.834
                       ICA
                                  Two-channel U-Net                0.031                  0.310
                                Two-channel U-Net+TTA              0.056                  0.563

Table 5: Testing time of all experimental settings. Time required to crop the ICA images is excluded. This time is
listed Section 5. -Note that the execution times for two-channel U-Net models using different cost functions (i.e.,
DDL, TDL and ATDL) are the same. TTA: test time augmentation.

Tables 4 and 5 show the training and testing times required by models evaluated in this study. Since training with SDL
to segment MAB and LIB require two single-channel U-Net, the training and testing time of SDL is the summation of
computational time required to train and test the independent networks used to segment MAB and LIB. It is not unex-
pected that testing and training times required by SDL are twice of those required by two-channel U-Nets. Training
time required by ATDL is slightly higher than TDL and DDL due to the additional time required to evaluate the ATDL
function (Eq. 1). Testing times required for all two-channel U-Net settings (i.e., DDL, TDL and ATDL) are the same,
with TTA taking extra evaluation times.

5   Discussion
Changes of VWV measured from 3D carotid ultrasound images were shown to be sensitive to the effect of medical
therapies [13]. Localized vessel wall thickness (VWT) distribution was shown to be even more sensitive than VWV
[9]. However, the clinical utility of these 3DUS measurements was limited by the requirement for segmenting MAB
and LIB manually from 3DUS images, which is time-consuming and subject to observer variability. Although methods
with different levels of automation have been previously proposed to segment MAB and LIB from CCA [23, 21, 22,
26, 24, 30, 28, 20, 29], a substantial gap exists in the automation of ICA segmentation, possibly due to the difficulties
in discriminating the internal from the external carotid. However, the VWV and VWT measurements should include
ICA as plaque burden is more prevalent in the ICA than CCA [35]. Therefore, there is a critical requirement for
developing an automatic algorithm to segment MAB and LIB from ICA. In this work, we developed an algorithm
that (1) automates the segmentation of CCA without ROI identification and (2) segments the ICA based on the ROI
identified in the axial slice most proximal and most distal to the bifurcation in the 3DUS volume. Observer interaction
was minimal and the interaction time required was 8.7 s per 3DUS volume. We demonstrated that the VWT maps
covering the CCA and ICA can be constructed accurately. The proposed method has the potential to accelerate the
translation of 3DUS vessel wall measurements to clinical research and clinical practice. The technical contribution of
this paper involves the introduction of the adaptive triple Dice loss (ADTL) function. The TDL function used in a two-
channel U-Net to segment the vessel wall in black-blood MRI [36]. The authors reported that the two-channel U-Net

                                                           10
A PREPRINT - JANUARY 29, 2021
(a) (b)
Figure 5: Relationships between VWV measurements of the CCA obtained from the manually segmented boundaries
(VWV) and that obtained algorithm-generated boundaries (V
÷ W V ). (a) The Pearson’s correlation and (b) and Bland-
Altman analysis of the two sets of measurements.
(a) (b)
Figure 6: Relationships between VWV measurements of the ICA obtained from the manually segmented boundaries
(VWV) and that obtained algorithm-generated boundaries (V
÷ W V ). (a) The Pearson’s correlation and (b) Bland-
Altman analysis of the two sets of measurements.
11A PREPRINT - JANUARY 29, 2021
with TDL function has only a 0.4-0.5% improvement in Dice coefficients over the conventional U-Net, and conceded
that the performance improvement “is not much better” than the conventional U-Net. Our finding is similar. We found
that the independent contributions by the two-channel U-Net architecture and the introduction of the TDL function
are not statistically significant. ADTL shifts the focus adaptively to the minimization of the Dice loss of vessel wall
segmentation in the second half of the training process after the Dice losses are already relatively low at this stage.
This adaptive approach has attained a statistically significant improvement over the TDL function. As shown in Fig.
3, the improvement is substantial at the bifurcation where the axial cross-section of the artery is elongated.
Table 6 compares the DSC attained by our method with previously published methods in CCA segmentation. The
DSC of MAB and LIB segmentation produced by our methods is lower than that attained by Ukwatta et al. [23] and
Zhou et al. [28] and the DSC of MAB segmentation was slightly lower than Hossain et al. [24]. These three methods
involve extensive user interactions. Ukwatta et al. [23] require a user to take 9 minutes to initialize the algorithm.
They reduced the initialization time to around 2 minutes in another version of the algorithm [22], in which the DSC
was lower. The human interaction time was 13.8s in Zhou et al. [28]. The method of Hossain et al. [24] takes around
14 minutes to initialize. In contrast, no manual ROI identification was needed in our CCA segmentation algorithm. A
subtle difference between the evaluation of our algorithm and Zhou et al. [20] algorithm should be pointed out. The
evaluation in Zhou et al. [20] was done separately for CCA slices far from and close to the bifurcation, which are
categorized as the “CCA” and “bifurcation” groups, respectively. No specification as to how close the slice should be
for it to be categorized as belonging to the “bifurcation” group. Evaluation was performed separately for these two
groups. We list the result for the “CCA” group in Table 6. The DSC in the "bifurcation" group is lower (0.919 vs.
0.932 for MAB and 0.893 vs. 0.895 for LIB). We do not make this differentiation in our evaluation.
DSC
Paper Execution time
MAB LIB
Ukwatta et al. [23] 11.1 min 0.954 0.931
Yang et al. [21] 4.3 min 0.944 0.928
Ukwatta et al. [22] 1.72 min 0.944 0.906
Hossain et al. [24] 37 min 0.953 0.883
Zhou et al. [28] 34.4 s 0.965 0.928
Zhou et al. [20] 0.69 s∗ 0.932 0.895
Proposed algorithm (CCA) 0.837 s 0.951 0.916
Table 6: Comparison in the DSC and time requirement of CCA segmentation methods from carotid ultrasound. *Re-
ported time excludes the time required to identify ROI
Table 6 also compares the time required by different algorithms to segment the CCA in a 3DUS volume. The time
tabulated includes the manual initialization time. Many algorithms tabulated involved extensive human interaction
[23, 21, 22, 24, 28]. Therefore, the segmentation time is relatively long. The training time of Zhou et al. [20] is 11
h, longer than 7 h required by our method (Table IV). The segmentation time required by our approach is shorter than
Refs [23, 21, 22, 24, 28]. Although the CCA segmentation time required by our algorithm is longer than Zhou et al.
[20] (0.69s/3DUS), their method require manual ROI identification for the CCA, which would take a time comparable
to that we took to identify an ROI for ICA (i.e., 8.7s).
Although our method yields promising carotid segmentation performance, manual ROI identification is still needed
for ICA segmentation. In the future, a 3D keypoint detection module [46] can be implemented as a deep learning
network to localize the ICA. An ROI can then be identified automatically to be segmented by the proposed method.
This strategy would allow a fully automatic workflow.
6 Conclusion
In this paper, we developed a two-channel U-Net trained by the proposed adaptive TDL to segment the MAB and
the LIB of the CCA without manual ROI identification and the ICA with minimal user interaction. The proposed
approach generates VWV measurement efficiently and accurately for a longitudinal coverage encompassing the CCA
and ICA. The MAB and LIB segmented by the approach can be used to generate VWT maps, from which VWT-based
biomarkers can be measured to provide sensitive treatment effect evaluation and accurate stroke risk stratification.
12A PREPRINT - JANUARY 29, 2021
7 Acknowledgement
Dr. Chiu is grateful for the funding support from the Research Grant Council of HKSAR, China (Project nos. CityU
11205917, CityU 11203218) and the City University of Hong Kong Strategic Research Grant (Project nos. 7005226
and 7005441). We also thank Dr. J. David Spence for providing the 3D ultrasound images used in this study.
References
[1] G. WHO, “Global health estimates 2016: deaths by cause, age, sex, by country and by region, 2000–2016,” 2018.
[2] S. Wu, B. Wu, M. Liu, Z. Chen, W. Wang, C. S. Anderson, P. Sandercock, Y. Wang, Y. Huang, L. Cui et al.,
“Stroke in china: advances and challenges in epidemiology, prevention, and management,” The Lancet Neurol-
ogy, vol. 18, no. 4, pp. 394–405, 2019.
[3] R.-L. Chen, J. S. Balami, M. M. Esiri, L.-K. Chen, and A. M. Buchan, “Ischemic stroke in the elderly: an
overview of evidence,” Nature Reviews Neurology, vol. 6, no. 5, pp. 256–265, 2010.
[4] J. D. Spence, “Intensive management of risk factors for accelerated atherosclerosis: the role of multiple inter-
ventions,” Current neurology and neuroscience reports, vol. 7, no. 1, pp. 42–48, 2007.
[5] M. L. Bots, A. W. Hoes, P. J. Koudstaal, A. Hofman, and D. E. Grobbee, “Common carotid intima-media thick-
ness and risk of stroke and myocardial infarction: the rotterdam study,” Circulation, vol. 96, no. 5, pp. 1432–
1437, 1997.
[6] D. H. O’Leary, J. F. Polak, R. A. Kronmal, T. A. Manolio, G. L. Burke, and S. K. Wolfson Jr, “Carotid-artery
intima and media thickness as a risk factor for myocardial infarction and stroke in older adults,” New England
Journal of Medicine, vol. 340, no. 1, pp. 14–22, 1999.
[7] H. M. Den Ruijter, S. A. Peters, T. J. Anderson, A. R. Britton, J. M. Dekker, M. J. Eijkemans, G. Engström,
G. W. Evans, J. De Graaf, D. E. Grobbee et al., “Common carotid intima-media thickness measurements in
cardiovascular risk prediction: a meta-analysis,” Jama, vol. 308, no. 8, pp. 796–803, 2012.
[8] M. L. Bots, G. W. Evans, W. A. Riley, and D. E. Grobbee, “Carotid intima-media thickness measurements in
intervention studies: design options, progression rates, and sample size considerations: a point of view,” Stroke,
vol. 34, no. 12, pp. 2985–2994, 2003.
[9] J. Cheng, E. Ukwatta, S. Shavakh, T. W. Chow, G. Parraga, J. D. Spence, and B. Chiu, “Sensitive three-
dimensional ultrasound assessment of carotid atherosclerosis by weighted average of local vessel wall and plaque
thickness change,” Medical physics, vol. 44, no. 10, pp. 5280–5292, 2017.
[10] D. H. O’Leary and J. F. Polak, “Intima-media thickness: a tool for atherosclerosis imaging and event prediction,”
The American journal of cardiology, vol. 90, no. 10, pp. L18–L21, 2002.
[11] A. V. Finn, F. D. Kolodgie, and R. Virmani, “Correlation between carotid intimal/medial thickness and atheroscle-
rosis: a point of view from pathology,” Arteriosclerosis, thrombosis, and vascular biology, vol. 30, no. 2, pp.
177–181, 2010.
[12] B. Chiu, M. Egger, J. D. Spence, G. Parraga, and A. Fenster, “Development of 3d ultrasound techniques for
carotid artery disease assessment and monitoring,” International Journal of Computer Assisted Radiology and
Surgery, vol. 3, no. 1-2, p. 1, 2008.
[13] A. Krasinski, B. Chiu, J. D. Spence, A. Fenster, and G. Parraga, “Three-dimensional ultrasound quantification
of intensive statin treatment of carotid atherosclerosis,” Ultrasound in medicine & biology, vol. 35, no. 11, pp.
1763–1772, 2009.
[14] C. D. Ainsworth, C. C. Blake, A. Tamayo, V. Beletsky, A. Fenster, and J. D. Spence, “3d ultrasound measurement
of change in carotid plaque volume: a tool for rapid evaluation of new therapies,” Stroke, vol. 36, no. 9, pp. 1904–
1909, 2005.
[15] C. K. Zarins, C. Xu, C. A. Taylor, and S. Glagov, “Localization of atherosclerotic lesions,” Vascular Surgery, pp.
55–65, 2004.
[16] B. Chiu, M. Egger, J. D. Spence, G. Parraga, and A. Fenster, “Quantification of carotid vessel wall and plaque
thickness change using 3d ultrasound images,” Medical physics, vol. 35, no. 8, pp. 3691–3710, 2008.
[17] B. Chiu, W. Chen, and J. Cheng, “Concise biomarker for spatial–temporal change in three-dimensional ultra-
sound measurement of carotid vessel wall and plaque thickness based on a graph-based random walk framework:
Towards sensitive evaluation of response to therapy,” Computers in Biology and Medicine, vol. 79, pp. 149–162,
2016.
13A PREPRINT - JANUARY 29, 2021
[18] B. Chiu, B. Li, and T. W. Chow, “Novel 3d ultrasound image-based biomarkers based on a feature selection from
a 2d standardized vessel wall thickness map: a tool for sensitive assessment of therapies for carotid atheroscle-
rosis,” Physics in Medicine & Biology, vol. 58, no. 17, p. 5959, 2013.
[19] J. Cheng, D. Pike, T. W. Chow, M. Kirby, G. Parraga, and B. Chiu, “Three-dimensional ultrasound measurements
of carotid vessel wall and plaque thickness and their relationship with pulmonary abnormalities in ex-smokers
without airflow limitation,” The international journal of cardiovascular imaging, vol. 32, no. 9, pp. 1391–1402,
2016.
[20] R. Zhou, F. Guo, M. R. Azarpazhooh, J. D. Spence, E. Ukwatta, M. Ding, and A. Fenster, “A voxel-based fully
convolution network and continuous max-flow for carotid vessel-wall-volume segmentation from 3d ultrasound
images,” IEEE Transactions on Medical Imaging, 2020.
[21] X. Yang, J. Jin, M. Xu, H. Wu, W. He, M. Yuchi, and M. Ding, “Ultrasound common carotid artery segmentation
based on active shape model,” Computational and mathematical methods in medicine, vol. 2013, 2013.
[22] E. Ukwatta, J. Yuan, D. Buchanan, B. Chiu, J. Awad, W. Qiu, G. Parraga, and A. Fenster, “Three-dimensional seg-
mentation of three-dimensional ultrasound carotid atherosclerosis using sparse field level sets,” Medical physics,
vol. 40, no. 5, p. 052903, 2013.
[23] E. Ukwatta, J. Awad, A. Ward, D. Buchanan, J. Samarabandu, G. Parraga, and A. Fenster, “Three-dimensional
ultrasound of carotid atherosclerosis: semiautomated segmentation using a level set-based method,” Medical
physics, vol. 38, no. 5, pp. 2479–2493, 2011.
[24] M. M. Hossain, K. AlMuhanna, L. Zhao, B. K. Lal, and S. Sikdar, “Semiautomatic segmentation of atheroscle-
rotic carotid artery wall volume using 3d ultrasound imaging,” Medical physics, vol. 42, no. 4, pp. 2029–2043,
2015.
[25] B. Chiu, E. Ukwatta, S. Shavakh, and A. Fenster, “Quantification and visualization of carotid segmentation
accuracy and precision using a 2d standardized carotid map,” Physics in Medicine & Biology, vol. 58, no. 11, p.
3671, 2013.
[26] R.-M. Menchón-Lara, M.-C. Bastida-Jumilla, J. Morales-Sánchez, and J.-L. Sancho-Gómez, “Automatic detec-
tion of the intima-media thickness in ultrasound images of the common carotid artery using neural networks,”
Medical & biological engineering & computing, vol. 52, no. 2, pp. 169–181, 2014.
[27] C. Azzopardi, K. P. Camilleri, and Y. A. Hicks, “Carotid ultrasound segmentation using radio-frequency derived
phase information and gabor filters,” in 2015 37th Annual International Conference of the IEEE Engineering in
Medicine and Biology Society (EMBC). IEEE, 2015, pp. 6338–6341.
[28] R. Zhou, A. Fenster, Y. Xia, J. D. Spence, and M. Ding, “Deep learning-based carotid media-adventitia and
lumen-intima boundary segmentation from three-dimensional ultrasound images,” Medical physics, 2019.
[29] C. Azzopardi, K. P. Camilleri, and Y. A. Hicks, “Bimodal automated carotid ultrasound segmentation using
geometrically constrained deep neural networks,” IEEE Journal of Biomedical and Health Informatics, vol. 24,
no. 4, pp. 1004–1015, 2020.
[30] C. Azzopardi, Y. A. Hicks, and K. P. Camilleri, “Automatic carotid ultrasound segmentation using deep convolu-
tional neural networks and phase congruency maps,” in 2017 IEEE 14th International Symposium on Biomedical
Imaging (ISBI 2017). IEEE, 2017, pp. 624–628.
[31] H. Zhao, J. Shi, X. Qi, X. Wang, and J. Jia, “Pyramid scene parsing network,” in Proceedings of the IEEE
conference on computer vision and pattern recognition, 2017, pp. 2881–2890.
[32] J. D. Spence, “Determinants of carotid plaque burden,” Atherosclerosis, vol. 255, pp. 122–123, 2016.
[33] X. Chen, Y. Zhao, J. D. Spence, and B. Chiu, “Development of a 3d carotid atlas for quantification of local
volume change,” in Medical Imaging 2020: Image Processing, vol. 11313. International Society for Optics and
Photonics, 2020, p. 113132R.
[34] T. Wannarong, G. Parraga, D. Buchanan, A. Fenster, A. A. House, D. G. Hackam, and J. D. Spence, “Progression
of carotid plaque volume predicts cardiovascular events,” Stroke, vol. 44, no. 7, pp. 1859–1865, 2013.
[35] S. Prabhakaran, T. Rundek, R. Ramas, M. S. Elkind, M. C. Paik, B. Boden-Albala, and R. L. Sacco, “Carotid
plaque surface irregularity predicts ischemic stroke: the northern manhattan study,” Stroke, vol. 37, no. 11, pp.
2696–2701, 2006.
[36] J. Wu, J. Xin, X. Yang, J. Sun, D. Xu, N. Zheng, and C. Yuan, “Deep morphology aided diagnosis network for
segmentation of carotid artery vessel wall and diagnosis of carotid atherosclerosis on black-blood vessel wall
mri,” Medical physics, vol. 46, no. 12, pp. 5544–5561, 2019.
14A PREPRINT - JANUARY 29, 2021
[37] Y. Chen and B. Chiu, “Correspondence optimization in 2d standardized carotid wall thickness map by descrip-
tion length minimization: A tool for increasing reproducibility of 3d ultrasound-based measurements,” Medical
physics, vol. 43, no. 12, pp. 6474–6490, 2016.
[38] A. A. House, M. Eliasziw, D. C. Cattran, D. N. Churchill, M. J. Oliver, A. Fine, G. K. Dresser, and J. D. Spence,
“Effect of b-vitamin therapy on progression of diabetic nephropathy: a randomized controlled trial,” Jama, vol.
303, no. 16, pp. 1603–1609, 2010.
[39] M. Egger, J. D. Spence, A. Fenster, and G. Parraga, “Validation of 3d ultrasound vessel wall volume: an imaging
phenotype of carotid atherosclerosis,” Ultrasound in medicine & biology, vol. 33, no. 6, pp. 905–914, 2007.
[40] S. Ioffe and C. Szegedy, “Batch normalization: Accelerating deep network training by reducing internal covariate
shift,” arXiv preprint arXiv:1502.03167, 2015.
[41] G. J. Grevera and J. K. Udupa, “Shape-based interpolation of multidimensional grey-level images,” IEEE trans-
actions on medical imaging, vol. 15, no. 6, pp. 881–892, 1996.
[42] F. Chollet et al. (2015) Keras. [Online]. Available: https://github.com/fchollet/keras
[43] M. Abadi, A. Agarwal, P. Barham, E. Brevdo, Z. Chen, C. Citro, G. S. Corrado, A. Davis, J. Dean, M. Devin,
S. Ghemawat, I. Goodfellow, A. Harp, G. Irving, M. Isard, Y. Jia, R. Jozefowicz, L. Kaiser, M. Kudlur,
J. Levenberg, D. Mané, R. Monga, S. Moore, D. Murray, C. Olah, M. Schuster, J. Shlens, B. Steiner, I. Sutskever,
K. Talwar, P. Tucker, V. Vanhoucke, V. Vasudevan, F. Viégas, O. Vinyals, P. Warden, M. Wattenberg, M. Wicke,
Y. Yu, and X. Zheng, “TensorFlow: Large-scale machine learning on heterogeneous systems,” 2015, software
available from tensorflow.org. [Online]. Available: https://www.tensorflow.org/
[44] J. W. Tukey, “Comparing individual means in the analysis of variance,” Biometrics, pp. 99–114, 1949.
[45] R. E. Walpole, R. H. Myers, S. L. Myers, and K. Ye, Probability and statistics for engineers and scientists.
Macmillan New York, 1993, vol. 5.
[46] T. Simon, H. Joo, I. Matthews, and Y. Sheikh, “Hand keypoint detection in single images using multiview boot-
strapping,” in Proceedings of the IEEE conference on Computer Vision and Pattern Recognition, 2017, pp. 1145–
1153.
15You can also read