Policing fish at Boston's Museum of Science: Studying audiovisual interaction in the wild
←
→
Page content transcription
If your browser does not render page correctly, please read the page content below
Under review, April 2015

                         Policing fish at Boston’s Museum of Science:
                          Studying audiovisual interaction in the wild
                                   Hannah Goldberg† , Yile Sun? , Timothy J. Hickey?
                                   Barbara Shinn-Cunningham† and Robert Sekuler? ,
                             †
                                 Boston University, Boston MA, ? Brandeis University, Waltham MA

                     Boston’s Museum of Science supports researchers who carry out projects that advance science
                     while also providing educational opportunities to the Museum’s visitors. For our project,
                     60 visitors to the Museum played ‘‘Fish Police!!,’’ a video game that examines audiovisual
                     integration, including the ability to ignore irrelevant sensory information. Players, who ranged
                     in age from 6 to 82 years, made speeded responses to computer-generated fish that swam rapidly
                     across a tablet display. Responses were to be made solely on the basis of the rate (6 or 8 Hz) at
                     which a fish’s size modulated sinusoidally, alternately growing and shrinking. Accompanying
                     each fish was a task-irrelevant broadband sound, amplitude modulated at either 6 or 8 Hz. The
                     rates of visual and auditory modulation were either Congruent (both 6 Hz or both 8 Hz), or
                     Incongruent (6 and 8 or 8 and 6 Hz). Despite being instructed to ignore the sound, players
                     of all ages responded more accurately and faster when a fish’s auditory and visual signatures
                     were Congruent. In a controlled laboratory setting, a related task produced very similar results,
                     demonstrating the robustness of the audiovisual interaction reported here. Suggestions are
                     offered for conducting research in a public setting.

                     Keywords: audiovisual interaction, congruent temporal structure, video game

                         Background                                      research that will also offer visitors a valuable educational
                                                                         experience. The laboratory makes it possible to collect useful
   For more than a century, psychophysical data have occa-               data from large and diverse samples of subjects across a wide
sionally been collected outside the laboratory, in public or             age range, from school-aged children through senior citizens.
quasi-public settings. Notwithstanding their logistical chal-            For some time, we have been interested in audiovisual inte-
lenges, such environments can be attractive, especially for              gration, particularly the ways in which a correlation between
research focused on developmental trends and/or individual               signals’ temporal structures promotes their integration (Parise,
differences. Perhaps the best known early examples of re-                Spence, & Ernst, 2012). So we took advantage of the Museum
search in a public setting is Galton’s (1895) study of 9,000             environment in order to examine age-related changes in au-
visitors to the London International Health Exhibition. After            diovisual integration, and also to test the robustness of obser-
paying a small fee for the privilege, each visitor’s visual              vations that we made previously, in well-controlled laboratory
acuity, hearing, reaction time, and other functions were mea-            settings (Sun, Shinn-Cunningham, Somers, & Sekuler, 2014;
sured.                                                                   Eickhoff, Harris, de Vries, & Srinivasan, 2012; Benussen et
   The Living Laboratory R located in Boston’s Museum of                 al., 2014).
Science provides a unique research environment. The mu-
seum invites scientists from local universities and hospitals to            Psychophysical experiments are often time consuming and
use the laboratory as a venue for engaging visitors in ongoing           usually require many repetitions of the same measurement.
                                                                         As a result, test subjects must be available, attentive and
                                                                         motivated for one or more lengthy testing sessions. Partic-
                                                                         ularly when researchers want to study a wide age range of
   Supported by CELEST, an NSF Science of Learning Cen-                  participants, the repetitive, sometimes monotonous aspects of
ter (SBE-0354378). This research was conducted in the Living
                                                                         an experiment can cause participants to withdraw before the
Laboratory R at the Museum of Science, Boston. We thank Justin
Harris, manager of the Living Laboratory for his help; Fatima Abu
                                                                         needed data have been collected. Withdrawal before testing
Deeb, Nick Moran and Jonathan Chu provided excellent program-            is complete can render data collected up to that point unus-
ming assistance. This study was carried out in accordance with           able. To minimize such risks, we embedded our experiment
Brandeis University’s Committee for the Protection of Human Sub-         within a simple video game, which was designed to engage
jects and with the World Medical Association Helsinki Declaration        and amuse participants while also generating data on interac-
as revised in October 2008.                                              tions between what subjects saw and what they heard (e.g.,

                                                                     1
2                                       GOLDBERG, SUN, HICKEY, SHINN-CUNNINGHAM & SEKULER

Abramov et al., 1984; Miranda & Palmer, 2014).                     terrupted by some other unavoidable event. Moreover, about
   In our video game, Fish Police!!, players watched as            25% of the players asked if they could play a second time,
computer-generated fish appeared one at a time and swam            a request that we had to decline because there was almost
rapidly across a virtual river. As it swam, each fish oscillated   always a line of people waiting their turn to play.
sinusoidally in size, at either 6 or 8 Hz. To make the task            As potential players of Fish Police!! would almost cer-
harder, each fish’s path was perturbed by a series of small        tainly be unused to the attentional demands of psychophysical
random vertical displacements. Accompanying each fish was          experiments, we decided to embed subjects’ instructions in
a broadband sound that was amplitude modulated at either 6 or      a narrative that would be engaging, easily understood and
8 Hz. Subjects were instructed to classify each fish as rapidly    easily remembered. After being shown the computer tablet on
as possible using only what they saw, judging whether a fish       which the game would be played, subjects were told: ‘‘You
oscillated at the slower (6 Hz) or faster rate (8 Hz). While       are going to be the police officer in charge of a river. One
making these judgments, subjects were to ignore the concur-        at a time, from either side of the tablet, a fish will appear.
rent amplitude modulated sound. If despite these instructions,     They are very nervous, though, because they don’t want to
the sound affected subjects’ responses, we expected that cat-      be caught by you! The bad fish will be wiggling fast because
egorizations to be more accurate and faster when the visual        they’re scared, that’s when you tilt the tablet towards you to
and auditory signals were Congruent, that is when they shared      catch them. If the fish is wiggling more slowly, then it’s a
the same frequency, rather than Incongruent, when auditory         good fish because it isn’t as nervous, so you can tilt the tablet
and visual signals were mismatched in frequency.                   away from you to let it go. Remember though, since they’ve
   Once a fish appeared and began its journey across the           been swimming for a while, they’re a little bored so they hum
river, a subject had just two seconds to respond before the        --you’ll hear this through the headphones I’ll be putting on
fish disappeared from view. Then three seconds later, a new        you. Try as best you can to JUST focus on their wiggling to
fish appeared and began its journey across the river. This         tell if they’re a good or bad fish.’’ Each participant played the
schedule spawned about 12 fish per minute, which made the          game while holding the tablet with one hand on each side of
game challenging and seemed to promote sustained attention.        the screen. This made it possible to define a pair of responses,
   In addition to a task design that would be accessible to        tilting the tablet either toward or away from the player, had an
subjects of all ages, this unique setting also required special    easily remembered correspondence to the judgment signaled
considerations in terms of set up. In laboratory environments,     by each direction of tilt.
equipment needed for research can be set up and left unmo-            At the entrance to the Living Laboratory, a video monitor
lested for repeated use over an extended period. In public         advertised the game by displaying an image from Fish Po-
settings, that is usually impossible to do. The Living Labora-     lice!!’s splash screen. Before commencing play, a player’s
tory’s space is time-shared among multiple research projects,      basic demographic information, initials and age, was entered
each of whom can use the space only a few hours each week.         via the tablet’s touchscreen. This information and all data
At the end of each day’s assigned time, researchers must           generated during game play were de-identified and uploaded
pack up and remove all the equipment and materials that had        wirelessly by the tablet in real time to a secure server offsite.
been used. To accommodate this requirement, our experi-            The tablet’s built-in accelerometer sampled the tablet’s angle
ment’s game was implemented in Python on an inexpensive            of tilt at 60 Hz. The Python script controlling the video game
touchscreen tablet computer (Samsung Note 10.1) running            defined a response as a rotation that was 17o or more relative
the Android mobile operating system.                               to the tablet’s orientation at the moment when a fish first ap-
   To boost players’ enjoyment, Fish Police!! incorporated         peared on the screen. This rotation threshold guarded against
several features common to video games (Hawkins, Rae, Nes-         that possibility that spurious, unintended movements of the
bitt, & Brown, 2013; Miranda & Palmer, 2014). For example,         tablet would be mistaken for genuine responses to the fish.
each correct response was followed immediately by a pleas-         Once the Python script detected that the response threshold
ant, rewarding sound (clinking of coins), and each incorrect       had been exceeded, it triggered the appropriate feedback for
response brought an unpleasant sound (a short buzz). Addi-         players, either coins clinking or a buzzing sound, and then,
tionally, a running total of correct responses, represented by a   three seconds later, spawned the next fish. All accelerometer
collection of coins, was displayed at the top of the computer      readings and responses were inserted into a data stream sent
tablet screen. The length of a green progress bar near the dis-    wirelessly from the testing area to an offsite server.
play’s top indicated the time remaining before the response           Before beginning the game, a player was shown how to
deadline. Thanks to these features and the task’s inherent         hold the tablet, with one hand on each side, and how the tablet
challenge, Fish Police!! proved sufficiently engaging that         was to be tilted in order to signal a response. Then, each player
of the people who started to play, only ∼10% of people quit        was given three practice trials for congruent and incongruent
before completing the game. Of these, approximately half           g̀ood’’ fish, and the same for ‘‘bad’’ fish. Also include in
were either ushered away by parents or guardians, or were in-      these practice trials were some in which the fish was presented
FISH POLICE!! 3
with no accompanying sound. These no-sound trials were
included to help subjects better understand that they were to
judge a fish only on the basis of its visual attributes. The prac- 15
tice trials provided an opportunity to make sure that a player
understood the task. These trials was followed by a set of 10
practice trials in which conditions were randomized. Subjects
Frequency
10
scoring six or more correct on these randomized trials were
allowed to move on to the game proper. Twelve subjects
who failed to reach that threshold received an additional set 5
of 10 practice trials. Most of these twelve were among the
younger subjects, who may have been particularly distracted
by the presence of schoolmates and friends. Later, after play 0
was complete, the player’s proportion of correct responses 0 25 50
Age (in years)
75 100
and mean response time, along with the initials and results of Figure 2. Age distribution of test participants completing the
the previous ten players, were displayed on a large computer entire five minute game.
monitor that was visible to the player and to any onlookers.
A B ages ranged from 82 years down to 5 years, the youngest age
we had permission to test. Figure 2 shows the age distribution
of the players.
The 60 fish each player saw and heard were uniformly
distributed across four categories defined by the two species
of fish (good fish --6 Hz oscillation in size, and bad fish --8Hz
oscillation in size), crossed with two types of congruence
(Congruent audiovisual signals, and Incongruent audiovisual
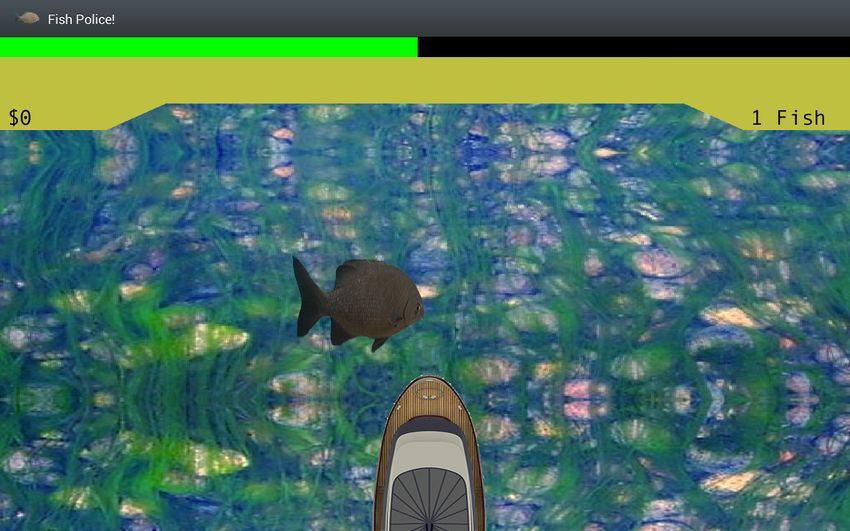
Figure 1. A pair of screen captures from the tablet display. signals). For each subject, this 2×2 design produced just 15
A. Fish appeared at the screen’s left side. B. Fish appeared trials per cell, too few samples for stable estimates of the
at the screen’s right side. The green countdown bar at the dependent measures. For example, with only 15 samples
top of screen shows that more time is left before the response and binomial variability, a change of just a single response
deadline in B than in A. This difference corresponds to the would produce a swing of more than 13%. To reduce the
fact that fish in A has moved further from its starting location impact of having so few samples per condition, while main-
(at the edge of screen) than has the fish in B. The size differ- taining the focus on the impact of audiovisual interaction,
ence between the fish results from the fact that the screen shot we aggregated all responses into just two categories: all fish
shows the two fish at different points in their size oscillation whose audiovisual signals were Congruent, and all fish whose
cycles. audiovisual signals were Incongruent. In so doing, we ignored
the frequency at which any particular fish varied in size.
We began data analysis by comparing the accuracy with
Experimental Design and Results which players responded to Congruent and Incongruent fish.
During approximately five minutes of play, each player Audiovisual Congruent fish were correctly categorized more
had the opportunity to judge and respond to 60 fish. For half often than were Incongruent fish. The mean difference be-
the fish, the frequency of its size oscillation and the frequency tween the two proportions correct was 0.15 (95% confidence
of the concurrent amplitude modulation were Congruent, that intervals [0.11, 0.20]. Differences between proportions of cor-
is, both were the same, either 6 Hz or 8 Hz; for the other half rect responses made to Congruent and Incongruent fish were
of the fish, size and sound amplitude modulation were Incon- entered into a one-sample t-test, producing t=6.89, which
gruent, that is, they were at different frequencies. Specifically, corresponds to p = 4.128e-09 (with d f =59).
the fish were sinusoidally oscillated in size, either at 6 Hz or We next focused on response times from trials on which
8 Hz, while the concurrent sound amplitude modulated at the correct responses were made. Mental chronometry (Posner,
other frequency, that is, 8 Hz or 6 Hz. For indices of audio- 2005) treats a response time as a composite of separable com-
visual integration, we contrasted players’ performance with ponents. Commonly, such components include movement
Congruent fish to their performance with Incongruent fish, time (MT), the time required to execute a motor response, and
using as metrics the proportion of categorizations that were reaction time, the time needed to perceive and process the
correct, and the latency of response on correct trials. Sixty stimulus and to select the response. As Doucet and Stelmack
test participants completed the entire five minute game; their (1999) noted, reaction time is influenced by the information4 GOLDBERG, SUN, HICKEY, SHINN-CUNNINGHAM & SEKULER
1.0 1100
0.9 1000
RT (in msec)
correct
0.8 900
Accuracy
Response time
Proportion
0.7 800
0.6 700
0.5 600
Congruent Incongruent Congruent Incongruent
factor(Condition)
Condition factor(Condition)
Condiition
Figure 3. Left: Mean accuracy for Congruent and Incongruent Fish. Right: Mean response times for Congruent and Incongruent
Fish. Error bars are within-subject standard errors of the mean.
processing demands of the subject’s task, while movement Table 1
time may not be. Fish Police!!’s accelerometer records al- Response and reaction times
lowed us to estimate MT from the time the player took to tilt
the tablet through 17 ◦ , the tilt threshold. To estimate each Congruent Incongruent
trial’s MT, we examined successive samples generated by the Response times
tablet’s accelerometer. For each trial, we found the difference Mean 1115.26 1164.91
between (i) the time at which the tablet’s tilt reached the SeM 17.95 22.38
threshold of 17 ◦ tilt either toward or away from the player, Reaction times
and (ii) the time at which the tablet began to be tilted con- Mean 939.67 1002.03
sistently in that threshold direction. The mean movement SeM 20.45 20.11
times for Congruent fish was 175.58 msec; the corresponding
mean for Incongruent fish was 162.88 msec. The difference
between these two means was not statistically significant,
t=0.9348, p>0.35 (d f =59) [95% confidence intervals for have traded accuracy for speed of response (Wickelgren,
the difference, -14.49490 and 39.91123]. Note that the 60 1977; Beilock, Bertenthal, Hoerger, & Carr, 2008; Heitz,
Hz sampling rate of the accelerometer introduced some irre- 2014). Viewing each fish for a longer time would have al-
ducible uncertainty into our mental chronometric estimates. lowed additional visual information to accumulate, thereby
One subject jiggled the tablet continuously, which it made it increasing the proportion of correct responses (Mazurek, Roit-
impossible to extract MT from his records; that subject’s data man, Ditterich, & Shadlen, 2003; Noppeney, Ostwald, &
were excluded from further analysis. Werner, 2010). More recently, Teichert, Ferrera, and Grin-
band (2014) showed that subjects strategically increase re-
Each trial’s MT was subtracted from its response time,
sponse accuracy by delaying the onset of their decisions.
yielding the reaction time for that trial. Thereafter, all chrono-
Would players whose reaction times were longer tend to pro-
metric analyses were done on values of this derived reac-
duced a higher proportion of correct responses? To evaluate
tion time variable. Players’ reaction times were significantly
this potential connection between players’ speed and accu-
shorter for Congruent fish than for Incongruent ones. The
racy we examined the correlation between two measures. In
mean difference between the two sets of reaction times was
Fig. fig:conRTeffect the effect of audiovisual congruence as
59.21 msec (95% confidence intervals [39.50, 78.95]. A t-test
represented by reaction time is plotted against the effect of
on the differences between the two sets of reaction times pro-
audiovisual congruence as represented by accuracy. These
duced t=6.00 (d f =59), for p = 1.277e-07. So both dependent
two measures of the congruency effect were not significantly
measures, time and accuracy, revealed reliable differences
correlated, r=-0.006; the 95% confidence interval included
between players’ processing of Congruent and Incongruent
zero [-0.255, 0.244]. So whatever factors contributed to dif-
fish.
ferences in the way that players were affected by audiovisual
We were interested in the possibility that subjects mightFISH POLICE!! 5
Accuracy Difference (in pr.)
congruence, these factors did not include adoption of some 400
RT Difference (in msec)
consistent speed-accuracy strategy. 0.6 300
200
0.3
100
0.0
300 0
RT Difference (in msec)
−0.3 −100
200 0 25 50 75 100 0 25 50 75 100
Age (in years) Age (in years)
100
Figure 5. The effect of congruence between a fish’s visual
0
and auditory signals as a function of player age. Left: effect
−100
of congruence expressed as the difference between percent
−0.25 0.00 0.25 0.50
Accuracy Difference (in pr.)
correct judgments when auditory and visual frequencies were
Congruent and when they were Incongruent. Right: The
Figure 4. Speed-accuracy relationship. Effect of audiovisual effect of congruence expressed as the difference in reaction
congruence defined by differences in reaction time plotted times for Congruent and Incongruent fish.
against the effect defined by differences in accuracy of re-
sponse. Data points are for individual players. The vertical
line separates the half of subjects whose accuracy-defined modes (button press vs. tablet tilt), number of trials each
congruency effects were largest and the half of subjects whose subject experienced (∼300 vs. 60), inter-fish intervals (∼2 vs.
effects were lowest; the horizontal line separates the half of 3 seconds), and number of subjects per experiment (10 vs. 60
subjects whose reaction time-defined congruency effects were subjects). Table 2 shows that despite these differences, the
largest and the half of subjects whose effects were smallest. main outcomes of the present study are very similar to what
If there were zero correlation between the two, data points was seen in each of the three laboratory experiments. This
would tend to be equally distributed among the graph’s four consistency across venues and conditions confirms the robust-
quadrants. ness of audiovisual integration that produced by temporally
correlated auditory and visual signals. Moreover, results from
Previous studies suggested that in humans, audiovisual the Museum and from the laboratory show that the effect of
integration emerges late in the first year of life (Neil, Chee- temporal correlation of auditory and visual signals is strong
Ruiter, Scheier, Lewkowicz, & Shimojo, 2006), but continues enough to survive even without a spatial correlation between
to be fine-tuned until somewhat later. Moreover, at least one visual and auditory information. That is, the spatial infor-
study (Roudaia, Sekuler, Bennett, & Sekuler, 2013) showed mation provided by vision (the fish’s trajectory across the
weakened audiovisual interaction in older adults. All of these stream) was not matched by a comparable change in auditory
studies used audiovisual stimuli and tasks that were quite spatial information.
different from those embodied in our game. Although we
were limited to testing subjects 6 years of age and older, we Table 2
thought it would be worthwhile to evaluate how audiovisual Results from the present study and from three laboratory
interaction in Fish Police!! varied with age. Figs. 5 and 4 experiments
show the results of this inquiry for accuracy and reaction time
measures, respectively. The slopes and confidence intervals Difference in Difference in
from linear regressions showed that neither congruence effect Source pr(Correct) Reaction Time
was statistically significant: for reaction time, p=0.13, and for Museum 0.15 59
accuracy, p=0.82. The 95% confidence intervals around the Expt 1 0.15 88
slope of regression against players’ age each included zero, Expt 2 0.11 100
[-0.0029, 0.0023] and [-2.12, 0.28], for accuracy and response Expt 3 0.20 74
time measures of congruence, respectively.
Discussion As explained above, results from the two dependent mea-
sures (Fig. 4) suggest that differences among players’ accu-
Results with each dependent measure were consistent with racy could not be explained simply by differences in their
results when a highly similar task was studied in a controlled, strategies for balancing the competing demands for speed and
laboratory setting (Sun et al., 2014). In addition to differences accuracy. It seems likely that the time constraints imposed
in the level of distractions, the experiments comprising the by the game design (allowing just two seconds to respond)
laboratory study differed in multiple ways from the conditions created high-pressure that might have particular effect on
in the Museum of Science. For example, they differed in size players tested at the Museum of Science. Each player had
of the display (33◦ vs. ∼14-15◦ visual angle wide), response just a few minutes total experience with game. Because of6 GOLDBERG, SUN, HICKEY, SHINN-CUNNINGHAM & SEKULER
this, it is possible that the time pressure would have impacted when a pair of people decided that they would play against
them more it would have more players with more experience one another. The leader board also helpful to players who
(Beilock et al., 2008). Although we cannot be certain, it did not do well, as it showed that there considerable variation
is plausible that the instructions that mentioned the cost of among players. In this regard, it was particularly helpful to
a missed response and the time-varying green progress bar parents of children whose play was good, but not perfect.
near the top of the display combined to encourage players to A less than perfect score made some players’ parents ask
prioritize speed of response. That speculation is consistent what was ‘‘wrong’’ with their child. Seeing the scores of the
with the observation that very few responses, only 28 out of preceding ten players helped to answer that question. Finally,
3600 (.009), failed to beat the deadline. the leader board encouraged players to ask a scientifically
In our video game, whenever a fish’s auditory and vi- important question, namely, why success varied from one
sual attributes were not congruent, the frequency at which player to another.
its sound was amplitude modulated not only did not match Even if some planned project did not entail auditory stim-
the frequency of its size oscillation, but instead matched uli, adopting some technique to attenuate extraneous sounds
the visual modulation rate of fish of the competing type, should be considered. The noise canceling headphones worn
either ‘‘good’’ or ‘‘bad’’ species. This particular form of while subjects played Fish Police!! were particularly useful,
mismatch between auditory and visual signals was intended to as they served two purposes. First, the headphones reduced
maximize stimulus-response interference (Fitts & Deininger, the saliency of the extraneous sounds that were plentiful in the
1954), which was expected to maximize the observed differ- Museum setting; second, the headphones signaled onlookers,
ences between responses to Congruent and Incongruent fish. particularly friends or family members, that the headphone’s
Presumably, other ways of generating incongruity between wearer was engaged in a serious task and therefore should not
a fish’s visual and auditory signals would produce reduced be disturbed.
differences between conditions. In settings like the Museum of Science, many visitors
Planning this project made us mindful of the many differ- are eager to take part in an activity that simultaneously is
ences between a public or quasi-public research environment, enjoyable and advances science. An experiment should be
on one hand, and the well-controlled dedicated research labo- engaging and provide a vehicle for subjects to become inter-
ratories in which we have been studying various aspects of ested in science and learn about real world applications of
audiovisual interactions, on the other hand (Sun et al., 2014; research. Embedding an experiment in a game is one effective
Benussen et al., 2014). Anticipating that other researchers way to achieve these goals. As researchers, we were gratified
might want to carry out research in a setting like the one that so many of the Museum visitors who Fish Police!! were
we found at the Museum, we offer some suggestions for quite interested in how their data would be used and how
optimizing such opportunities. their results would impact science. For their participation and
Of course, visual distractions and background noise are un- contribution, we are most appreciative.
avoidable in public spaces. In the Living Laboratory, visual
distractions included the Museum’s other scientific attrac- References
tions, the stream of curious passersby, as well as players’
friends, relatives and, for school age players, their classmates Abramov, I., Hainline, L., Turkel, J., Lemerise, E., Smith, H., Gor-
don, J., & Petry, S. (1984). Rocket-ship psychophysics. assessing
and teachers. To minimize these and other potential visual
visual functioning in young children. Investigative Ophthalmol-
distractions, we took the simple step of seating participants so
ogy & Visual Science, 25(11), 1307--1315.
that they faced a blank wall, with backs turned toward onlook- Beilock, S. L., Bertenthal, B. I., Hoerger, M., & Carr, T. H. (2008).
ers. Appreciable noise was generated by nearby interactive When does haste make waste? speed-accuracy tradeoff, skill
exhibits and by the chatter of excited visitors to Museum, level, and the tools of the trade. Journal of experimental Psychol-
particularly younger visitors. These sounds were consistently ogy: Applied, 14(4), 340--352.
∼76-80 dB SPL. To control the impact of audio distractions, Benussen, S., Chow, K., Varghese, L. A., Sekuler, R., Somers, D. C.,
participants wore Bose QuietComfort 15 Acoustic Noise Can- & Shinn-Cunningham, B. (2014). Bidirectional audiovisual
celing Headphones while playing the game. These provided interactions: Evidence from a computerized fishing game. In
∼30 dB attenuation. This reduction in background sound Meeting of the Acoustical Society of America.
helped subjects focus on the task, with reduced influence Doucet, C., & Stelmack, R. M. (1999). The effect of response
from the occasional heckling or encouragement of family or execution on P3 latency, reaction time, and movement time.
Psychophysiology, 36(3), 351--363.
friends, or by the general din of the Museum.
Eickhoff, C., Harris, C. G., de Vries, A. P., & Srinivasan, P. (2012).
As mentioned earlier, a publicly viewable video monitor Quality through flow and immersion: Gamifying crowdsourced
displayed each player’s initials, score, and the scores of the relevance assessments. In Proceedings of the 35th international
previous ten players. This leader board proved the leader ACM SIGIR Conference on Research and Development in Infor-
board was instrumental in motivating players, particularly mation Retrieval (pp. 871--880). Portland, Oregon: ACM.FISH POLICE!! 7
Fitts, P. M., & Deininger, R. (1954). S-R compatibility: corre-
spondence among paired elements within stimulus and response
codes. Journal of experimental Psychology, 48(6), 483--492.
Galton, F. (1895). On the Anthropometric Laboratory at the late
International Health Exhibition. London: Harrison and Sons.
Hawkins, G. E., Rae, B., Nesbitt, K. V., & Brown, S. D. (2013).
Gamelike features might not improve data. Behavior Research
Methods, 45(2), 301--318.
Heitz, R. P. (2014). The speed-accuracy tradeoff: history, physiol-
ogy, methodology, and behavior. Frontiers in Neuroscience, 8,
150.
Mazurek, M. E., Roitman, J. D., Ditterich, J., & Shadlen, M. N.
(2003). A role for neural integrators in perceptual decision mak-
ing. Cerebral Cortex, 13(11), 1257-69.
Miranda, A. T., & Palmer, E. M. (2014). Intrinsic motivation and
attentional capture from gamelike features in a visual search task.
Behavior Research Methods, 46(1), 159--172.
Neil, P. A., Chee-Ruiter, C., Scheier, C., Lewkowicz, D. J., & Shi-
mojo, S. (2006). Development of multisensory spatial integration
and perception in humans. Developmental Science, 9(5), 454--
464.
Noppeney, U., Ostwald, D., & Werner, S. (2010). Perceptual
decisions formed by accumulation of audiovisual evidence in
prefrontal cortex. Journal of Neuroscience, 30(21), 7434--7446.
Parise, C. V., Spence, C., & Ernst, M. O. (2012). When correlation
implies causation in multisensory integration. Current Biology,
22(1), 46--49.
Posner, M. I. (2005). Timing the brain: mental chronometry as a
tool in neuroscience. PLoS Biology, 3(2), e51.
Roudaia, E., Sekuler, A. B., Bennett, P. J., & Sekuler, R. (2013). Ag-
ing and audio-visual and multi-cue integration in motion. Fron-
tiers in Psychology, 4, 267.
Sun, Y., Shinn-Cunningham, B., Somers, D., & Sekuler, R. (2014).
Multisensory learning and integration in a first-person fisherman
game. In Meeting of the Cognitive Neuroscience Society.
Teichert, T., Ferrera, V. P., & Grinband, J. (2014). Humans optimize
decision-making by delaying decision onset. PLoS ONE, 9(3),
e89638.
Wickelgren, W. A. (1977). Speed-accuracy tradeoff and information
processing dynamics. Acta Psychologica, 41, 67--85.You can also read