Uncertainty-Aware COVID-19 Detection from Imbalanced Sound Data
←
→
Page content transcription
If your browser does not render page correctly, please read the page content below
Uncertainty-Aware COVID-19 Detection from Imbalanced Sound Data
                                                                  Tong Xia, Jing Han, Lorena Qendro, Ting Dang, Cecilia Mascolo

                                                       Department of Computer Science and Technology, University of Cambridge, UK
                                                                                                      tx229@cam.ac.uk

                                                                     Abstract                                     sounds [15, 16]. This issue is even more detrimental in deep
                                             Recently, sound-based COVID-19 detection studies have                learning as the data are limited and thus balancing solutions
                                         shown great promise to achieve scalable and prompt digital pre-          are insufficient [17]. In addition, even if machine learning can
                                         screening. However, there are still two unsolved issues hin-             achieve high precision, difficult diagnosis cases (e. g., out of
                                         dering the practice. First, collected datasets for model training        training data distribution, noise, sound distortion) are unavoid-
                                         are often imbalanced, with a considerably smaller proportion             able [18, 19]. In this respect, information about the reliability of
                                         of users tested positive, making it harder to learn representative       the automated COVID-19 screening is a key requirement to be
                                         and robust features. Second, deep learning models are generally          integrated into diagnostic systems for better risk management.
                                                                                                                  Yet, none of the existing works on sound-based COVID-19 de-
arXiv:2104.02005v2 [cs.SD] 18 Jun 2021

                                         overconfident in their predictions. Clinically, false predictions
                                         aggravate healthcare costs. Estimation of the uncertainty of             tection takes into consideration the uncertainty in the machine
                                         screening would aid this. To handle these issues, we propose an          learning prediction.
                                         ensemble framework where multiple deep learning models for                    In this paper, we propose an ensemble learning-based
                                         sound-based COVID-19 detection are developed from different              framework to tackle the training data imbalance and uncertainty
                                         but balanced subsets from original data. As such, data are uti-          estimation challenges, simultaneously. Briefly, when training
                                         lized more effectively compared to traditional up-sampling and           deep learning models for COVID-19 detection, a number of bal-
                                         down-sampling approaches: an AUC of 0.74 with a sensitivity              anced training sets are generated from the imbalanced data to
                                         of 0.68 and a specificity of 0.69 is achieved. Simultaneously,           learn multiple ensemble units. During inference, decisions are
                                         we estimate uncertainty from the disagreement across multiple            fused to maximize data utilization and improve generalization
                                         models. It is shown that false predictions often yield higher un-        ability. More importantly, we make use of the disagreement
                                         certainty, enabling us to suggest the users with certainty higher        across the learned deep learning models as a measure of uncer-
                                         than a threshold to repeat the audio test on their phones or to          tainty. Softmax probability may indicate the confidence of the
                                         take clinical tests if digital diagnosis still fails. This study paves   prediction, but it tends to overestimate confidence and requires
                                         the way for a more robust sound-based COVID-19 automated                 further calibration [20]. Instead, disagreement from deep en-
                                         screening system.                                                        sembles as the uncertainty estimation was proven to better rep-
                                         Index Terms: COVID-19, sound-based digital diagnosis, en-                resent the overall model confidence [21]. With uncertainty, pre-
                                         semble learning, uncertainty estimation                                  dictions with low confidence can be identified and these sam-
                                                                                                                  ples could be excluded from digital screening. The users who
                                                                                                                  produced these samples could be asked to repeat smartphone
                                                               1. Introduction                                    testing or referred on for different types of testing. As a con-
                                         Since the outbreak of the Coronavirus Disease 2019 (COVID-               sequence, this method improves the system performance and
                                         19) in March 2020, over 100 million confirmed cases and 2 mil-           patient safety at the same time [22].
                                         lion deaths have been identified globally. Frequent and massive               To help with this research, we launched a mobile app in
                                         screening with targeted interventions is of vital need to miti-          April 2020 to crowdsource sound data including breathing,
                                         gate the epidemic [1, 2]. Currently, the most common screen-             cough, and speech with self-reported COVID-19 testing re-
                                         ing tool for COVID-19 is the Reverse Transcription Polymerase            sults1 . In conclusion, our contributions in this paper are sum-
                                         Chain Reaction (RT-PCR), which is limited by cost, time, and             marised as follows,
                                         resources [3, 4]. To fight against the virus, researchers’ ef-
                                         fort has gone into exploring machine learning for fast, con-                  • To handle the limited and imbalanced training data
                                         tactless, and affordable COVID-19 detection from sounds on                      problem, we propose an deep ensemble learning-based
                                         smartphones [5]: COVID-19 is an infectious disease, and most                    framework for COVID-19 sounds analysis, yielding
                                         infected people experience mild to moderate respiratory ill-                    higher AUC and sensitivity compared to other balancing
                                         ness [6]. To validate the effectiveness of these approaches,                    approaches.
                                         sound data are normally collected with self-reported COVID-                   • To the best of our knowledge, we are the first to inves-
                                         19 testing results or more trustworthy COVID-19 clinical test-                  tigate the uncertainty of deep learning for sound-based
                                         ing codes.                                                                      COVID-19 detection, leading to a more reliable and ro-
                                              Although recently great progress have been witnessed on                    bust automated diagnosis system.
                                         cough [7, 8, 9, 10, 11] and speech-based [12, 13, 14] COVID-
                                         19 detection, there are still unsolved issues which hinder the                • We perform experiments on our collected data with
                                         rollout of this technology to the masses. First, the collected                  469 tested positive and 1 526 healthy control samples,
                                         sound data are generally imbalanced, with a small proportion of                 achieving an AUC of 0.74 against 0.62 from an SVM
                                         COVID-19 infected or tested positive participants [11, 12, 8].                  baseline. With the estimated uncertainty, the AUC is fur-
                                         Such imbalance in training makes the classifier biased to the                   ther improved up to 0.85.
                                         majority class for a relatively small loss, but it does not mean
                                         distinguishable COVID-19 features can be learned from human                 1 www.covid-19-sounds.org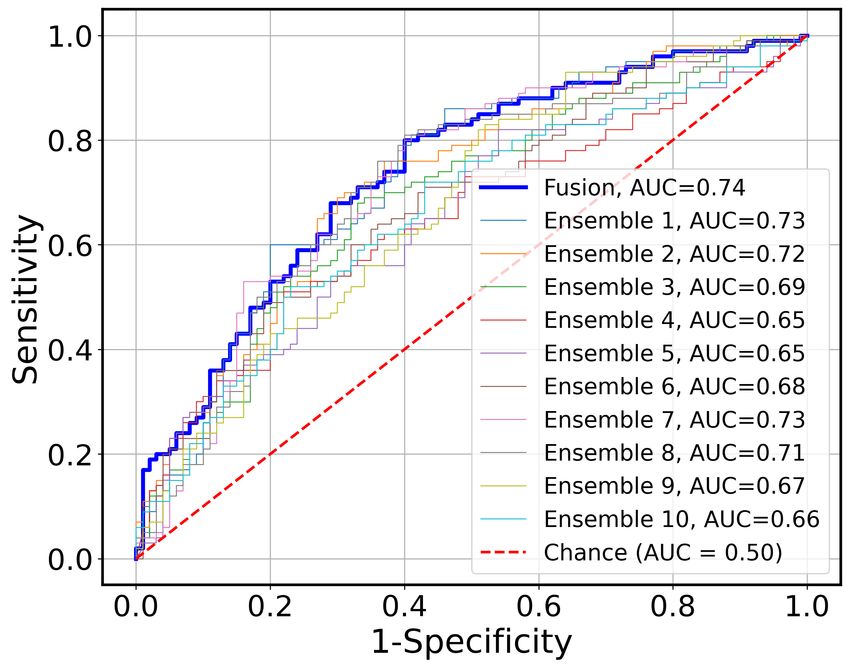
Figure 1: Uncertainty-aware deep ensemble learning-based COVID-19 detection framework. Balanced training sets are generated
to train multiple CNN-based models, and probabilities for a testing sample are fused to form the final decision. Simultaneously, the
disagreement level across these models as a measure of uncertainty is obtained and used to indicate the reliability of digital diagnose.

                   2. Related Works                                                         3. Methodology
In [7, 8, 10, 11, 23], respiratory sounds, especially coughs,          In this paper, we focus on developing an uncertainty-aware
have been analysed and detectable features have been discov-           audio-based covid-19 prediction model. In particular, the ba-
ered from spectrograms to distinguish COVID-19 coughs from             sic unit integrates information from three different sound types,
healthy or other disease coughs. At the same time, researchers         i. e., breathing, cough, and speech. Then, ensemble learning is
have exploited speech signals [12, 13, 14, 24], which are more         exploited to handle the highly unbalanced data. Furthermore,
natural and informative. All those studies demonstrate the             an uncertainty estimation can be obtained from the ensemble
promise of detecting COVID-19 form sounds, in a non-invasive,          framework. The proposed framework is illustrated in Figure 1.
inexpensive, and largely available manner. However, all the
above works have suffered from imbalanced data problem. For            3.1. COVID-19 Detection Model
instance, 92 COVID-19 tested positive and 1079 healthy sub-
jects were included in [8, 25]. The imbalance was either dealt         Three different modalities are adopted to develop the deep
with down-sampling, up-sampling or generally not yet tackled           learning-based COVID-19 detection model - the basic unit of
in the research [10, 26, 23, 11, 27]. However, down-sampling,          ensemble learning. Following previous work [10], the CNN
by discarding samples from the majority class, results in an even      model named Vggish [34] is applied and adapted as the fea-
smaller size of training data and might lose important discrim-        ture extractor, which is trained on a large-scale audio dataset
inative information, while up-sampling, by repeating samples           for audio event classification. In particular, Mel-spectrums are
from minority class, might change the original distribution of         extracted from each modality and fed into Vggish, which yield
the data and lead to model overfitting. Moreover, although Syn-        a 128-dimensional embedding for each 0.96-second audio seg-
thetic Minority Oversampling Technique (SMOTE) is a more               ment. It is followed with average pooling along the time-axis to
advanced up-sampling method [28], it is inherently dangerous           obtain a fixed-sized feature vector from length-varying inputs.
as it violates the independence assumption and blindly general-        The feature vectors of three modalities are then concatenated as
izes the minority area without regard to the majority class.           the combined features. Finally, another two dense layers with a
     There has been a consensus in the literature that uncertainty     softmax function are utilized as a binary classifier, the outputs
estimation could be used to aid automated clinical diagnosis, for      of which can be interpreted as the probability of COVID-19 in-
example for clinical imaging analysis [18]. In terms of COVID-         fection.
19 diagnosis, one work has obtained uncertainty from CT (com-
puterized tomography) scans to achieve interpretable COVID-            3.2. Ensemble Training and Inference
19 detection [29]. Though softmax probability may indicate
the confidence of the prediction, to some extent, it only cap-         Many machine learning approaches struggle to deal with
tures the relative probability that an instance is from a particu-     real-world health data because it is common to have imbal-
lar class, compared to the other classes, instead of the overall       anced datasets where the healthy users are a significant ma-
model confidence. Furthermore, it tends to overestimate con-           jority of the whole set. This is also the case for COVID-
fidence and thus requires further calibration [20]. In general,        19 sound-based detection, where the users who tested posi-
Bayesian Convolutional Neural Network [30] and Monte Carlo             tive are the minority class. To tackle this problem, as de-
Dropout (MCDrop) [31] & Monte Carlo Dropweights [29] have              scribed in Figure 1, we generate a series of training bags
been exploited to estimate uncertainty. However, Bayesian esti-        {(X1 , Y1 ), (X2 , Y2 ), ..., (XN , YN )} with an equal number of
mation is computationally expensive, which is not an optimal           positive and healthy users by re-sampling from the majority
solution for our task with limited training data, while Drop-          healthy class, where Xi denotes the input audio samples within
weights in [29], keeps dropout on during inference, reducing the       the i-th bag and Yi are the corresponding labels. Note that since
model capacity and may leading to lower accuracy [21]. With            some healthy users can be re-used, we can generate numerous
evidence suggesting that uncertainty from deep ensembles out-          bags. Consequently, based on a fixed and shared validation set,
performs MCDrop [21, 32, 33], this paper proposed the ensem-           we train N neural networks, as introduced in Sec. 3.1, via cross-
ble learning framework which tackles the data imbalance and            entropy loss, independently. During inference, we pass the test-
uncertainty estimation simultaneously within a unified frame-          ing sample x into the ensemble suite and obtain probability-
work.                                                                  based fusion [35] as the final output, formulated as follows,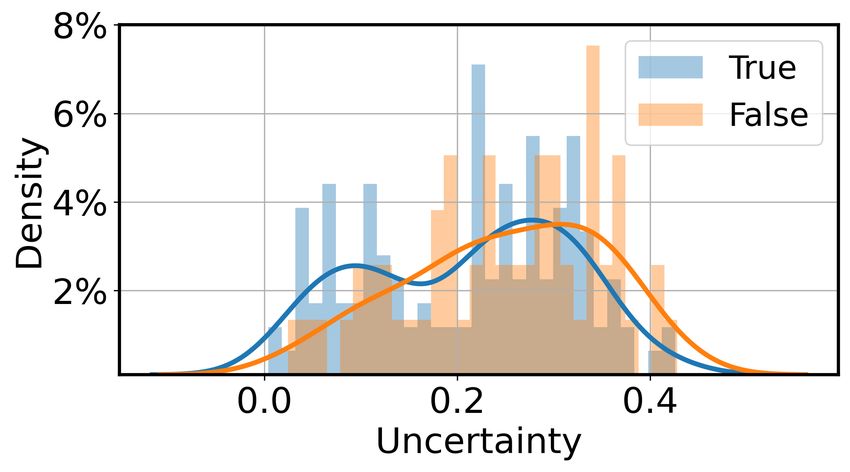
Table 1: Basic statistics of COVID-19 sound data.
                      N
                   1 X                                                                          Positive            Healthy
            p(y) =       P (y = 1|x, Xi , Yi , θi ),            (1)
                   N i=1                                                                 #Users     #Samples   #Users    #Samples
where P (y|x, Xi , Yi , θi ) is the predicted softmax probability of        Train         231          327       820       1871
i-th model. If p(y) is higher than 0.5, the given testing sample            Validation     33           44        33        56
will be predicted as COVID-19 positive.                                     Test          66           98        66         94

3.3. Uncertainty Estimation
                                                                       4.2. Experimental setup
No matter how good the deep learning model is, difficult cases
                                                                       To evaluate the proposed framework, for the positive group, we
to diagnose are unavoidable: this could be due to many reasons,
                                                                       hold out 10% and 20% of users as validation and testing sets,
including very noisy samples. This highlights the importance
                                                                       and then use the remaining data for training. Correspondingly,
of uncertainty estimation for the digital screening. Considering
                                                                       we select the same of healthy users for validation and testing
the incapability of softmax probability to capture model confi-
                                                                       (see Table 1). Furthermore, to generate a balanced training set
dence, we define the disagreement level across models within
                                                                       for each ensemble unit (Xi , Yi ), 231 users are randomly se-
the ensemble suite as the measure of uncertainty. Uncertainty
                                                                       lected from 820 negative tested users. The number of hidden
from deep ensembles has also been shown to be more effective
                                                                       units of dense layers in our model is set to 64 and 2, respec-
than other estimation approaches [21]. To be specific, we use
                                                                       tively. When training, our batch size is 1, the learning rate is
the standard deviation across the N models as the measurement
                                                                       0.0001 with a decay factor of 0.99 and we use cross-entropy loss
of uncertainty as follows,
                v                                                      and Adam optimiser. Early stopping is applied on the valida-
                u
                u1 X   N                                               tion set to avoid over-fitting. All experiments are implemented
       σ(y) = t          (P (y = 1|x, Xi , Yi , θi ) − µ)2 , (2)       in Python and TensorFlow. Feature extractor is initialled by
                   N i=1                                               pre-trained VGGish model and then updated with the following
                                                                       dense layers jointly.
where µ is the averaged probability, as p(y) in Eq. (1).                    Moreover, baselines from the latest literature are conducted
     If the uncertainty σ(y) is higher than a predefined thresh-       for performance comparison. In addition to deep models,
old, it implies that the model is confident enough with its pre-       acoustic feature-driven SVM achieved state-of-the-art perfor-
diction during digital pre-screening. Under this circumstance,         mance in sound-based COVID-19 detection due to its effective-
the system can first request a second or even more repeated au-        ness and robustness in small data learning [10, 12, 26]. There-
dio testing on smartphones. If the uncertainty is still high, this     fore, we repeat the experiments in [26] by using the openSMILE
particular sample could be then referred for further clinical or       toolkit to extract 384 acoustic features and SVM with linear ker-
another testing. As a consequence, both system performance             nel and complex constant C = 0.01 as the classifier. For both
and patient safety can be improved.                                    SVM and deep models, to test the superior performance of en-
                                                                       semble learning, we compare training one single model with
                       4. Evaluation                                   all samples, with balanced samples by down or up-sampling,
                                                                       against training N = 10 models in an ensemble learning man-
4.1. Dataset
                                                                       ner. For down-sampling balancing, we randomly discard some
Given the great potential of audio-based COVID-19 digital              healthy users, while for up-sampling, synthetic minority over-
screening, we launched an app, namely COVID-19 Sounds App,             sampling techniques (SMOTE) [28] is performed to generate
to crowdsource data for research. In the initial registration,         synthetic observations of the minority class. This is the most
users’ basic demographic and medical history information are           commonly adopted technique for imbalanced data.
required. Then, users are guided to record and submit breath-               To justify the performance of the proposed framework for
ing, coughing, and short speech audios, together with the lat-         COVID-19 screening and diagnosis, we calculate the follow-
est coronavirus testing results and associated symptoms, if any,       ing metrics: Sensitivity, also named true positive rate or recall
every other day. To be more specific, audios are three to five         defined by T P/(T P + F N ), Specificity, also referred to as
inhalation-exhalation sounds, three voluntary cough sounds,            true negative rate formulated by T N/(T N + F P ), and ROC-
and the participant reading a standard sentence from the screen        AUC, the area under receiver operating characteristics curve.
three times.                                                           which measures the overall sensitivity and specificity at vari-
     In this study, we focus on the group consisting of users who      ous probability thresholds. Besides, for both the baseline and
declared to have tested positive and ones who declared they            our proposed methods, the mean and standard deviation of the
have tested negative and declared no symptoms: we call these           aforementioned metrics across 10 runs are reported.
users “healthy”. To avoid any language confounders in the voice
recordings, only English speakers were retained. After a man-          4.3. Results
ual quality check, 330 positive users with 469 samples and 919
                                                                       4.3.1. Performance of Ensemble Learning
healthy users with 2 021 samples were selected. Overall, 58%
of the users are male and more than 60% are aged between 20 to         The overall comparison is presented in Table 2. First, deep
49. Demographic and medical history distributions are similar          learning is more vulnerable than the SVM model with imbal-
in the two classes. As for pre-processing, we resample all the         anced training data. When the CNN model achieves an ROC-
recordings to 16 kHz mono audios, and then remove the silence          AUC of 0.69, against 0.60 of SVM, the sensitivity is very low
period at the beginning and the end of the recording as in [26].       because the model is biased to the healthy class, and the very
Finally, audio normalisation by calibrating the peak amplitude         high specificity of 0.98 is practically meaningless. Second, re-
to 1 is applied to eliminate the discrepancy across recording de-      sampling can improve the performance, especially in terms of
vices.                                                                 sensitivity for both SVM and deep learning, since a balanced
Table 2: Performance comparison with Mean(Std) for ROC-
AUC, Sensitivity, and Specificity reported for Single model (SM)
and Ensemble model.
ROC-AUC Sensitivity Specificity
SVM 0.60 0.54 0.57
SM imbalanced data
CNN 0.69 0.15 0.98
SVM 0.60(0.03) 0.68(0.05) 0.45(0.05)
SM down-sampling
CNN 0.68(0.04) 0.62(0.04) 0.63(0.06)
(a) Uncertainty distrubution.
SVM 0.62(0.02) 0.53(0.02) 0.63(0.02)
SM up-sampling
CNN 0.70(0.04) 0.52(0.02) 0.77(0.05)
SVM 0.66(0.04) 0.63(0.05) 0.62(0.04)
Ensemble model
CNN 0.74(0.03) 0.68(0.05) 0.69(0.06)
(b) Uncertainty threshold. (c) Remained fraction.
Figure 3: Performance for uncertainty-aware referral.
Inspired by the findings, we set up thresholds to exclude
some testing cases when the uncertainty is higher than a given
value. Results from our dataset are shown in Figure 3(b), from
which we can find that when keeping only testing samples with
an uncertainty lower than 0.2, the AUC can be improved from
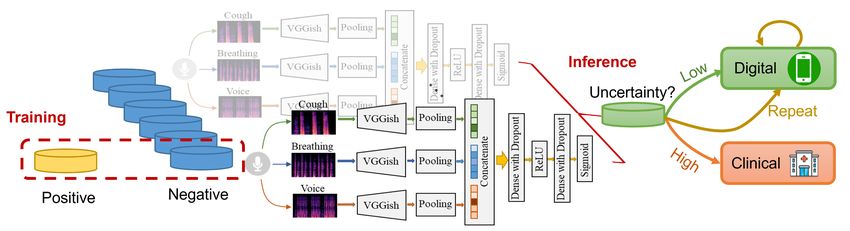
Figure 2: ROC curves of COVID-19 detection, where the curve 0.74 to 0.79, and when the threshold is 0.12, the highest AUC
of each ensemble unit model is shown separately. The ROC value is reached at 0.85. Note that the drop on the left side of the
curve after probability-based fusion is shown in bold. curve is caused by a small number of samples to calculate the
metric. These results show that studying predictive uncertainty
training set is guaranteed. Compared to down-sampling, up- and finding the optimal threshold can significantly improve au-
sampling performs better, as expected, because more data sam- tomatic digital prediction.
ples are available for parameter learning. Third, ensembles can Referral for further testing can impose a range of costs
boost the performance of both SVM and CNN. Last but not which can vary from a cost-negligible “repeat the audio test on
least, our CNN ensemble framework outperforms all the base- your phone” to a clinician inspection or visit. In this respect, we
lines and achieves an AUC of 0.74 with a sensitivity and a speci- inspect the AUC on different factions of retained data with the
ficity close to 0.7, demonstrating the superiority of exploiting uncertainty lower than a certain threshold (assuming the sam-
ensemble learning and deep CNN network for COVID-19 de- ples above this threshold would be referred on). Figure 3(c)
tection from imbalanced data. In addition, the commonly used shows that the AUC climbs from 0.74 to 0.76 when 15% of the
majority voting fusion method [35] was also validated in com- samples with the highest uncertainty are excluded. When only
parison to our proposed probability-based fusion: an AUC of remaining 25% data with the lowest uncertainty, the AUC can
0.74 with a sensitivity of 0.62 and a specificity of 0.70 was ob- increase to 0.85. This indicates that our measurement for un-
tained. Given the same AUC but lower sensitivity, we confirm certainty is informative and helpful for a more robust automatic
that probability-based fusion is more promising. COVID-19 diagnosis system.
To further inspect the ensemble suite, we visualise the ROC
curves for each unit model in Figure 2 for comparison. All ROC 5. Conclusions
curves are above chance level but the model variance is not neg-
ligible. A plausible explanation is that we only have a small In this work, a sound-based machine learning approach has been
training dataset for each unit. However, after probability-based proposed to discriminate COVID-19 cases from health controls.
fusion, the ROC curve is generally higher than the other curves. Ensemble learning has been explored to solve the imbalanced
All these demonstrate that ensembles can improve the robust- training data challenge, yielding favorable performance gain on
ness and generation ability of machine learning models. an in-the-wild crowdsourced dataset. In addition, uncertainty
has been measured via the disagreement across ensembles, and
To conclude, by integrating multiple networks trained from
thus enables confidence-informed digital diagnose. To the best
different balanced data, our proposed approach achieves state-
of our knowledge, we are the first to introduce uncertain-aware
of-the-art with the AUC of 0.74, the sensitivity of 0.68 and the
deep learning approach to sound-based COVID-19 detection
specificity of 0.69 for COVID-19 detection.
studies.
For future work, we plan to gain deeper understanding on
4.3.2. Estimation and Application of Uncertainty
the estimated uncertainty, exploring how each modality (breath-
By using the standard deviation across ensemble models as the ing, cough, speech) contributes to the overall uncertainty. Our
measure of uncertainty, we are able to understand the confi- data collection is still ongoing which will yield more data to
dence of the predictions. We illustrate the uncertainty distribu- train our framework for further performance evaluation.
tion in Figure 3(a). The density of high uncertainty values for
false prediction is significantly higher than that of true predic- 6. Acknowledgements
tion, indicating that our approach succeeds in identifying less
confident predictions when making an incorrect diagnosis. This work was supported by ERC Project 833296 (EAR).7. References [18] C. Leibig, V. Allken, M. S. Ayhan, P. Berens, and S. Wahl, “Lever-
aging uncertainty information from deep neural networks for dis-
[1] E. Hunter, D. A. Price, E. Murphy, I. S. van der Loeff, K. F. Baker, ease detection,” Scientific Reports, vol. 7, no. 1, pp. 1–14, 2017.
D. Lendrem, C. Lendrem, M. L. Schmid, L. Pareja-Cebrian,
A. Welch et al., “First experience of COVID-19 screening of [19] L. Qendro, J. Chauhan, A. G. C. Ramos, and C. Mascolo, “The
health-care workers in england,” The Lancet, vol. 395, no. 10234, benefit of the doubt: Uncertainty aware sensing for edge comput-
pp. e77–e78, 2020. ing platforms,” arXiv:2102.05956, 2021.
[2] A. Atkeson, M. C. Droste, M. Mina, and J. H. Stock, “Economic [20] C. Guo, G. Pleiss, Y. Sun, and K. Q. Weinberger, “On calibration
benefits of COVID-19 screening tests,” National Bureau of Eco- of modern neural networks,” in Proceedings of the International
nomic Research, 2020. Conference on Machine Learning (ICML), 2017, pp. 1321–1330.
[3] M. Cevik, K. Kuppalli, J. Kindrachuk, and M. Peiris, “Virology, [21] B. Lakshminarayanan, A. Pritzel, and C. Blundell, “Simple and
transmission, and pathogenesis of SARS-CoV-2,” British Medical scalable predictive uncertainty estimation using deep ensembles,”
Journal, vol. 371, pp. 1–6, 2020. in Proceedings of the 31st International Conference on Neural
Information Processing Systems (NeurIPS), 2017, pp. 6405–6416.
[4] C. B. Vogels, A. F. Brito, A. L. Wyllie, J. R. Fauver, I. M. Ott,
C. C. Kalinich, M. E. Petrone, A. Casanovas-Massana, M. C. [22] M.-H. Laves, S. Ihler, T. Ortmaier, and L. A. Kahrs, “Quantifying
Muenker, A. J. Moore et al., “Analytical sensitivity and efficiency the uncertainty of deep learning-based computer-aided diagnosis
comparisons of SARS-CoV-2 RT–qPCR primer–probe sets,” Na- for patient safety,” Current Directions in Biomedical Engineering,
ture Microbiology, vol. 5, no. 10, pp. 1299–1305, 2020. vol. 5, no. 1, pp. 223–226, 2019.
[5] B. W. Schuller, D. M. Schuller, K. Qian, J. Liu, H. Zheng, and [23] M. Pahar, M. Klopper, R. Warren, and T. Niesler, “COVID-19
X. Li, “COVID-19 and computer audition: An overview on what cough classification using machine learning and global smart-
speech & sound analysis could contribute in the sars-cov-2 corona phone recordings,” arXiv:2012.01926, 2020.
crisis,” Frontiers in Digital Health, vol. 3, pp. 1–10, 2021. [24] B. W. Schuller, A. Batliner, C. Bergler, C. Mascolo, J. Han,
[6] W.-j. Guan, Z.-y. Ni, Y. Hu, W.-h. Liang, C.-q. Ou, J.-x. He, I. Lefter, H. Kaya, S. Amiriparian, A. Baird, L. Stappen et al.,
L. Liu, H. Shan, C.-l. Lei, D. S. Hui et al., “Clinical characteris- “The INTERSPEECH 2021 computational paralinguistics chal-
tics of coronavirus disease 2019 in china,” New England Journal lenge: COVID-19 cough, COVID-19 speech, escalation & pri-
of Medicine, vol. 382, no. 18, pp. 1708–1720, 2020. mates,” arXiv:2102.13468, 2021.
[7] W. Wei, J. Wang, J. Ma, N. Cheng, and J. Xiao, “A real-time [25] N. Sharma, P. Krishnan, R. Kumar, S. Ramoji, S. R. Chetupalli,
robot-based auxiliary system for risk evaluation of COVID-19 in- P. K. Ghosh, S. Ganapathy et al., “Coswara–a database of breath-
fection,” in Proceedings of INTERSPEECH, 2020, pp. 701–705. ing, cough, and voice sounds for COVID-19 diagnosis,” in Pro-
ceedings of INTERSPEECH, 2020, pp. 4811–4815.
[8] A. Imran, I. Posokhova, H. N. Qureshi, U. Masood, M. S. Riaz,
K. Ali, C. N. John, M. I. Hussain, and M. Nabeel, “Ai4COVID- [26] J. Han, C. Brown, J. Chauhan, A. Grammenos, A. Hasthanasom-
19: Ai enabled preliminary diagnosis for COVID-19 from cough bat, D. Spathis, T. Xia, P. Cicuta, and C. Mascolo, “Exploring
samples via an app,” Informatics in Medicine Unlocked, vol. 20, automatic COVID-19 diagnosis via voice and symptoms from
p. 100378, 2020. crowdsourced data,” in Proceedings of the International Con-
ference on Acoustics, Speech, and Signal Processing (ICASSP),
[9] P. Bagad, A. Dalmia, J. Doshi, A. Nagrani, P. Bhamare, A. Ma-
2021, pp. 1–5.
hale, S. Rane, N. Agarwal, and R. Panicker, “Cough against
covid: Evidence of COVID-19 signature in cough sounds,” [27] B. W. Schuller, H. Coppock, and A. Gaskell, “Detecting COVID-
arXiv:2009.08790, 2020. 19 from breathing and coughing sounds using deep neural net-
works,” arXiv:2012.14553, 2020.
[10] C. Brown, J. Chauhan, A. Grammenos, J. Han, A. Hasthanasom-
bat, D. Spathis, T. Xia, P. Cicuta, and C. Mascolo, “Exploring [28] N. V. Chawla, K. W. Bowyer, L. O. Hall, and W. P. Kegelmeyer,
automatic diagnosis of COVID-19 from crowdsourced respira- “SMOTE: synthetic minority over-sampling technique,” Journal
tory sound data,” in Proceedings of the 26th ACM SIGKDD In- of Artificial Intelligence Research, vol. 16, pp. 321–357, 2002.
ternational Conference on Knowledge Discovery & Data Mining [29] B. Ghoshal and A. Tucker, “Estimating uncertainty and inter-
(KDD), 2020, pp. 3474–3484. pretability in deep learning for coronavirus (COVID-19) detec-
[11] J. Laguarta, F. Hueto, and B. Subirana, “COVID-19 artificial intel- tion,” arXiv:2003.10769, 2020.
ligence diagnosis using only cough recordings,” IEEE Open Jour- [30] M. Teye, H. Azizpour, and K. Smith, “Bayesian uncertainty es-
nal of Engineering in Medicine and Biology, vol. 1, pp. 275–281, timation for batch normalized deep networks,” in Proceedings of
2020. the International Conference on Machine Learning (ICML), 2018,
[12] J. Han, K. Qian, M. Song, Z. Yang, Z. Ren, S. Liu, J. Liu, pp. 4907–4916.
H. Zheng, W. Ji, T. Koike, and B. W. Schuller, “An early study [31] Y. Gal and Z. Ghahramani, “Dropout as a bayesian approxima-
on intelligent analysis of speech under COVID-19: Severity, sleep tion: Representing model uncertainty in deep learning,” in Pro-
quality, fatigue, and anxiety,” in Proceedings of INTERSPEECH, ceedings of the International Conference on Machine Learning
2020, pp. 4946–4950. (ICML), 2016, pp. 1050–1059.
[13] G. Pinkas, Y. Karny, A. Malachi, G. Barkai, G. Bachar, and [32] Y. Ovadia, E. Fertig, J. Ren, Z. Nado, D. Sculley, S. Nowozin,
V. Aharonson, “Sars-cov-2 detection from voice,” IEEE Open J. V. Dillon, B. Lakshminarayanan, and J. Snoek, “Can you trust
Journal of Engineering in Medicine and Biology, vol. 1, pp. 268– your model’s uncertainty? Evaluating predictive uncertainty un-
274, 2020. der dataset shift,” arXiv:1906.02530, 2019.
[14] M. Asiaee, A. Vahedian-Azimi, S. S. Atashi, A. Keramatfar,
[33] X. Wu, K. M. Knill, M. J. Gales, and A. Malinin, “Ensemble ap-
and M. Nourbakhsh, “Voice quality evaluation in patients with
proaches for uncertainty in spoken language assessment,” in Pro-
COVID-19: An acoustic analysis,” Journal of Voice, pp. 1–7,
ceedings of INTERSPEECH, 2020, pp. 3860–3864.
2020.
[34] S. Hershey, S. Chaudhuri, D. P. Ellis, J. F. Gemmeke, A. Jansen,
[15] X. Guo, Y. Yin, C. Dong, G. Yang, and G. Zhou, “On the class im-
R. C. Moore, M. Plakal, D. Platt, R. A. Saurous, B. Seybold et al.,
balance problem,” in Proceedings of the International Conference
“CNN architectures for large-scale audio classification,” in Pro-
on Natural Computation (ICNC), vol. 4, 2008, pp. 192–201.
ceedings of the International Conference on Acoustics, Speech,
[16] M. Schubach, M. Re, P. N. Robinson, and G. Valentini, and Signal Processing (ICASSP), 2017, pp. 131–135.
“Imbalance-aware machine learning for predicting rare and com-
[35] B. W. Schuller, S. Steidl, A. Batliner, P. B. Marschik, H. Baumeis-
mon disease-associated non-coding variants,” Scientific Reports,
ter, F. Dong, S. Hantke, F. B. Pokorny, E.-M. Rathner, K. D. Bartl-
vol. 7, no. 1, pp. 1–12, 2017.
Pokorny et al., “The 2018 computational paralinguistics chal-
[17] N. Japkowicz and S. Stephen, “The class imbalance problem: A lenge: Atypical self-assessed affect, crying & heart beats.” in Pro-
systematic study,” Intelligent Data Analysis, vol. 6, no. 5, pp. 429– ceedings of the INTERSPEECH, 2018, pp. 122–126.
449, 2002.You can also read